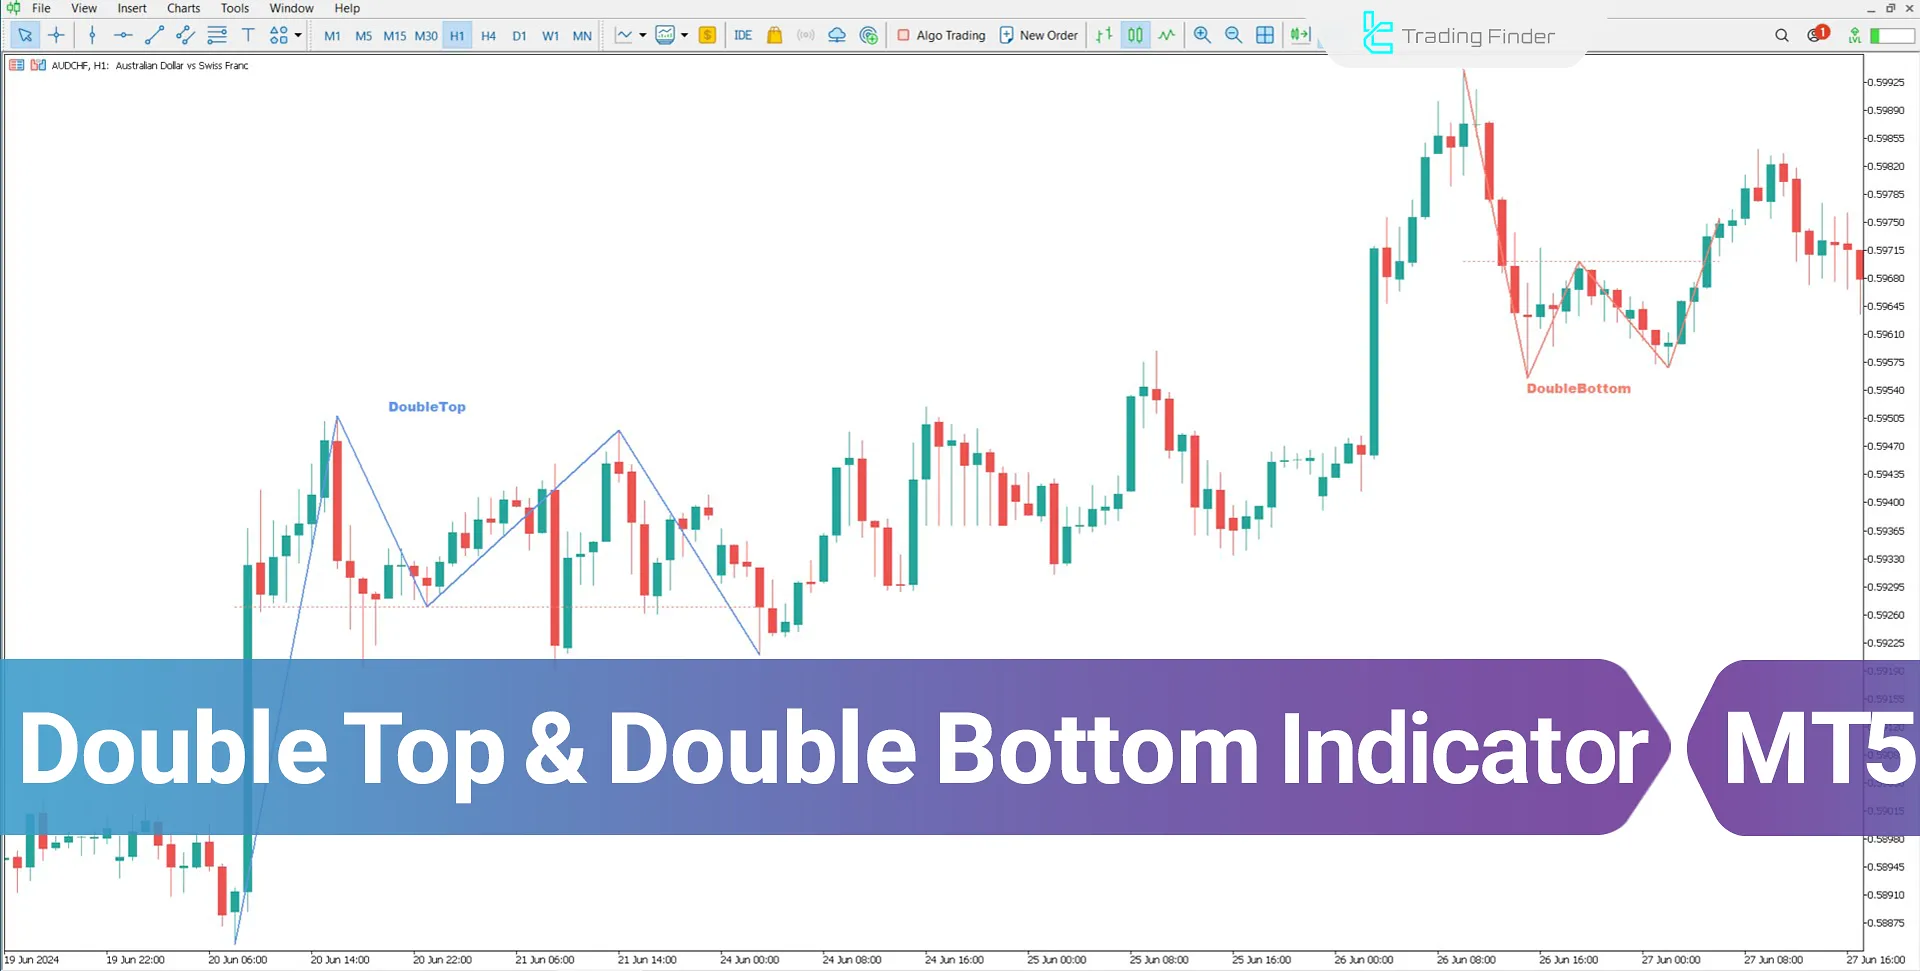


The Double Top & Double Bottom (DTDB) Indicator on the Meta Trader 5 Indicator uses the Zig Zag indicator with a period of 3 to identify and draw the classic double top and double bottom patterns.
TheDTDB Indicator shows double tops in blue and double bottoms in red, allowing traders to recognize these significant patterns on the chart quickly.
DTDB Indicator Table
Indicator Categories: | Support & Resistance MT5 Indicators Chart & Classic MT5 Indicators Educational MT5 Indicators |
Platforms: | MetaTrader 5 Indicators |
Trading Skills: | Elementary |
Indicator Types: | Leading MT5 Indicators Reversal MT5 Indicators |
Timeframe: | Multi-Timeframe MT5 Indicators |
Trading Style: | Intraday MT5 Indicators Scalper MT5 Indicators Day Trading MT5 Indicators |
Trading Instruments: | Forex MT5 Indicators Crypto MT5 Indicators Commodity MT5 Indicators |
Indicator at a Glance
The Double Top and Bottom Pattern is a specialized tool for identifying double and double bottom patterns on price charts. It leverages the MetaTrader5 ZigZag indicator to detect these patterns, displaying double tops in blue and double bottoms in red.
Additionally, it uses labeling to accurately highlight these patterns, making it easier for traders to recognize them effortlessly.
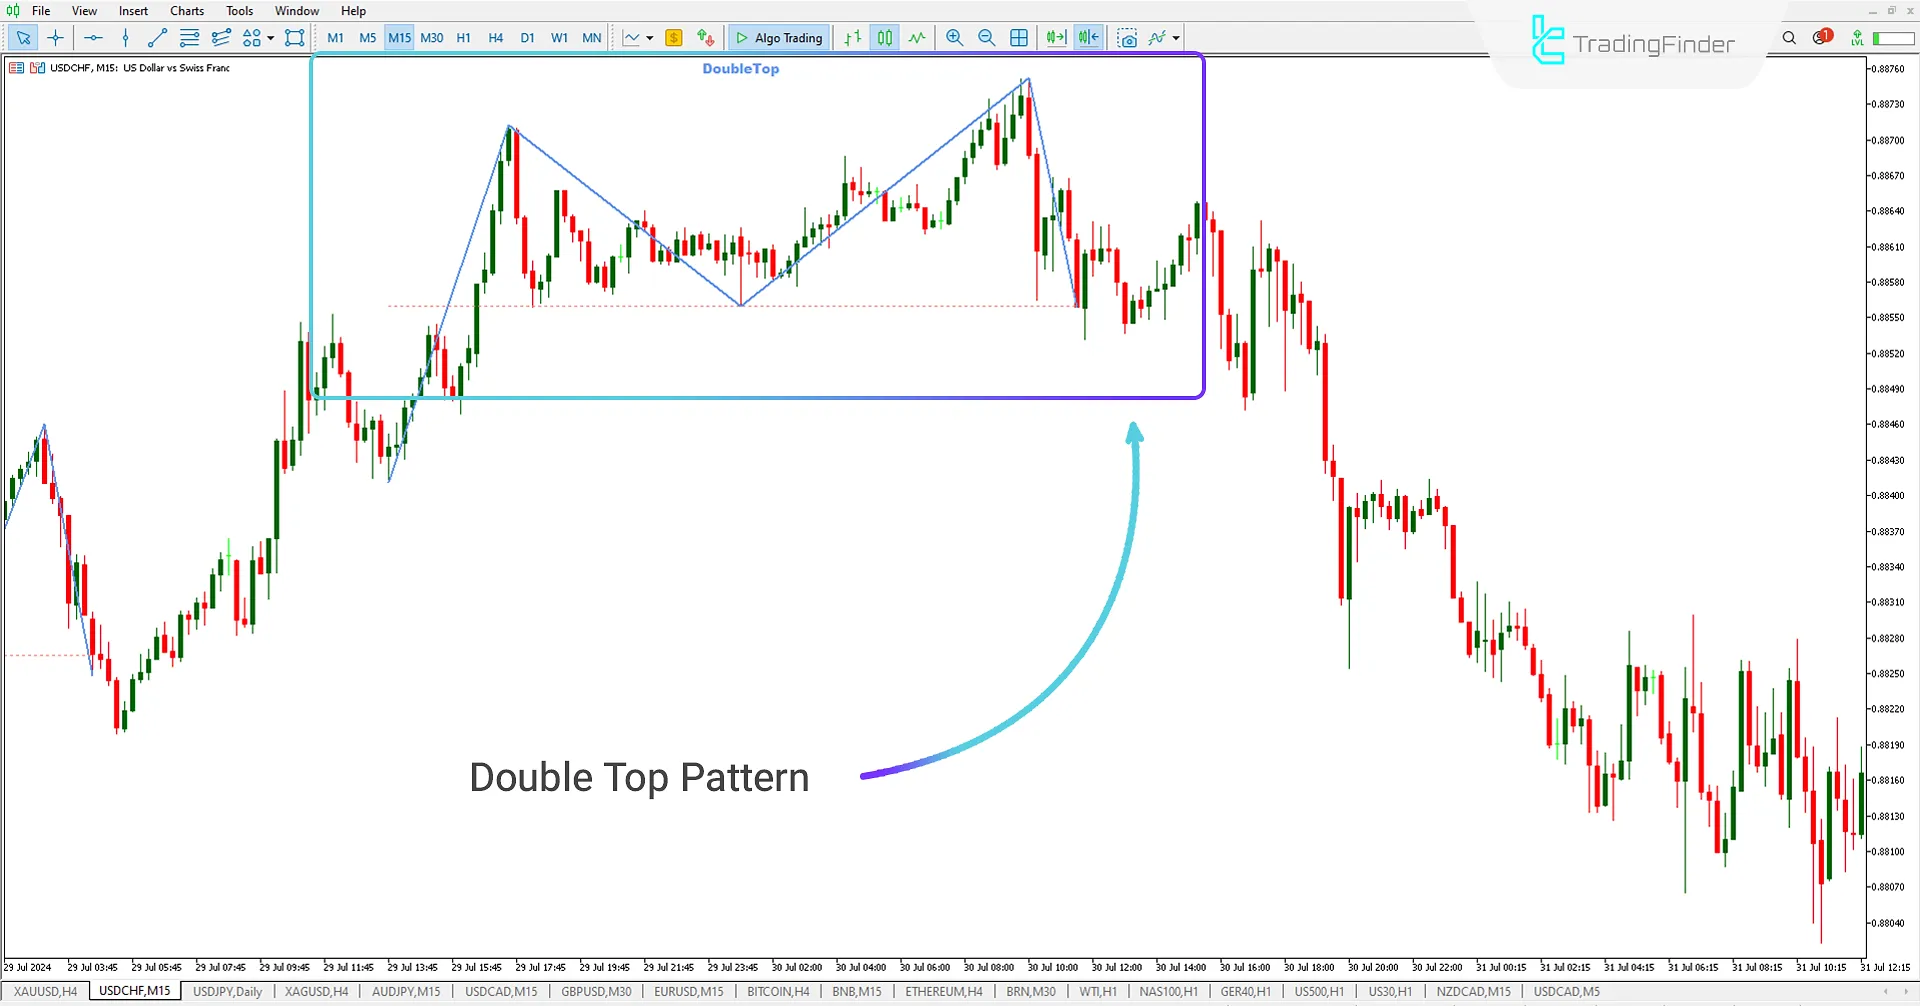
Double Top Pattern
In the 15-minute chart of USD/CHF, the Double Top & Double Bottom (DTDB) Indicator displays double top patterns in blue using the Zig Zag indicator. This feature helps traders easily identify double-top patterns and perform more accurate analyses.

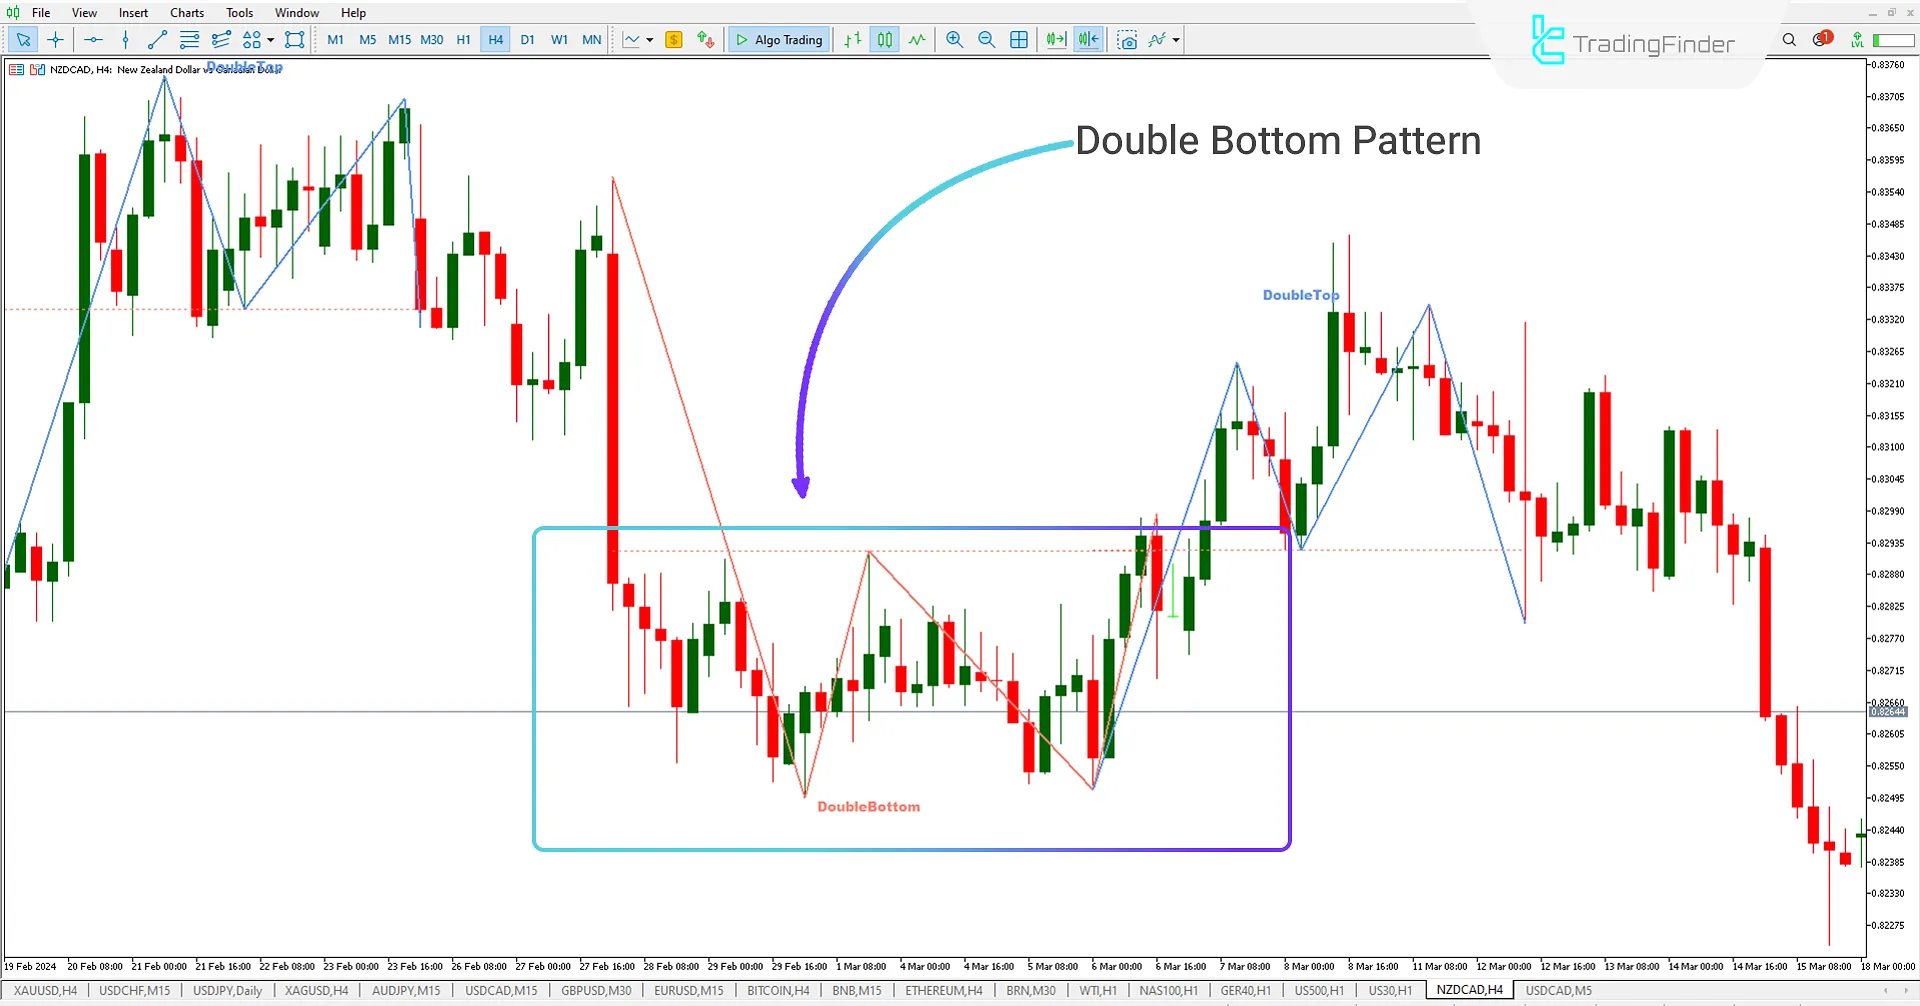
Double Bottom Pattern
In the 4-hour chart of NZD/CAD, the Double Top & Double Bottom (DTDB) Indicator displays double bottom patterns in red using the Zig Zag indicator. This feature helps traders easily identify double-bottom patterns and perform more accurate analyses.

DTDB Indicator Settings

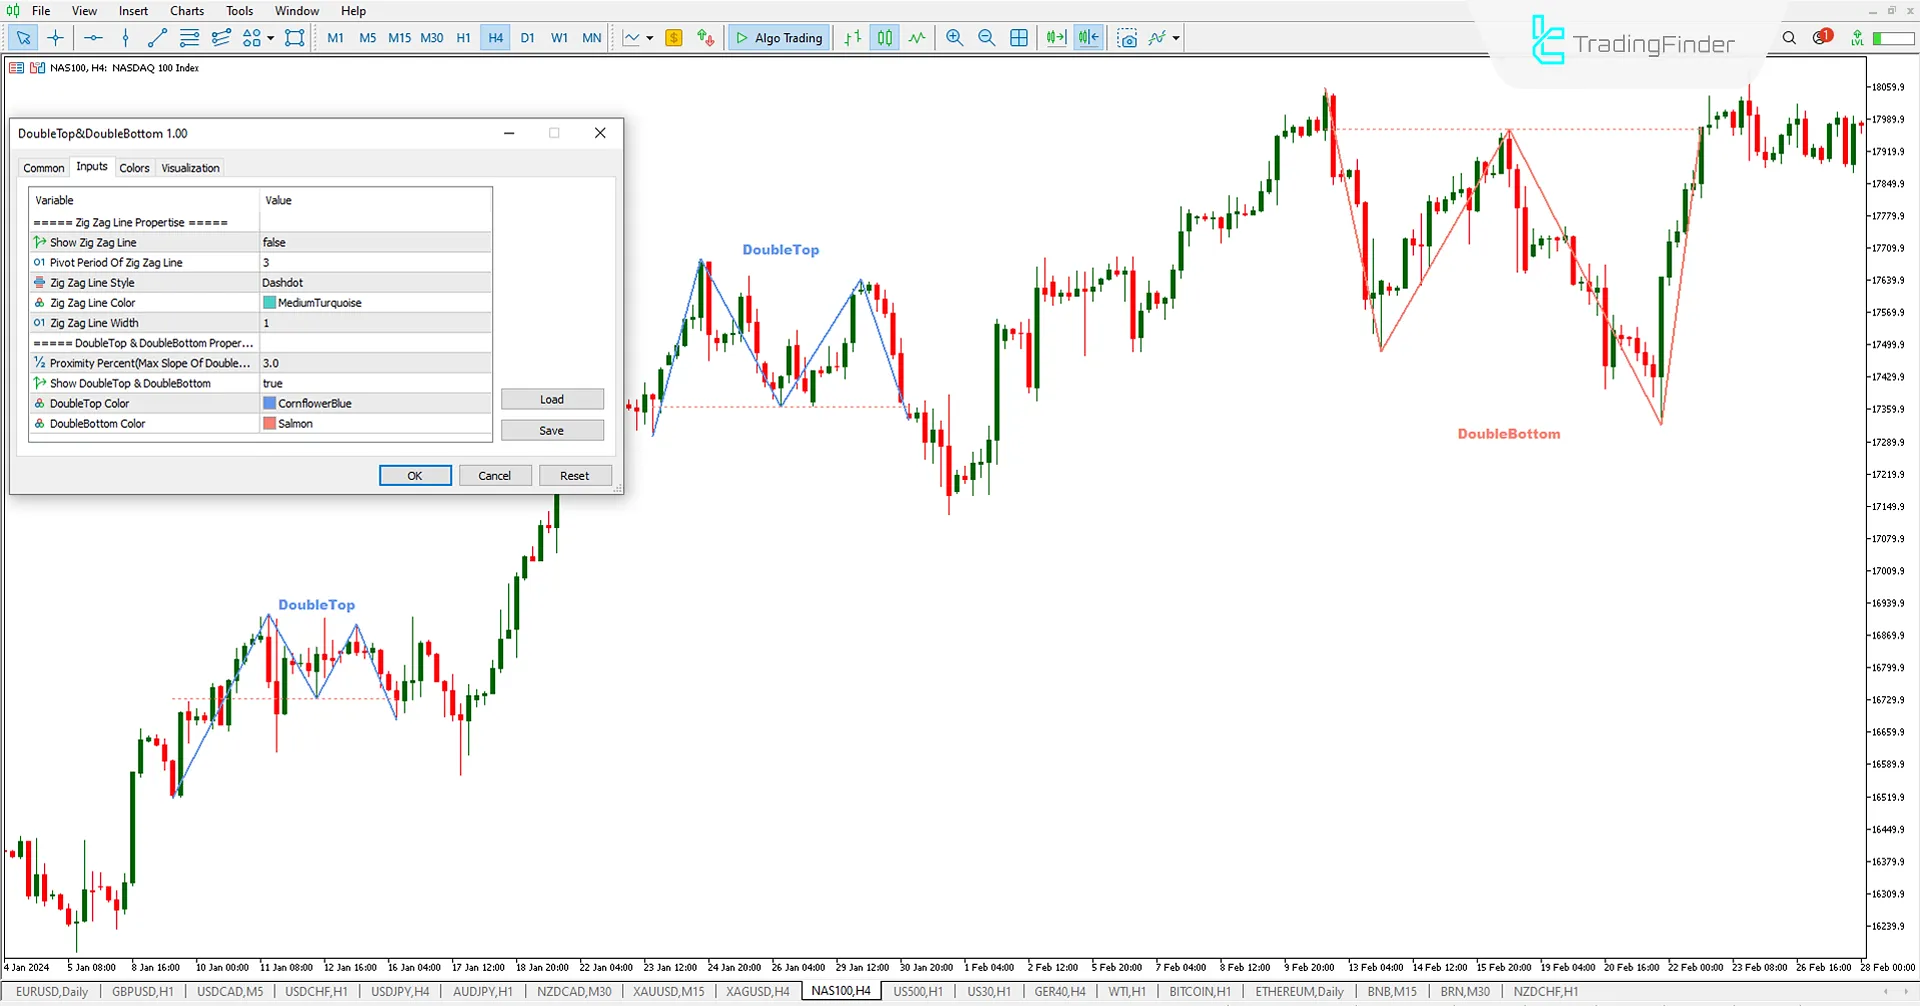
- Zig Zag Line Properties: Settings for the Zig Zag line;
- Show Zig Zag Line: Toggle the display of the Zig Zag line;
- Pivot Period of Zig Zag Line: Set the period for the Zig Zag line;
- Zig Zag Line Style: Choose the style for the Zig Zag line;
- Zig Zag Line Color: Choose the color for the Zig Zag line;
- Zig Zag Line Width: Choose the width for the Zig Zag line;
- Double Top & Double Bottom Properties: Settings for Double Top & Double Bottom;
- Proximity Percent: Set the proximity percentage;
- Show Double Top & Double Bottom: Toggle the display of Double Top & Double Bottom;
- Double Top Color: Choose the color for Double Top;
- Double Bottom Color: Choose the color for Double Bottom.
Conclusion
The Double Top & Double Bottom (DTDB) Indicator is a tool for identifying classic double top and double bottom patterns, which are automatically displayed on the chart. The DTDB Indicator makes it easier for traders to identify these patterns by displaying double tops in blue and double bottoms in red, thereby enhancing trading strategy.
Double Top Double Bottom MT5 PDF
Double Top Double Bottom MT5 PDF
Click to download Double Top Double Bottom MT5 PDFWhat is the Double Top & Double Bottom Indicator?
The Double Top & Double Bottom Indicator is a tool that helps identify reversal patterns on the price chart. These patterns usually indicate a trend change: the Double Top suggests an uptrend's end and a downtrend's beginning. In contrast, the Double Bottom indicates the end of a downtrend and the beginning of an uptrend.
How does the Double Top pattern work?
The Double Top pattern forms when the price hits a particular resistance level twice and fails to break it. This pattern indicates that the market faces selling pressure and will likely enter a downtrend.
Por favor disponibilize a versão MT4 desse inficador.
Todos os indicadores estão disponíveis nas versões MetaTrader 4 e 5 e podem ser selecionados e baixados no menu lateral e na parte superior.
This is a great tool for those who understand the market movement I wish it had alerts when this double top or buttom appeared other than that it is still the best been looking for something like this good job TFlabs


