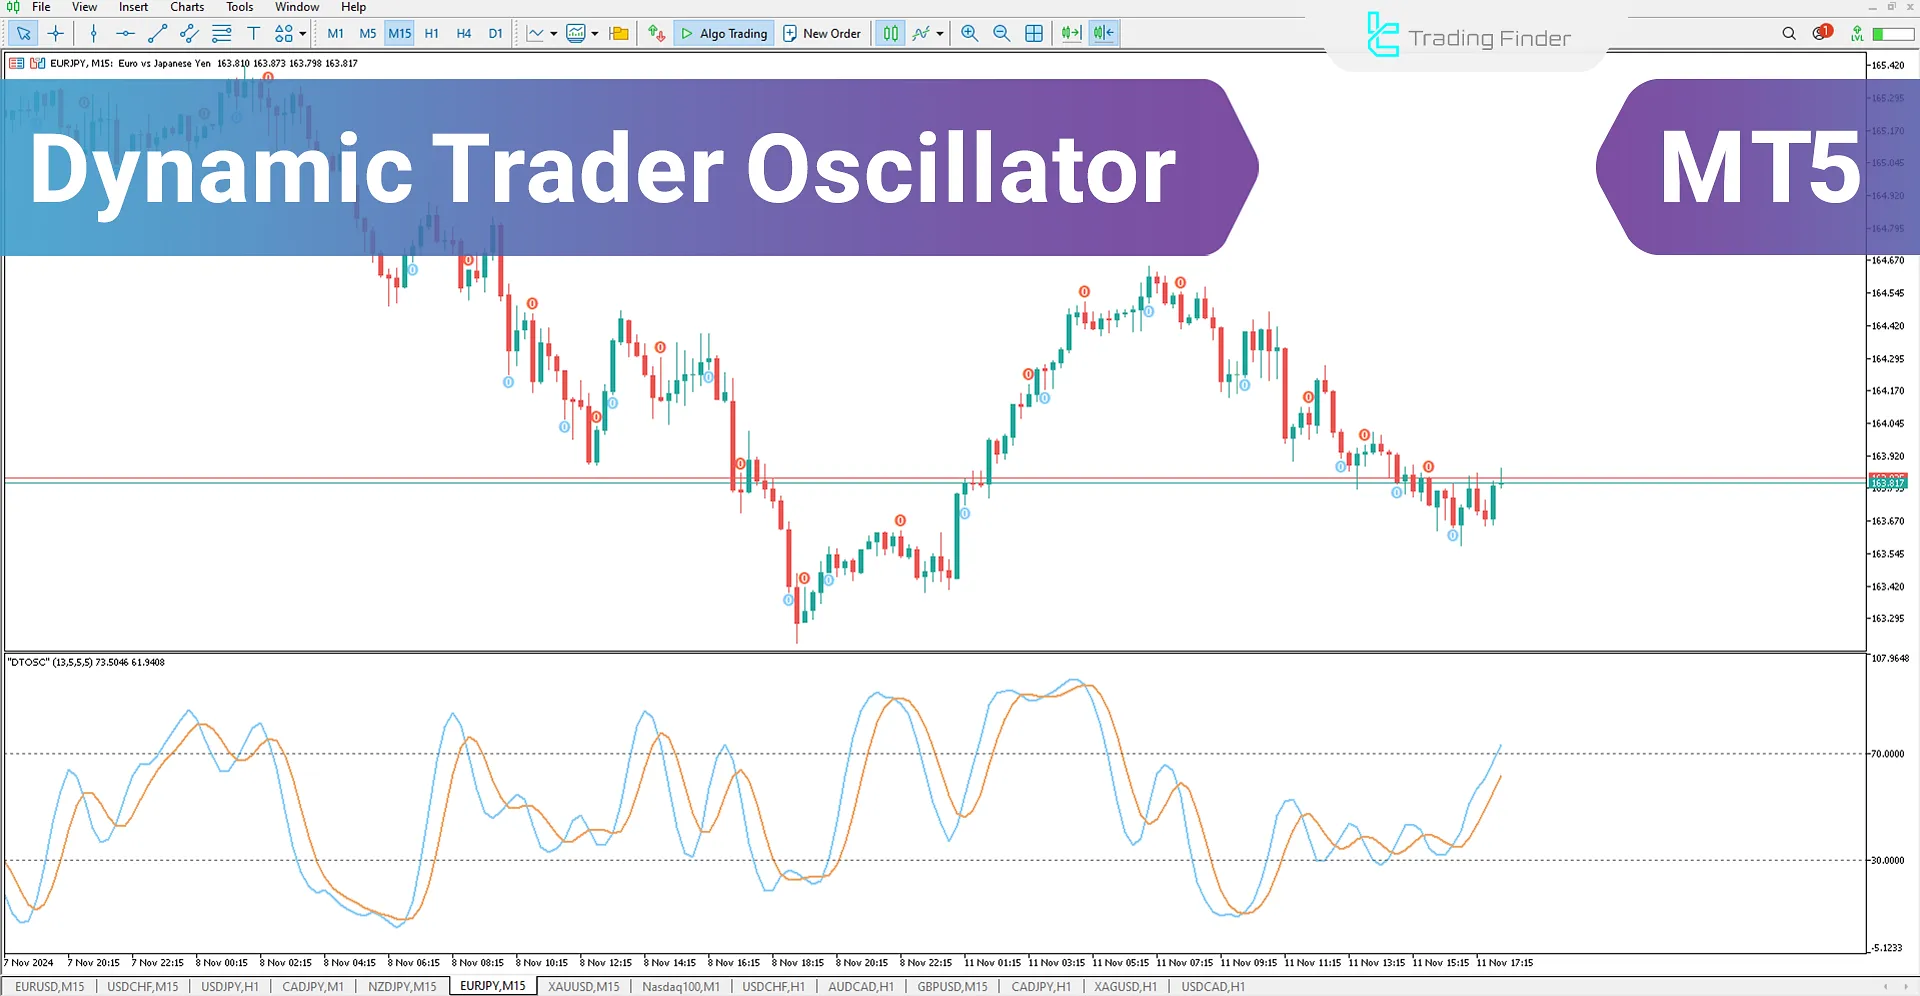


The Dynamic Trader Oscillator is an advanced and developed tool that combines the Stochastic indicator with the RSI, increasing analysis accuracy.
This tool is designed for the MetaTrader 5 (MT5) indicator and, by adding Stochastic to the RSI window, allows traders to analyze overbought and oversold areas more precisely, which can indicate potential price reversals.
When the oscillator line (blue) crosses the signal line (red) upward, a buy signal is issued with a blue marker, and when it crosses downward, a sell signal is displayed with a red marker.
This feature helps traders identify better entry and exit points and provides a more precise price chart analysis.
Oscillator Table
Indicator Categories: | Oscillators MT5 Indicators Signal & Forecast MT5 Indicators Trading Assist MT5 Indicators |
Platforms: | MetaTrader 5 Indicators |
Trading Skills: | Elementary |
Indicator Types: | Lagging MT5 Indicators Leading MT5 Indicators |
Timeframe: | Multi-Timeframe MT5 Indicators |
Trading Style: | Intraday MT5 Indicators Scalper MT5 Indicators Day Trading MT5 Indicators |
Trading Instruments: | Forex MT5 Indicators Crypto MT5 Indicators Indices MT5 Indicators |
Indicator at a Glance
The Dynamic Trader Oscillator is an advanced and refined indicator created by combining the two classic indicators, RSI and Stochastic. By overlaying the Stochastic on the RSI oscillator window, this indicator helps traders perform more precise analyses.
When the oscillator line crosses the Stochastic signal line, the indicator generates buy and sell signals, alerting traders to potential trading opportunities.
Buy Signal and Uptrend

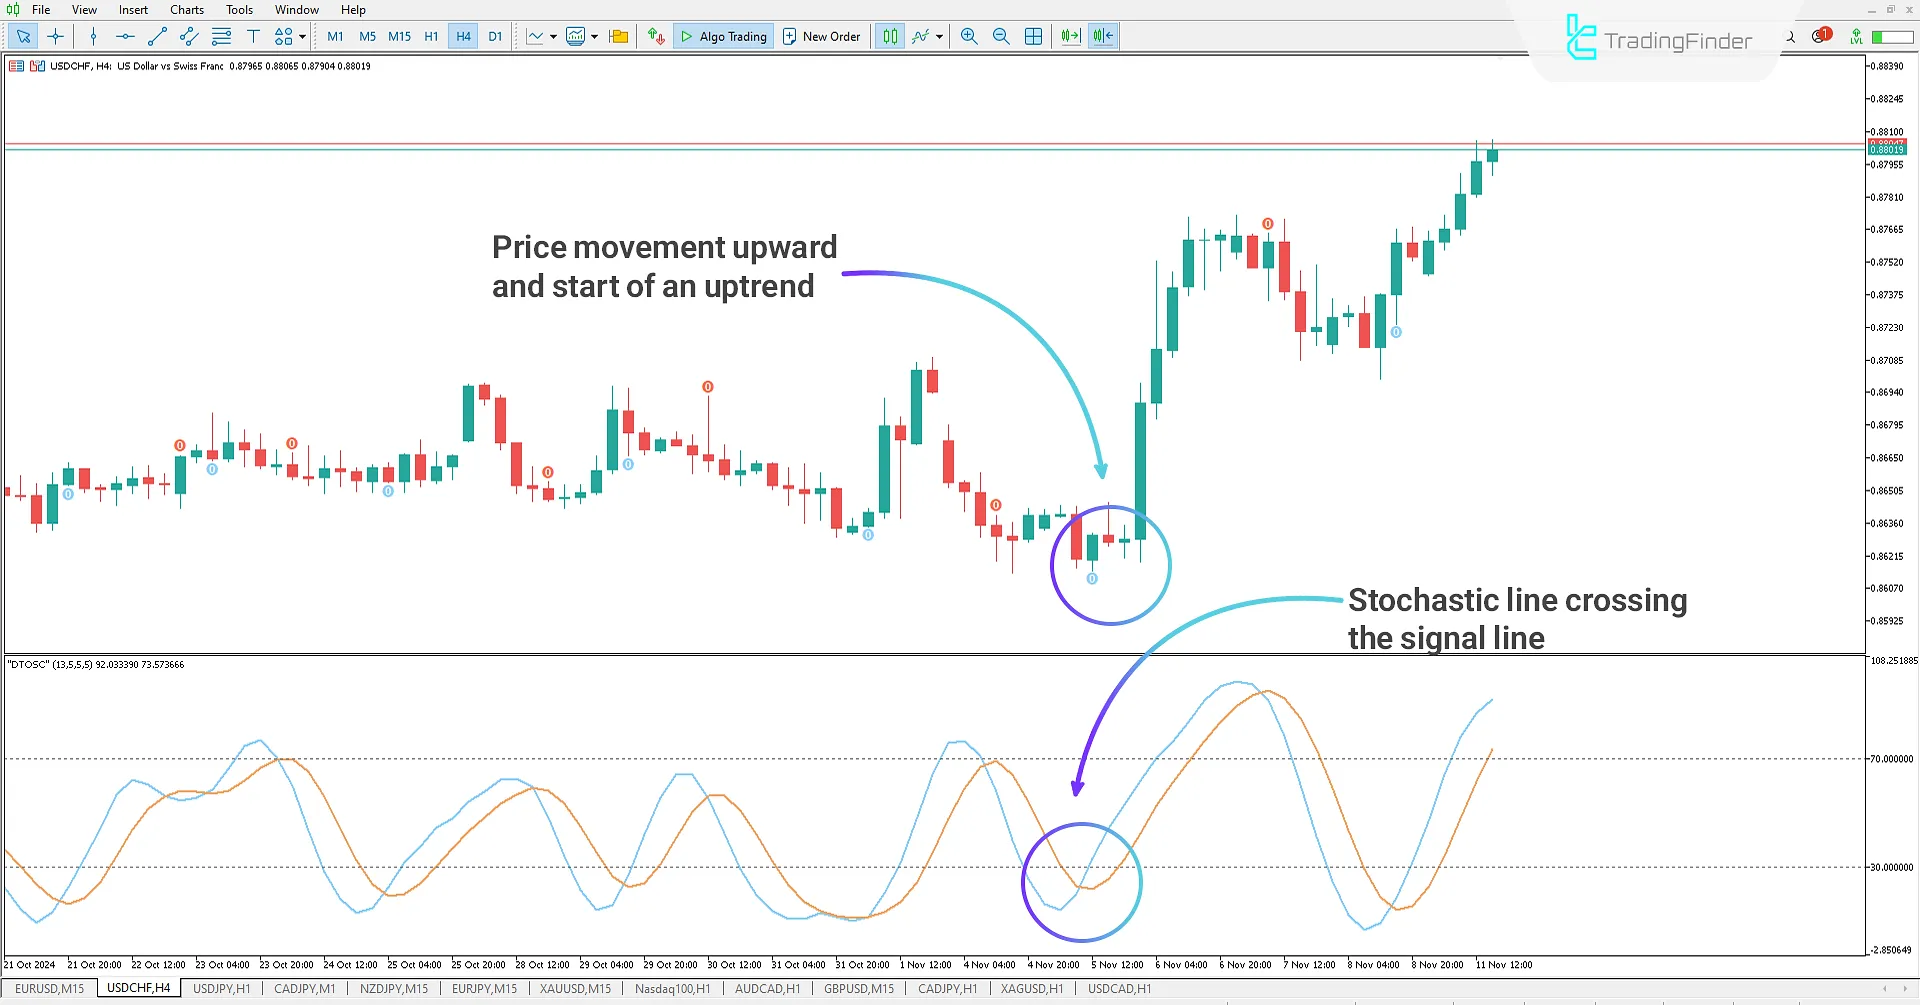
In the 4-hour USD/CHF chart, the Dynamic Trader Oscillator has issued a buy signal. After a price decline and Stochastic entering the oversold area in RSI, a buy signal is issued at the crossing of the oscillator line and signal line.
This crossing in the oversold area indicates a favorable trading position to enter a buy trade. Traders can use this signal to enter a buy position and take advantage of the potential price recovery.
Sell Signal and Downtrend

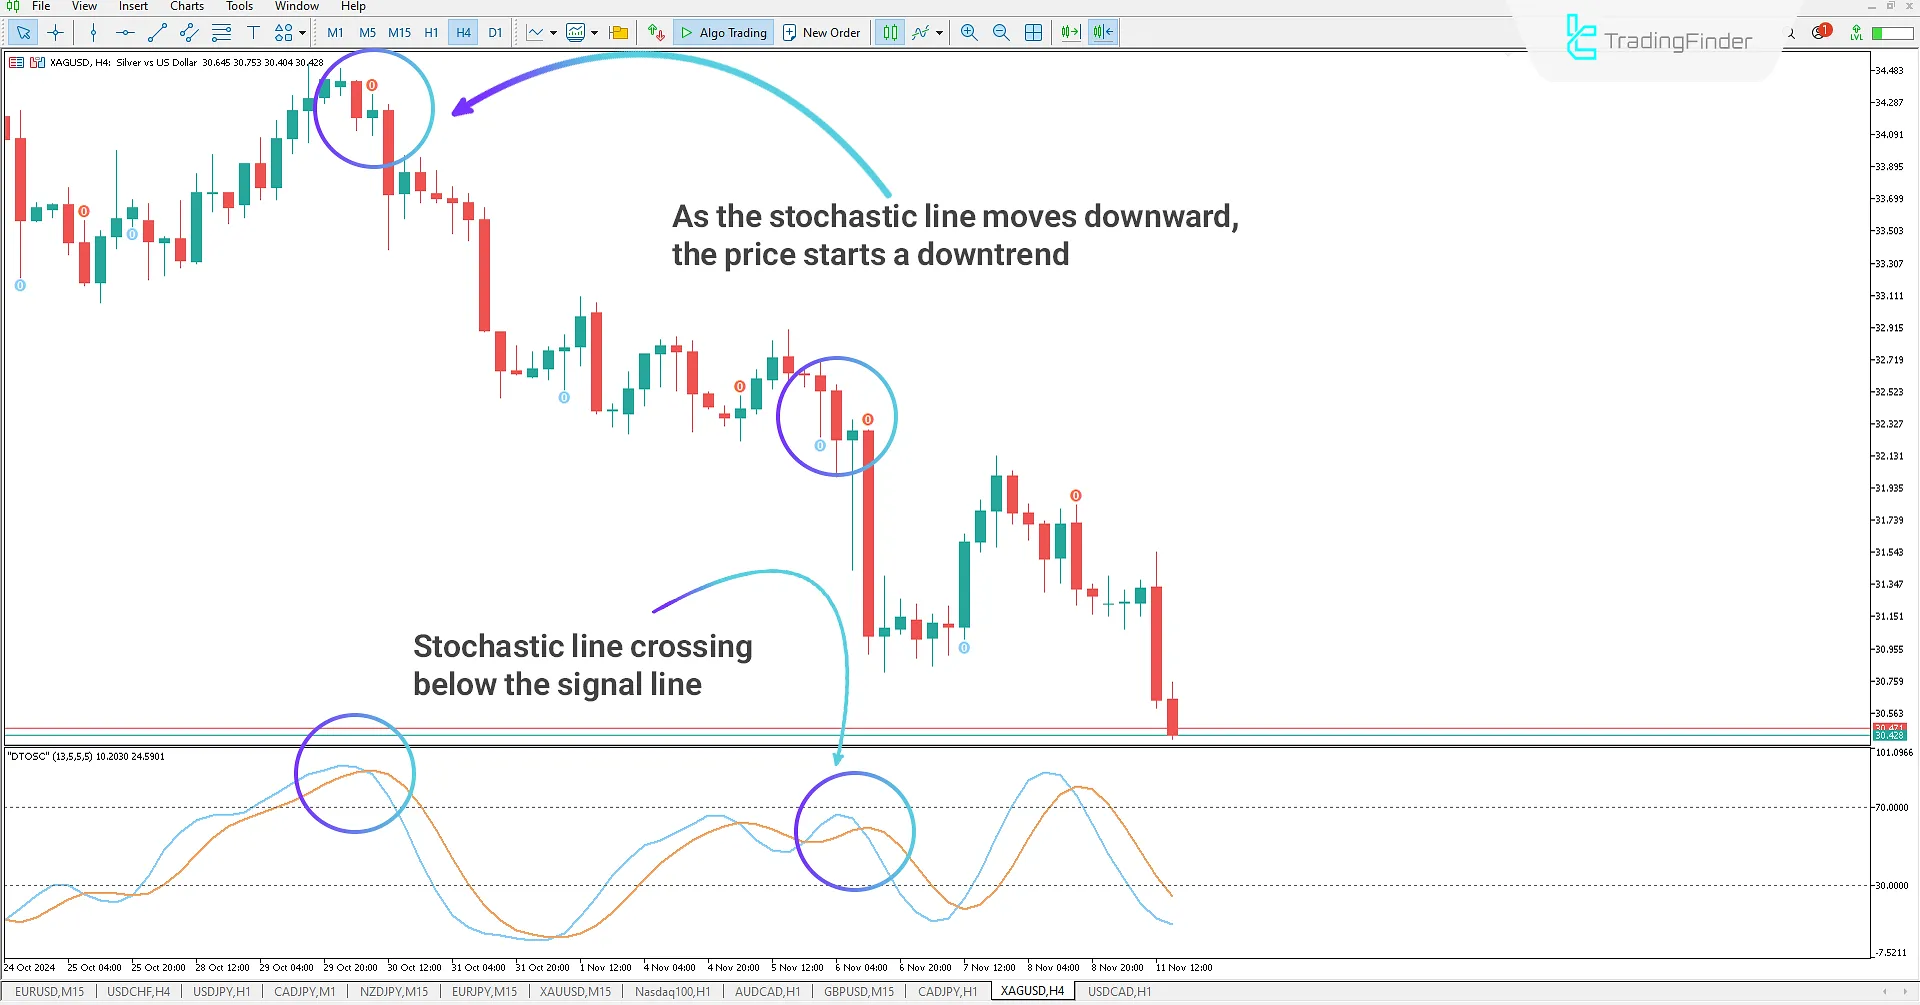
In the 4-hour XAGUSD chart, the Dynamic Trader Oscillator has issued a sell signal. After an upward price movement and Stochastic entering the overbought area in RSI, a sell signal is issued at the crossing of the oscillator line and signal line.
This crossing in the overbought area indicates a favorable trading position to enter a sell trade. Traders can use this signal to enter a sell position and take advantage of the potential price decline.
Dynamic Trader Oscillator Settings

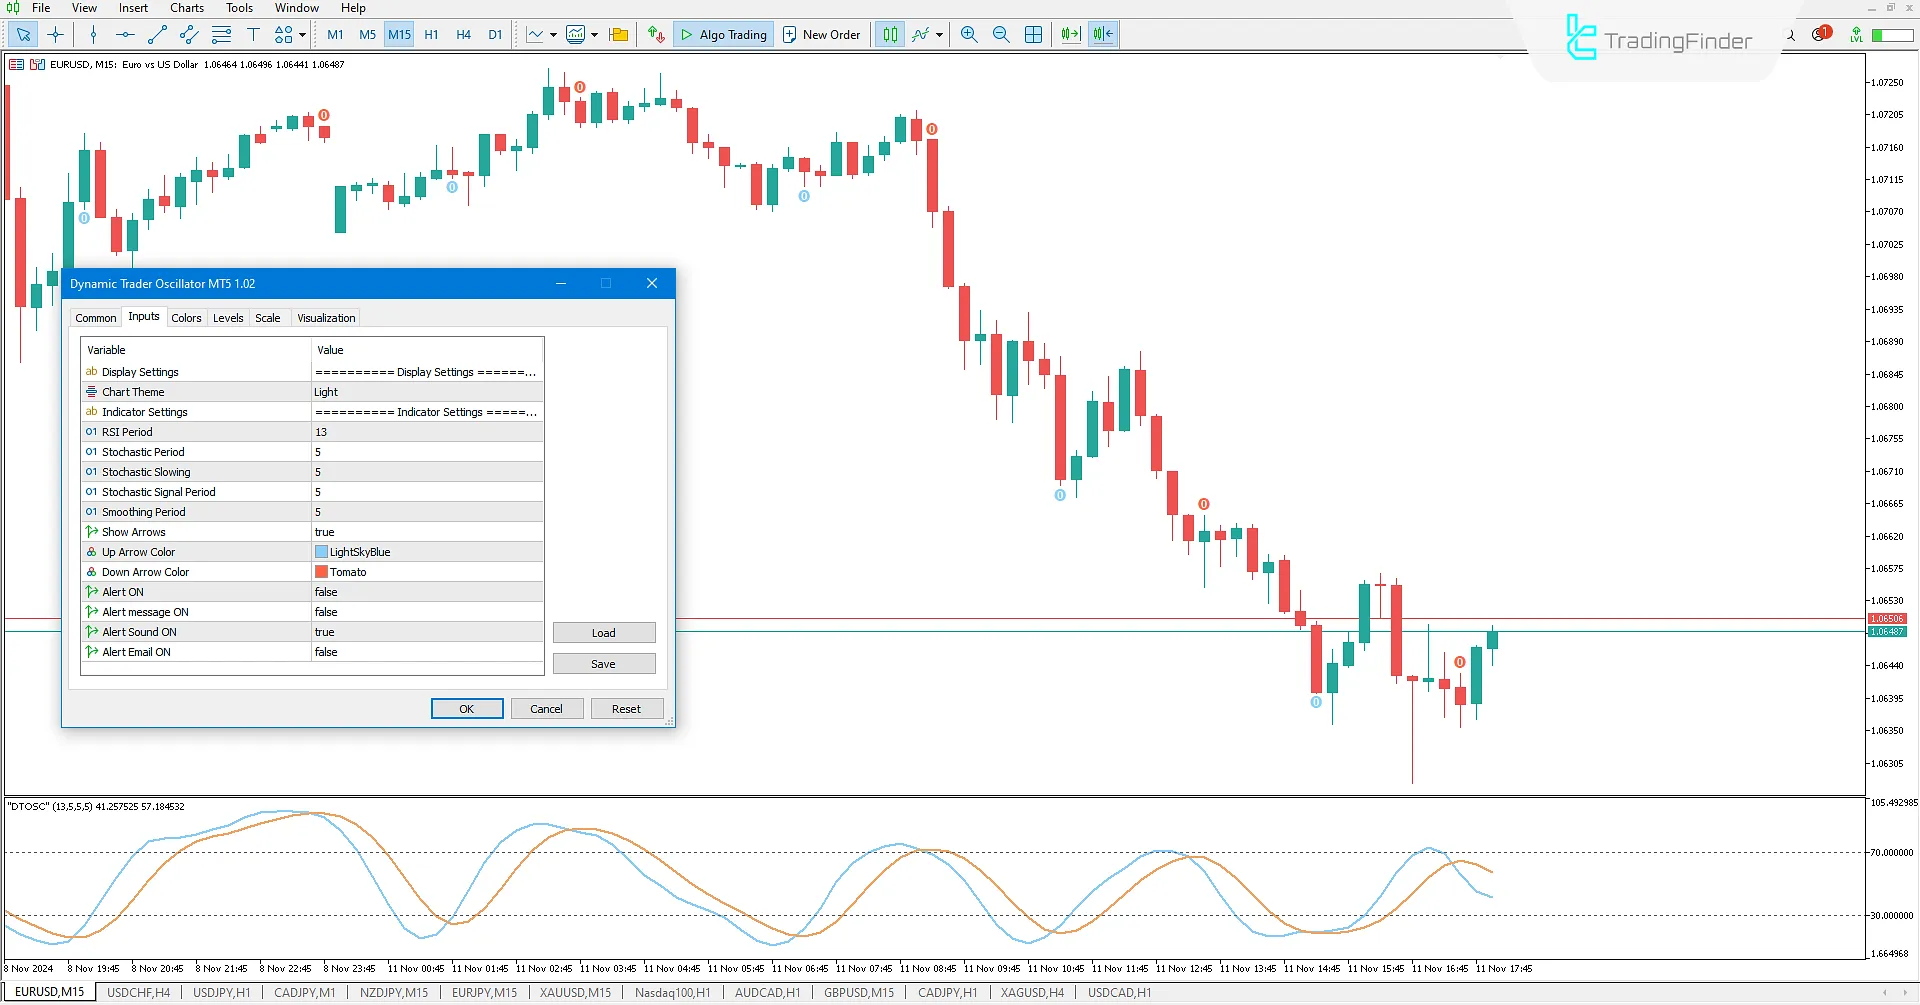
Display_Settings
- Chart Theme: Select a custom theme for the indicator
Indicator Settings
- RSI Period: Set the RSI period;
- Stochastic Period: Set the Stochastic period;
- Stochastic Slowing: Set the Stochastic K period;
- Stochastic Signal Period: Set the Stochastic D period;
- Smoothing Period: Set the smoothed moving average period (affects the algorithm);
- Show Arrows: Toggle arrow display on/off;
- Up Arrow Color: Set the color for upward arrows;
- Down Arrow Color: Set the color for downward arrows;
- Alert ON: Turn indicator alerts on/off;
- Alert message ON: Toggle message alerts on/off;
- Alert Sound ON: Toggle sound alerts on/off;
- Alert Email ON: Toggle email alerts on/off.
Conclusion
The Dynamic Trader Oscillator is a practical tool for traders who prefer indicator-based analyses. This oscillator MT5, built from a combination of the popular RSI and Stochastic indicators, helps traders better understand market trends and potential price reversal points.
Additionally, issuing buy and sell signals when the oscillator line crosses the signal line informs traders of trading positions, assisting them in making entry and exit decisions.
Dynamic Trader Oscillator DTO MT5 PDF
Dynamic Trader Oscillator DTO MT5 PDF
Click to download Dynamic Trader Oscillator DTO MT5 PDFIs this indicator solely for signaling buy and sell opportunities?
The Dynamic Trader Oscillator provides buy and sell signals and helps traders identify optimal entry and exit points, allowing for better trade management.
How does this indicator help identify trend reversal points?
When the Stochastic oscillator enters the overbought or oversold areas of RSI, this is considered a warning of a potential trend reversal.


