![Execute Line Indicator for MT5 Download – Free – [TradingFinder]](https://cdn.tradingfinder.com/image/591089/13-231-en-execute-line-mt5-01.webp)
![Execute Line Indicator for MT5 Download – Free – [TradingFinder] 0](https://cdn.tradingfinder.com/image/591089/13-231-en-execute-line-mt5-01.webp)
![Execute Line Indicator for MT5 Download – Free – [TradingFinder] 1](https://cdn.tradingfinder.com/image/591086/13-231-en-execute-line-mt5-02.webp)
![Execute Line Indicator for MT5 Download – Free – [TradingFinder] 2](https://cdn.tradingfinder.com/image/591085/13-231-en-execute-line-mt5-03.webp)
![Execute Line Indicator for MT5 Download – Free – [TradingFinder] 3](https://cdn.tradingfinder.com/image/591090/13-231-en-execute-line-mt5-04.webp)
The Execute Line Indicator is one of the analytical tools in MetaTrader 5 that uses the Moving Average to display market direction.
Its functionality is based on changes in the slope of the Moving Average, and with simple line color shifts, it indicates whether the trend is bullish or bearish.
Due to the clarity of its signals, this trading tool is suitable for both beginner traders and experienced professionals.
Execute Line Indicator Specification Table
The specifications of the Execute Line Indicator are as follows:
Indicator Categories: | Signal & Forecast MT5 Indicators Trading Assist MT5 Indicators Moving Average MT5 Indicators |
Platforms: | MetaTrader 5 Indicators |
Trading Skills: | Elementary |
Indicator Types: | Reversal MT5 Indicators |
Timeframe: | Multi-Timeframe MT5 Indicators |
Trading Style: | Swing Trading MT5 Indicators Scalper MT5 Indicators Day Trading MT5 Indicators |
Trading Instruments: | Forex MT5 Indicators Crypto MT5 Indicators Stock MT5 Indicators |
Execute Line Indicator at a Glance
The Execute Line Indicator operates using a Moving Average line and changes its color according to market conditions.
A color shift to yellow indicates an upward movement, while a change to purple signals the beginning of a bearish market trend.
Buy Position
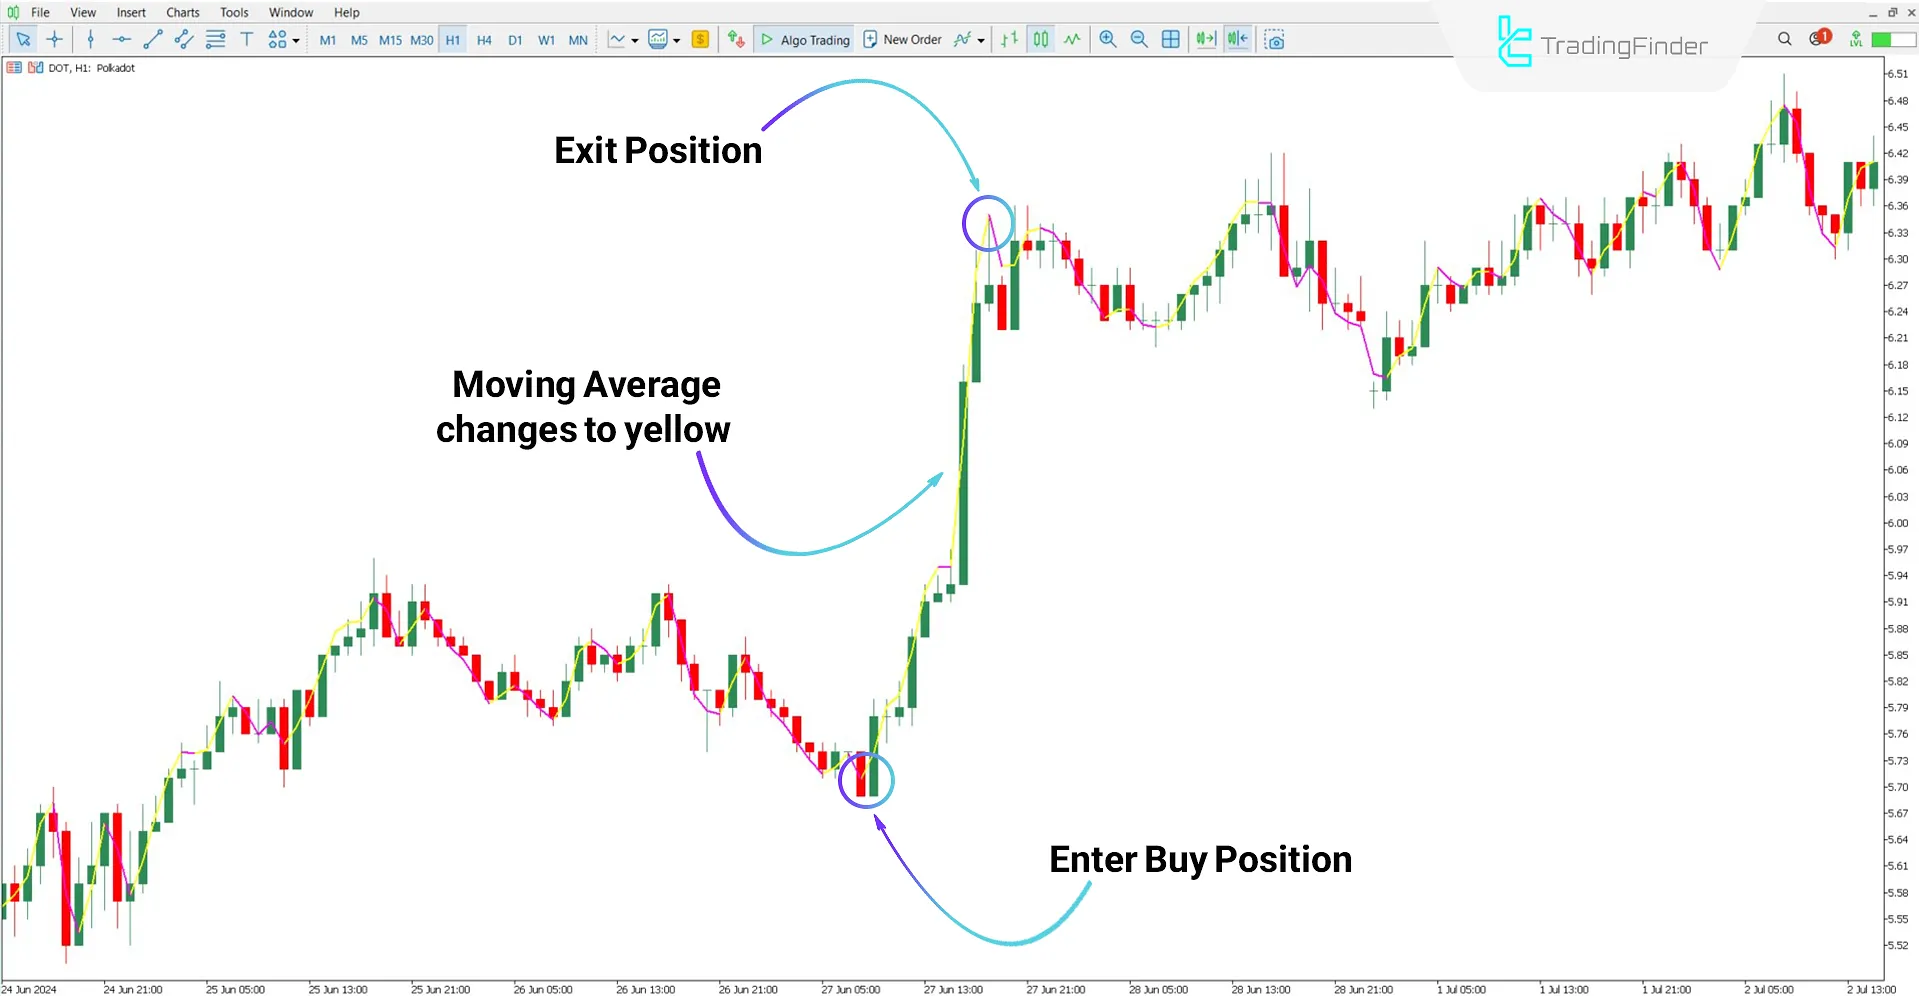
According to the Polkadot (DOT) cryptocurrency chart on the 1-hour timeframe, a signal for the start of a bullish trend is triggered when the "MA" line changes to yellow.
Based on this, traders can enter a buy trade once this color shift occurs and exit their position when the line returns to its previous color.

Sell Position
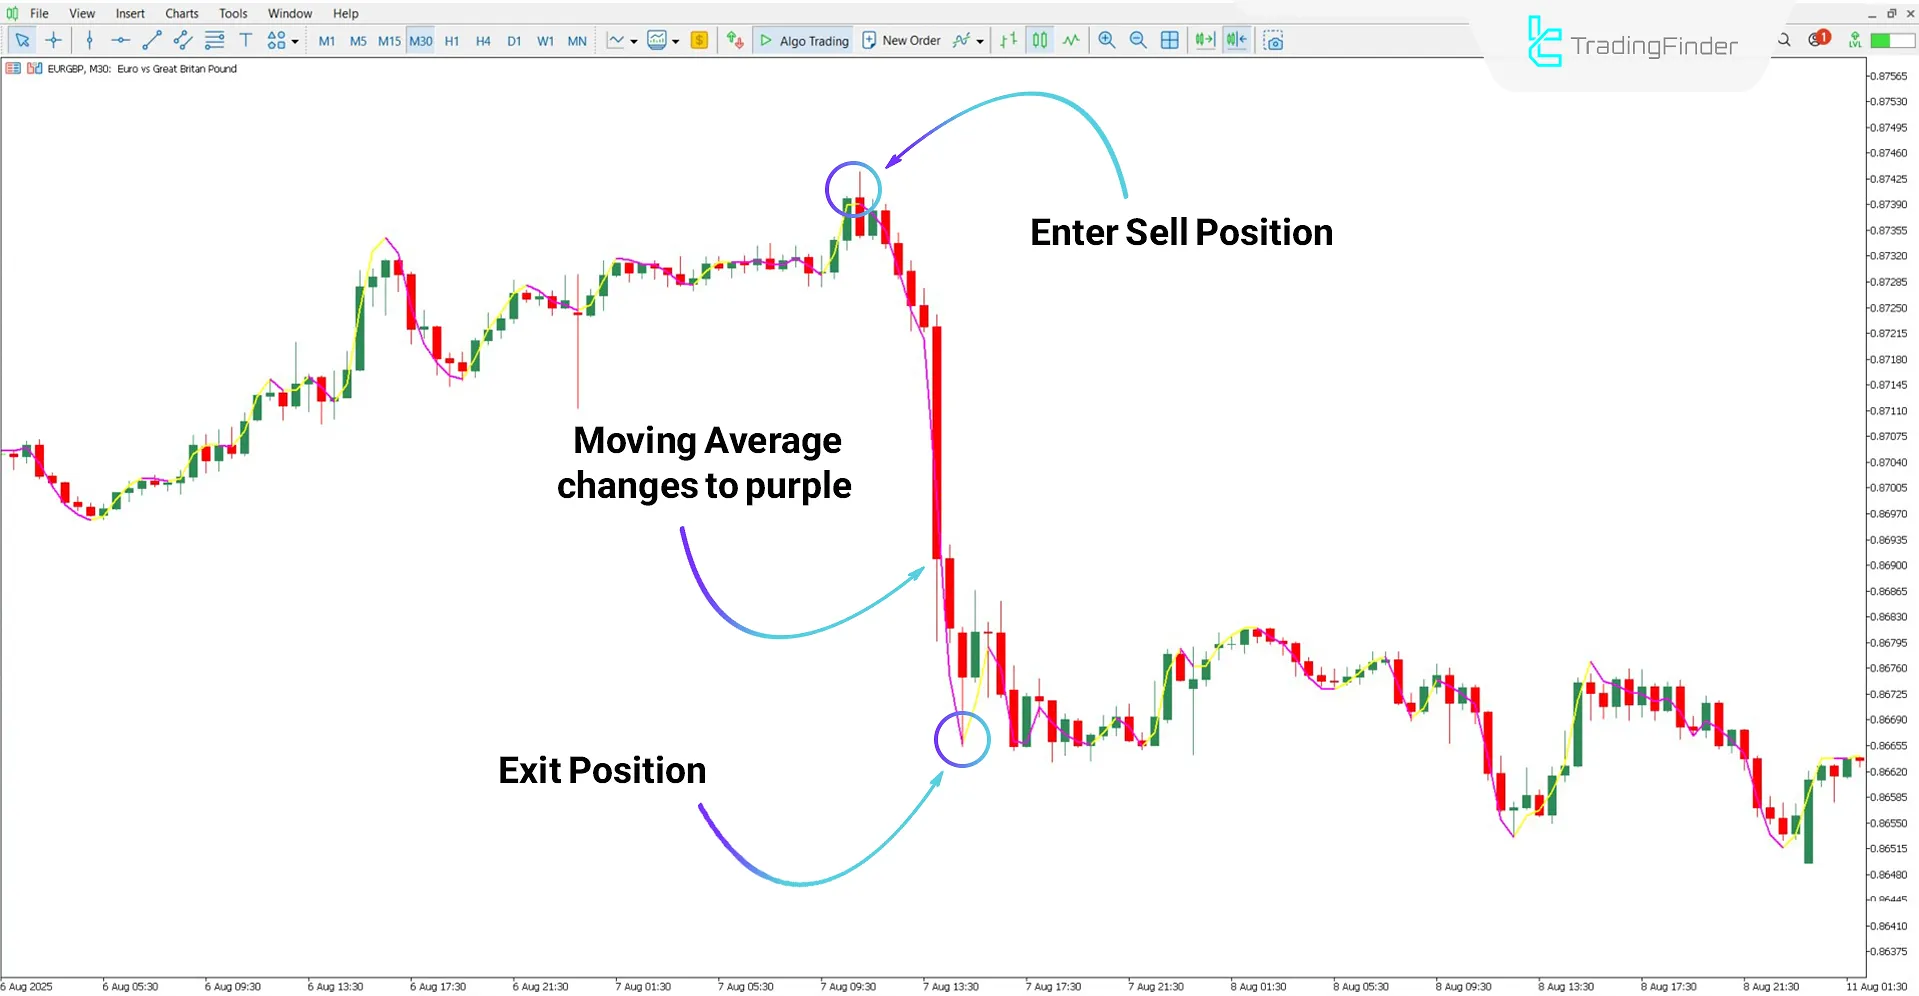
According to the EUR/GBP chart on the 30-minute timeframe, a change of the Moving Average line to purple is a sign of the beginning of a bearish trend.
In such a scenario, a trader can enter a sell position at the first color shift and close the trade once the line changes back.

Execute Line Indicator Settings
The settings of the Execute Line Indicator are as follows:

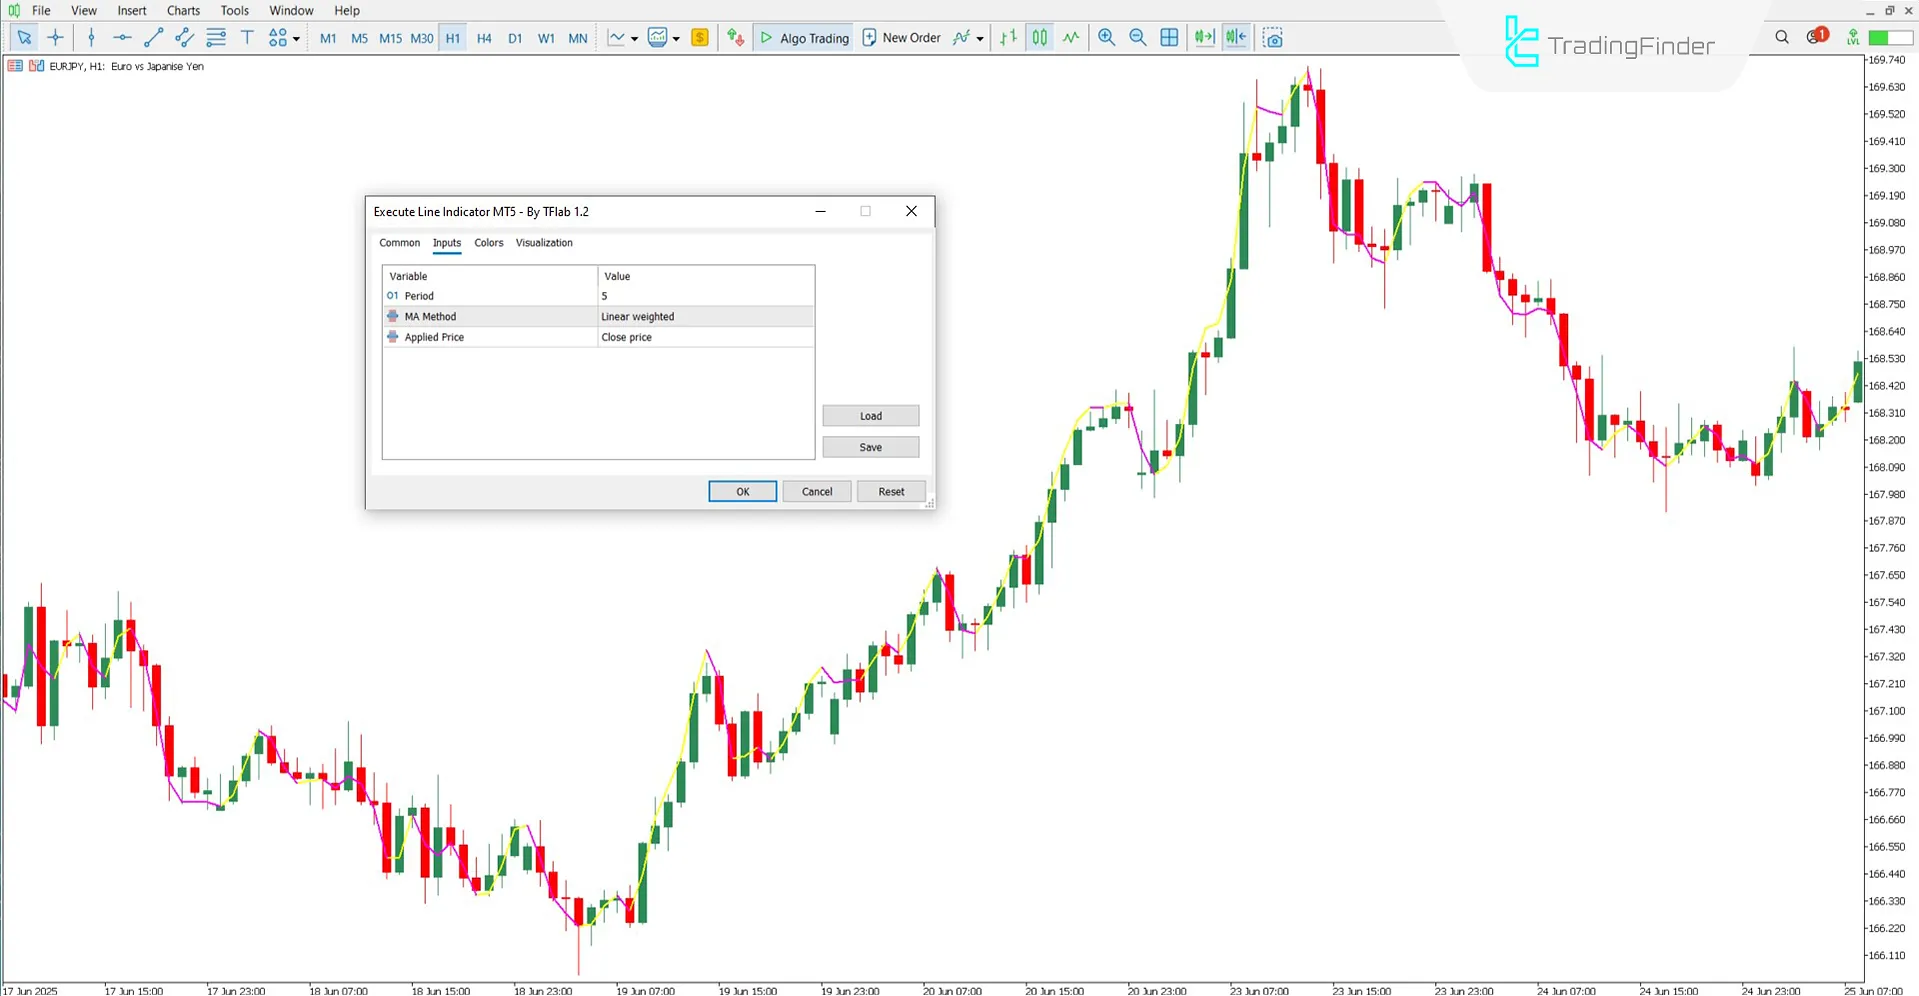
- Period: Calculation period of the Moving Average
- MA Method: Type of Moving Average calculation
- Applied Price: Reference price type for calculations
Conclusion
The Execute Line Indicator is one of the useful tools in technical analysis that determines the general market direction by examining the slope of the Moving Average.
Buy and sell signals in this indicator are generated based on the color change of the Moving Average line. When the line turns yellow, it represents the start of a bullish trend, while a change to purple indicates the market’s entry into a bearish phase.
Execute Line Indicator for MT5 PDF
Execute Line Indicator for MT5 PDF
Click to download Execute Line Indicator for MT5 PDFCan this indicator be used in the stock market?
Yes, the Execute Line Indicator can be applied across all markets.
What is the difference between this tool and a regular Moving Average?
Unlike a standard Moving Average, the Execute Line Indicator shows slope changes through color shifts.


