![Fibonacci Progression with Breaks Indicator MT5 Download – Free – [TFlab]](https://cdn.tradingfinder.com/image/474538/13-176-en-fibonacci-progression-with-breaks-mt5-01.webp)
![Fibonacci Progression with Breaks Indicator MT5 Download – Free – [TFlab] 0](https://cdn.tradingfinder.com/image/474538/13-176-en-fibonacci-progression-with-breaks-mt5-01.webp)
![Fibonacci Progression with Breaks Indicator MT5 Download – Free – [TFlab] 1](https://cdn.tradingfinder.com/image/474515/13-176-en-fibonacci-progression-with-breaks-mt5-02.webp)
![Fibonacci Progression with Breaks Indicator MT5 Download – Free – [TFlab] 2](https://cdn.tradingfinder.com/image/474526/13-176-en-fibonacci-progression-with-breaks-mt5-03.webp)
![Fibonacci Progression with Breaks Indicator MT5 Download – Free – [TFlab] 3](https://cdn.tradingfinder.com/image/474536/13-176-en-fibonacci-progression-with-breaks-mt5-04.webp)
The Fibonacci Progression with Breaks Indicator is built on the Fibonacci number sequence and analyzes market behavior through a structured, phase-based approach.
This tool starts from a key point (pivot) and plots various price levels based on Fibonacci ratios, aligned with the trend.
Additionally, it uses colored arrows (green for buy, red for sell) to provide trade entry signals.
Fibonacci Progression with Breaks Indicator Specifications Table
The following table outlines the specifications of the Fibonacci Levels Progression with Breaks Indicator.
Indicator Categories: | Signal & Forecast MT5 Indicators Trading Assist MT5 Indicators Levels MT5 Indicators |
Platforms: | MetaTrader 5 Indicators |
Trading Skills: | Elementary |
Indicator Types: | Breakout MT5 Indicators Reversal MT5 Indicators |
Timeframe: | Multi-Timeframe MT5 Indicators |
Trading Style: | Swing Trading MT5 Indicators Scalper MT5 Indicators Day Trading MT5 Indicators |
Trading Instruments: | Forex MT5 Indicators Crypto MT5 Indicators Stock MT5 Indicators |
At a Glance: Fibonacci Progression with Breaks Indicator
Each time the price crosses one of the defined levels, a new analysis phase begins. As long as no structural change (break in the trend) occurs, new levels will not be plotted.
Thus, based on structure breakouts and subsequent levels, the indicator highlights potential trade entry points using green (buy) and red (sell) arrows.
Buy Signal
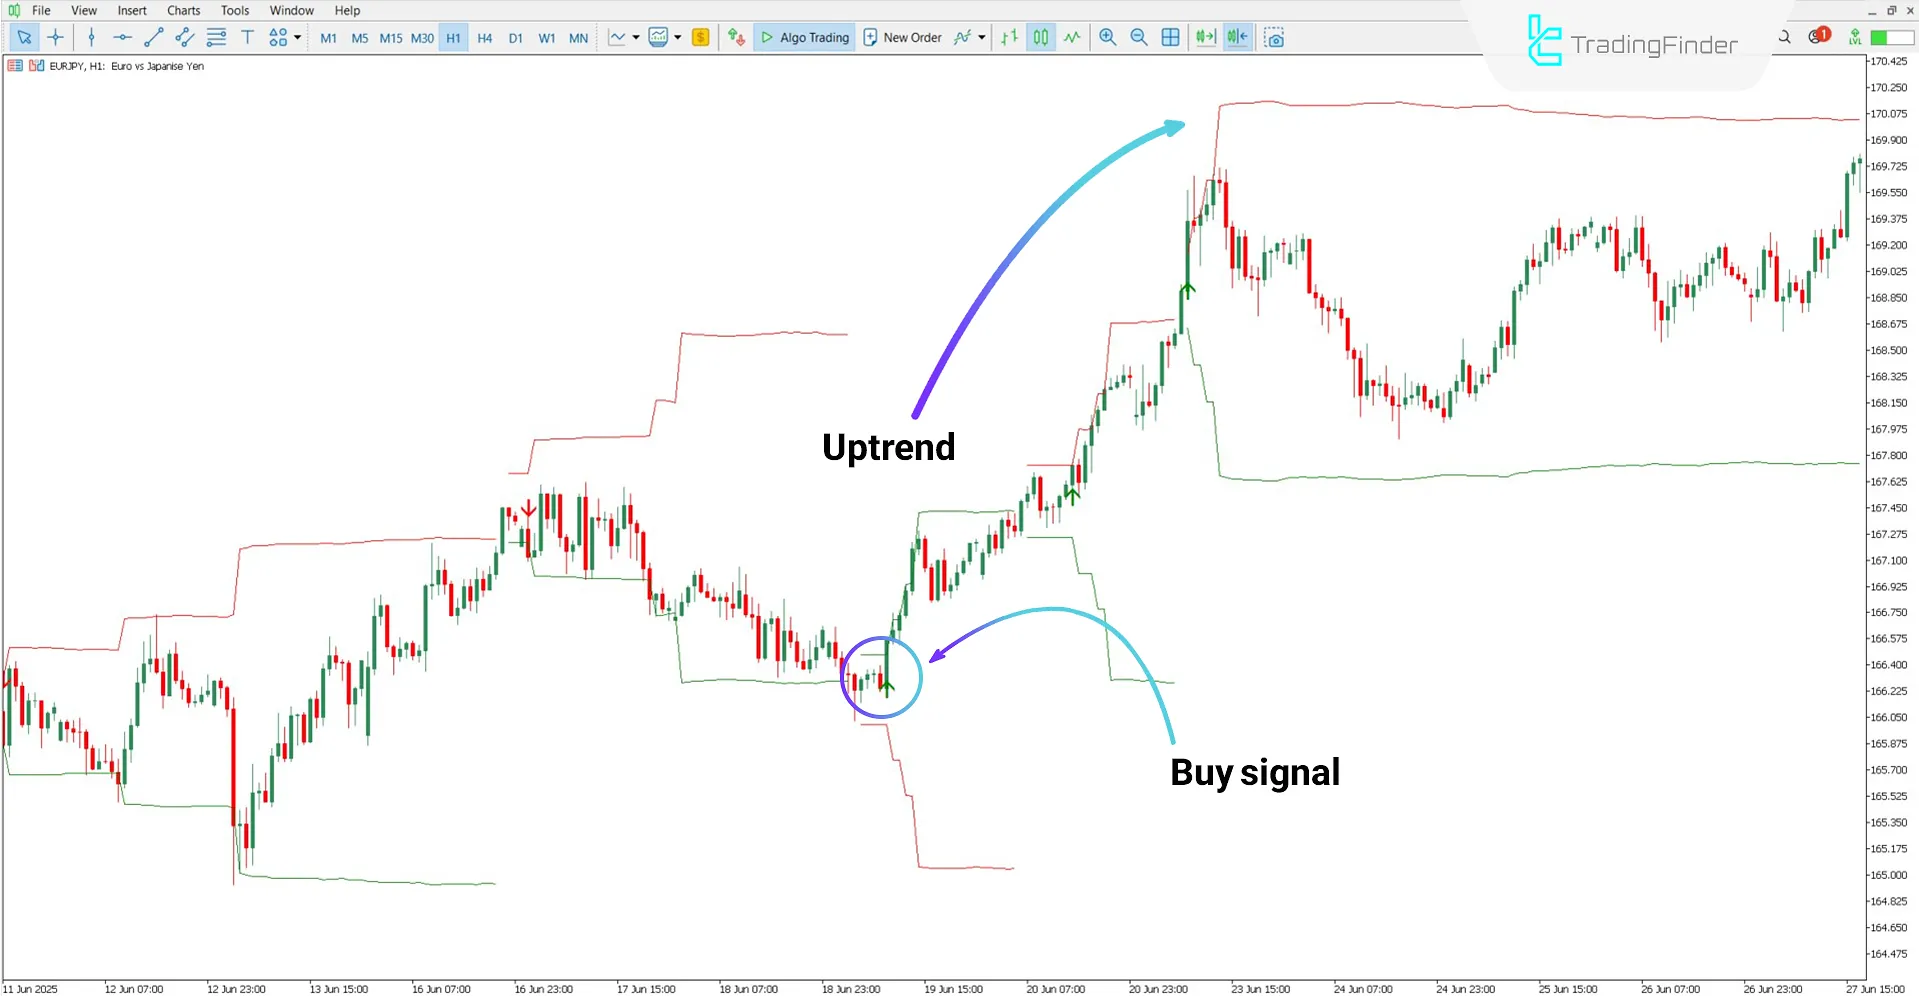
According to the EUR/JPY pair chart, the Fibonacci Progression Process Indicator with Breaks issued a buy signal when the price broke above one of the Fibonacci levels.
In such conditions, the buy trade may be held until the red arrow appears (indicating a possible trend reversal).

Sell Signal
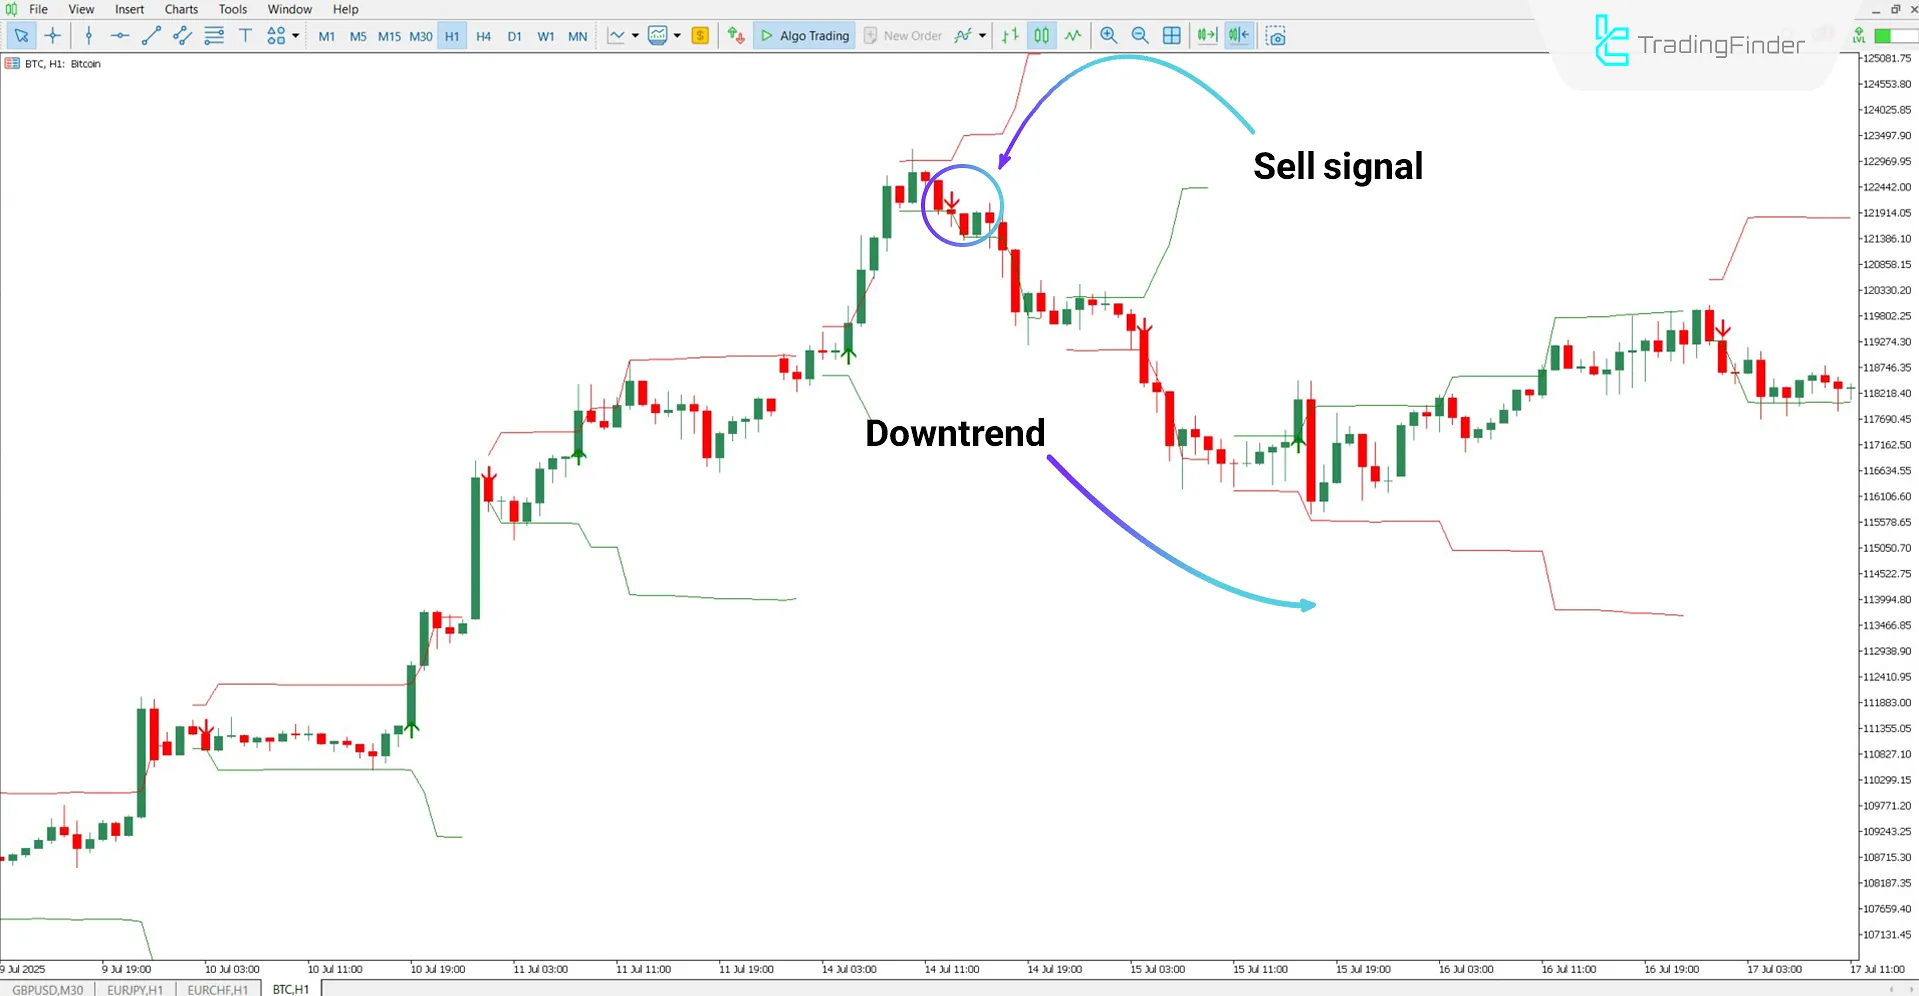
Based on the hourly chart analysis of the cryptocurrency Bitcoin (BTC), the price first entered the upper Fibonacci structure zone and then broke the support with a bearish candle.
The indicator recognized this breakdown and issued a sell signal accordingly.

Fibonacci Progression with Breaks Indicator Settings
The configuration options for the Fibonacci Progression with Breaks Indicator are as follows:

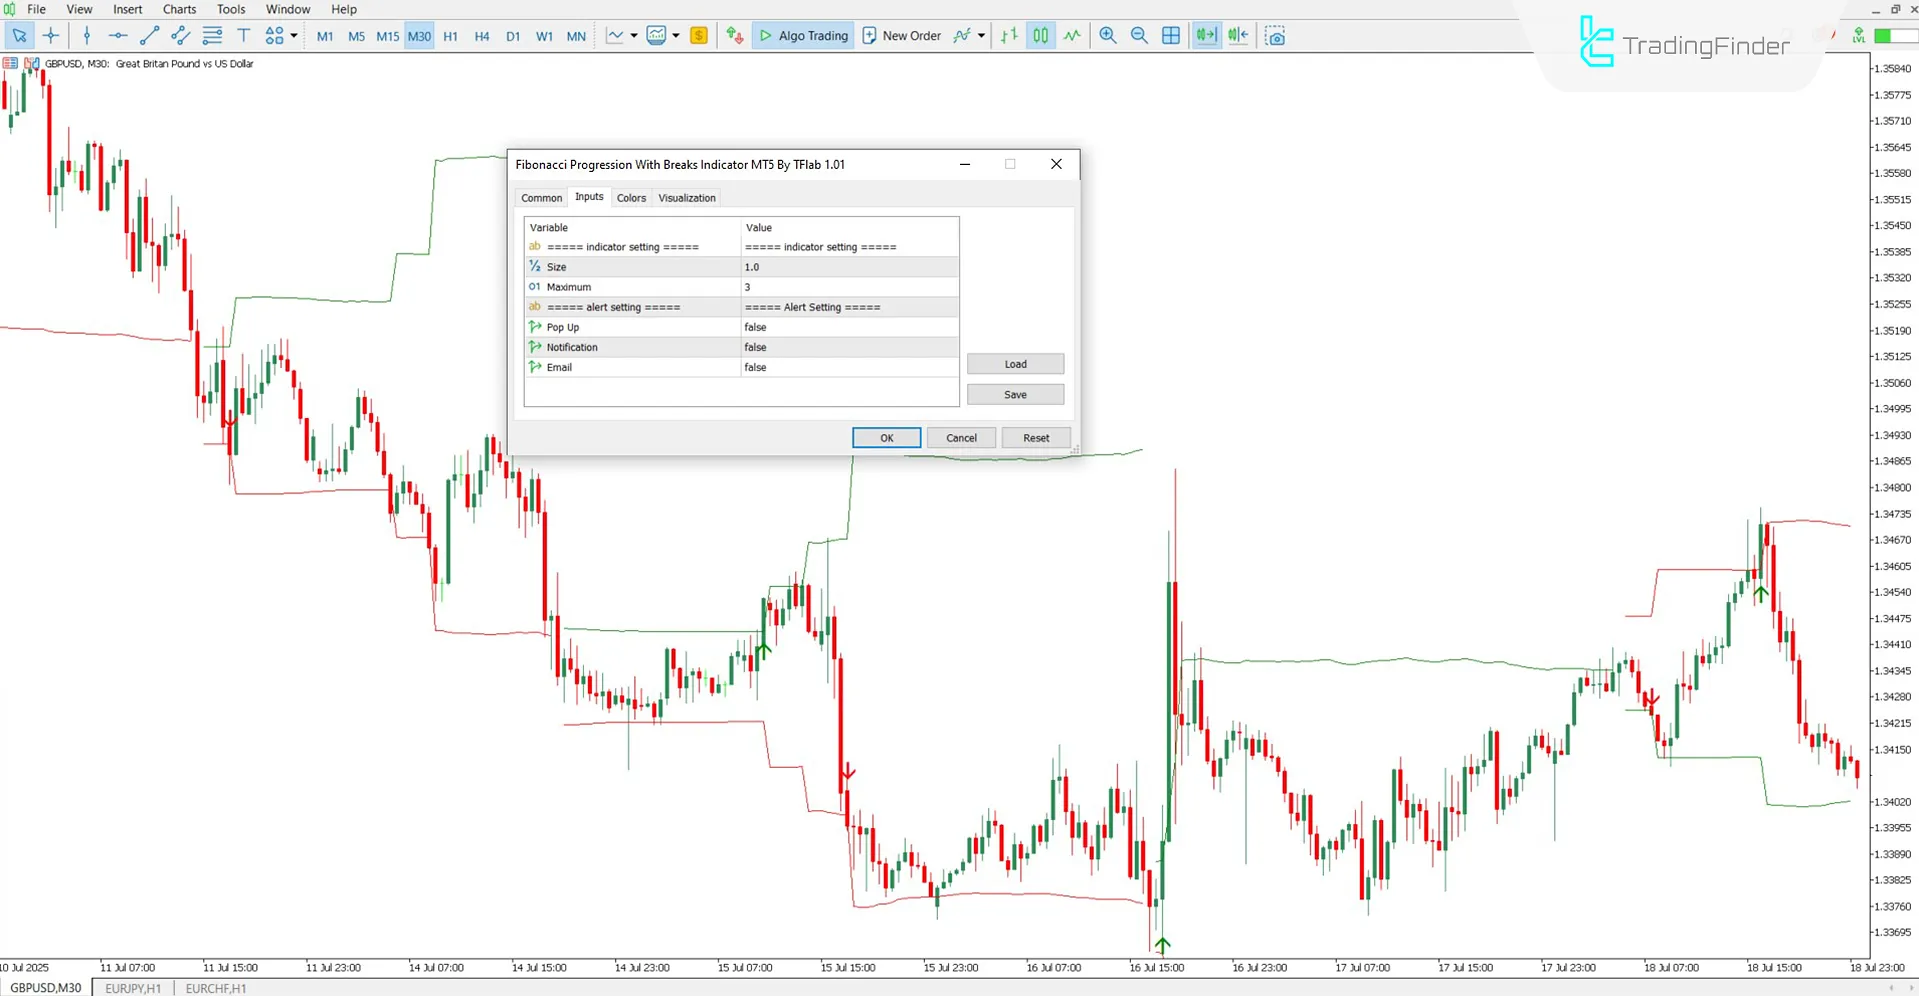
- Size: Zoom level of the drawn Fibonacci levels
- Maximum: Maximum number of Fibonacci levels
- PopUp: Enable/disable visual alert popup
- Notification: Enable/disable internal notification
- Email: Enable signal delivery to email
Conclusion
The Fibonacci Levels Progression with Breaks Indicator is a technical analysis tool used to track price movements based on Fibonacci sequences and structural breakouts.
This trading tool helps traders make better decisions by plotting potential retracement zones and trend continuation paths.
In specific situations, it issues buy and sell signals using colored arrows displayed on the chart.
Fibonacci Progression With Breaks MT5 PDF
Fibonacci Progression With Breaks MT5 PDF
Click to download Fibonacci Progression With Breaks MT5 PDFWhen does this indicator issue a buy signal?
When the price breaks upward through a Fibonacci level, the indicator detects a valid breakout condition.
What do the green and red arrows mean?
In the Fibonacci Progression with Breaks Indicator, a green arrow indicates a buy signal and a red arrow indicates a sell signal.


