![Fibonacci Retracement Assistant Indicator for MT5 Download - Free - [TFlab]](https://cdn.tradingfinder.com/image/105305/10-10-en-fibonacci-retracement-mt5.webp)
![Fibonacci Retracement Assistant Indicator for MT5 Download - Free - [TFlab] 0](https://cdn.tradingfinder.com/image/105305/10-10-en-fibonacci-retracement-mt5.webp)
![Fibonacci Retracement Assistant Indicator for MT5 Download - Free - [TFlab] 1](https://cdn.tradingfinder.com/image/31177/10-10-en-fibo-ret-assistant-mt5-02.avif)
![Fibonacci Retracement Assistant Indicator for MT5 Download - Free - [TFlab] 2](https://cdn.tradingfinder.com/image/31180/10-10-en-fibo-ret-assistant-mt5-03.avif)
![Fibonacci Retracement Assistant Indicator for MT5 Download - Free - [TFlab] 3](https://cdn.tradingfinder.com/image/31184/10-10-en-fibo-ret-assistant-mt5-04.avif)
The Fibonacci Retracement Assistant Indicator is a widely used tool in Meta Trader 5 indicator. Fibonacci tools are extensively utilized in Technical Analysis to identify critical price reversal levels and assist traders in decision-making.
Fibonacci ratios on the price chart can act as a reversal, support, and static resistance level drawn by selecting two points from a specific market movement.
The indicator plots crucial Fibonacci retracement ratios (23.2%, 50%, 61.8%, 78.6%, 88.4%, 100%) between these two points, each of which can act as support or resistance.
Indicator Table
Indicator Categories: | Trading Assist MT5 Indicators Chart & Classic MT5 Indicators Levels MT5 Indicators Fibonacci MT5 Indicators |
Platforms: | MetaTrader 5 Indicators |
Trading Skills: | Intermediate |
Indicator Types: | Entry & Exit MT5 Indicators Reversal MT5 Indicators |
Timeframe: | Multi-Timeframe MT5 Indicators |
Trading Style: | Swing Trading MT5 Indicators Scalper MT5 Indicators Day Trading MT5 Indicators Fast Scalper MT5 Indicators |
Trading Instruments: | Forex MT5 Indicators Crypto MT5 Indicators Stock MT5 Indicators Commodity MT5 Indicators Indices MT5 Indicators Share Stock MT5 Indicators |
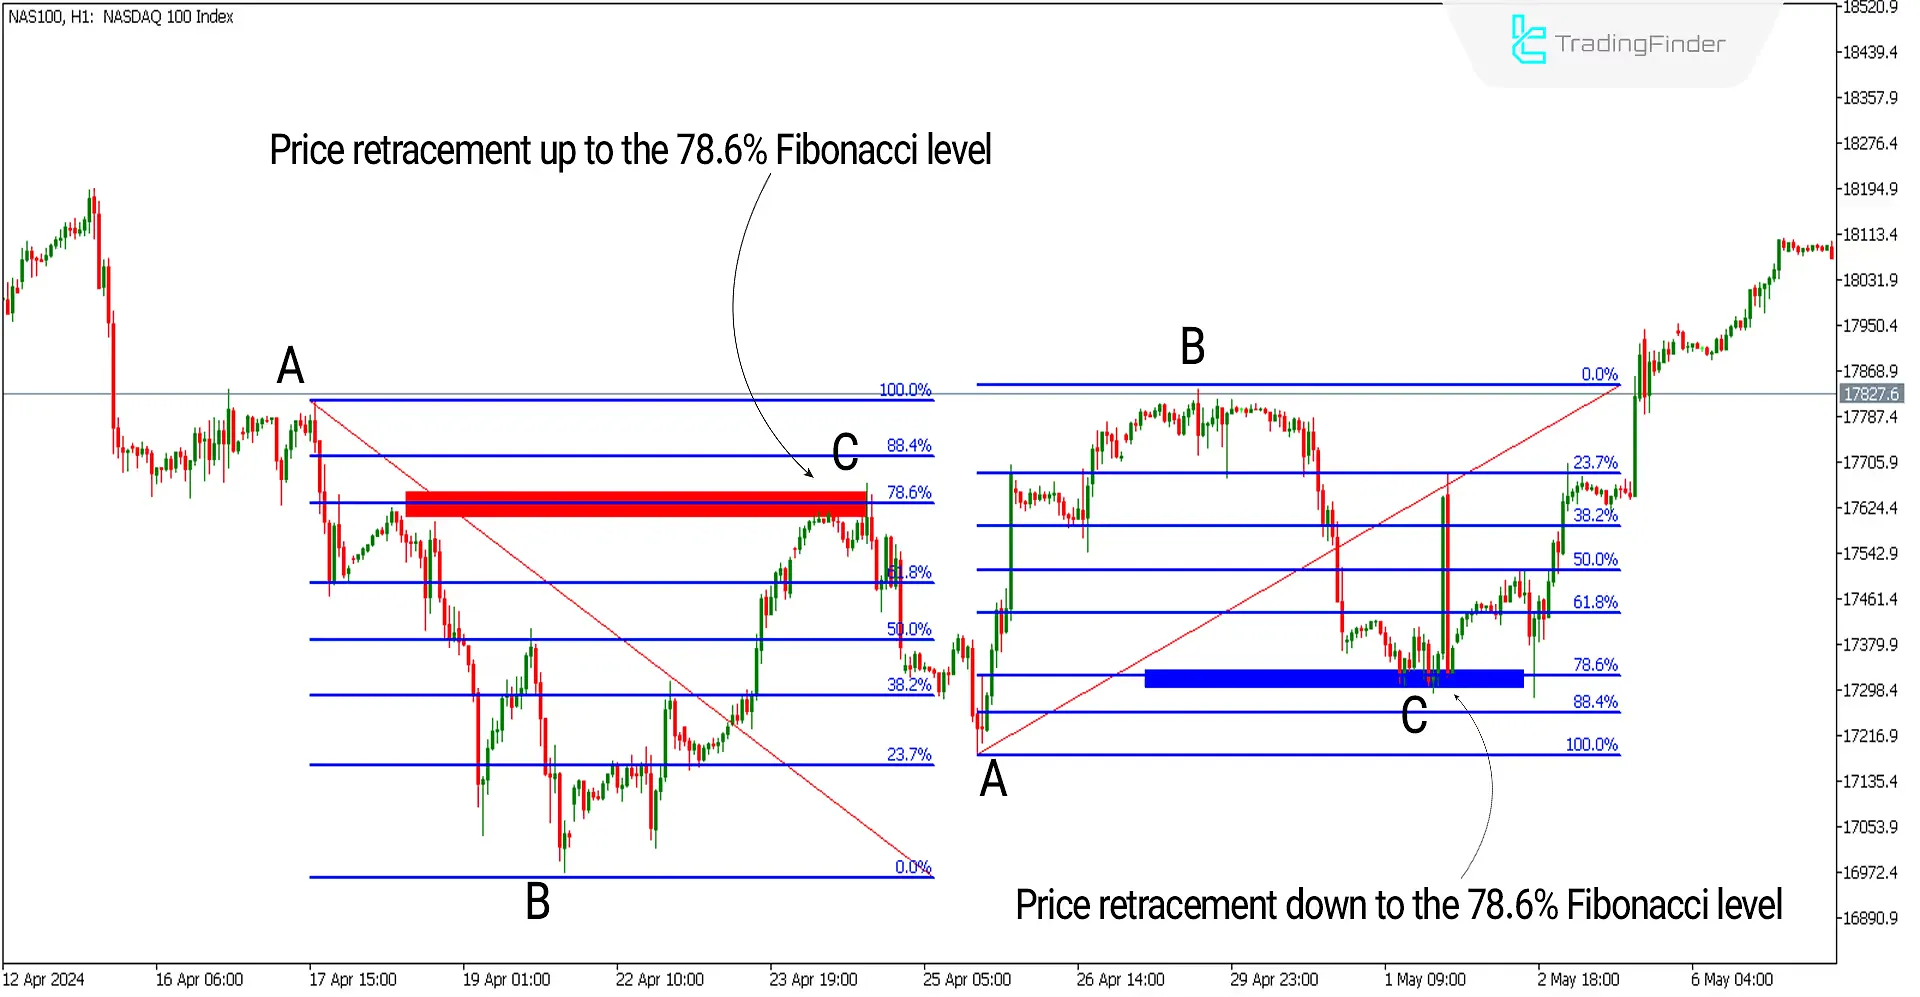
The image below shows a chart of the NASDAQ 100 index [NAS100] in a 1-hour timeframe. On the left side of the image, a downward movement (AB) has occurred, and its correction (BC) has reached the 78.6% Fibonacci level, showing a bearish reaction; hence, the Fibonacci retracement level has acted as resistance.
On the right side of the image (AB), there is an upward movement where its correction (BC) has reached 78.6% and has shown a bullish reaction. Thus, the Fibonacci level here has acted as support.

Overview
In various analytical styles and strategies where entry points primarily exist in price retracements or pullbacks, the Fibonacci retracement tool is essential.
This tool helps to identify potential price reversal points and can be combined with other tools, such as price channels and level conversions, to secure a more reliable entry point in trades.
Bullish Fibonacci Conditions (Buy Position)
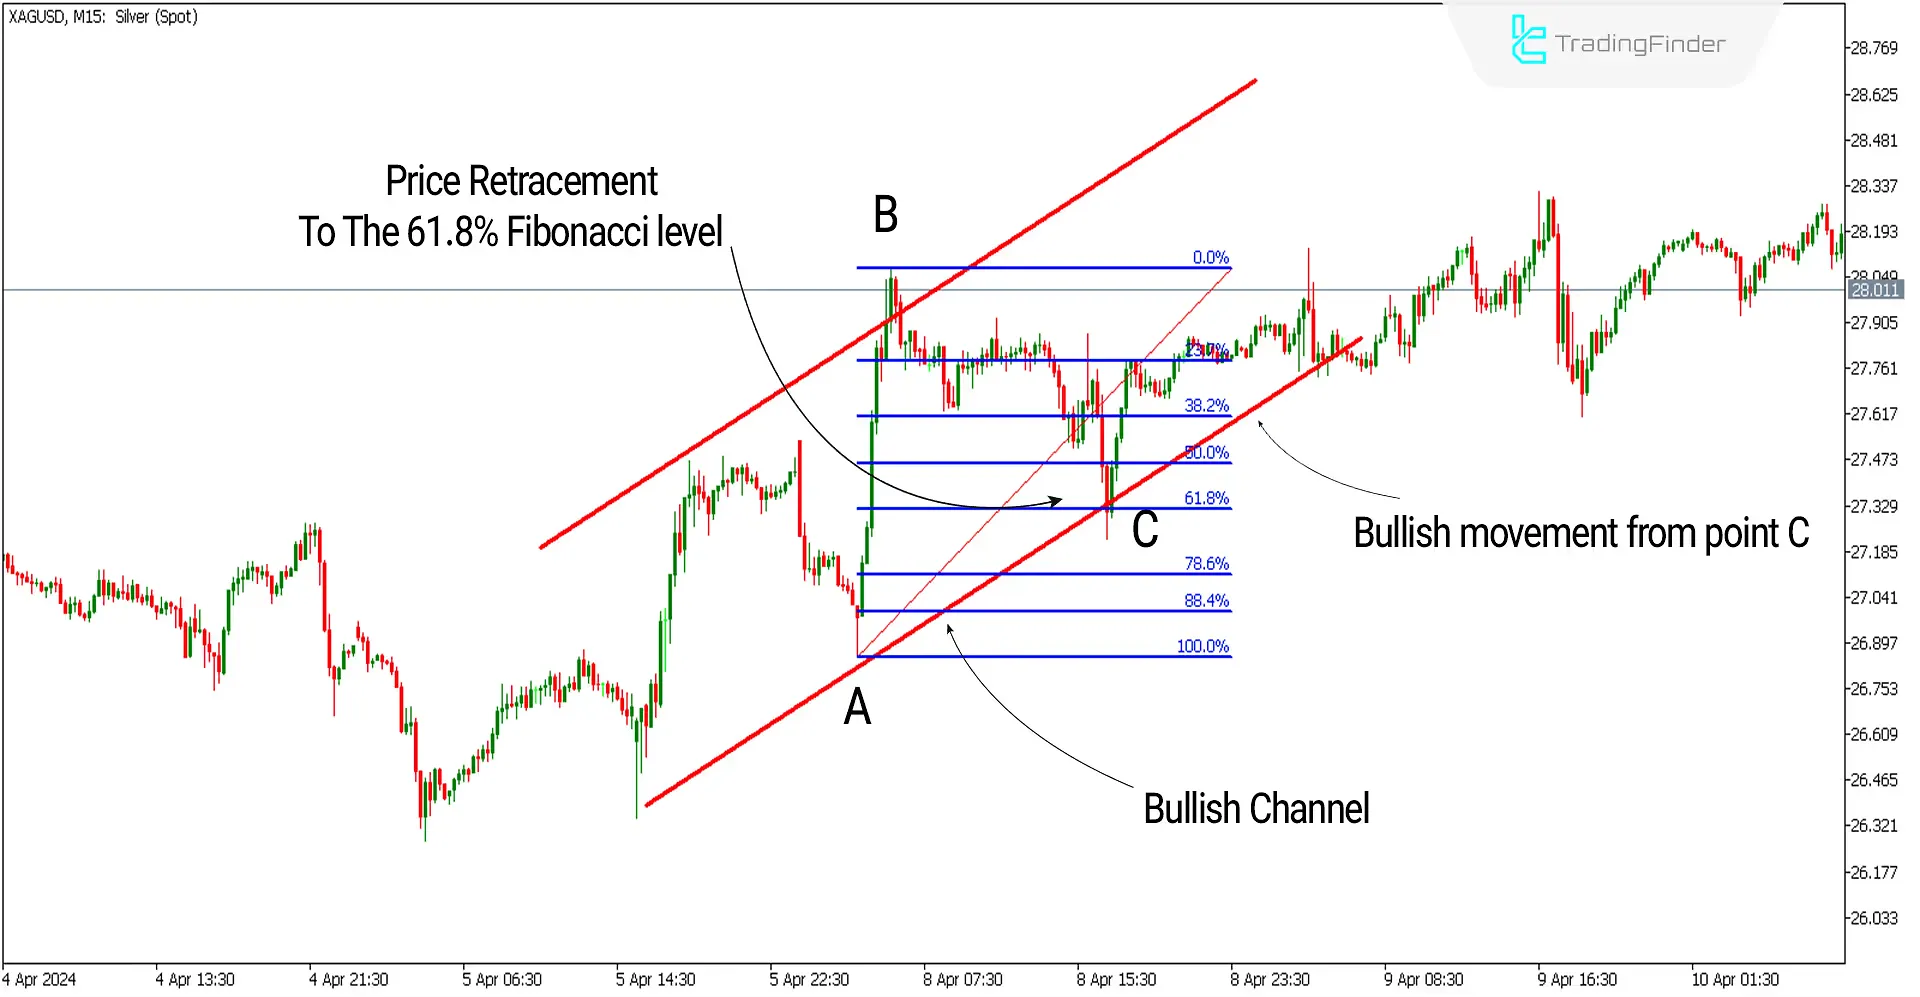
In the image below, a price chart of silver [XAGUSD] in a 15-minute timeframe is shown. The price correction (BC) has reached the 61.8% Fibonacci level and coincides with the lower band of a bullish channel.
In this scenario, the 61.8% Fibonacci level has acted as support, creating a suitable condition for entering buy trades. Top of FormBottom of Form

Bearish Fibonacci Conditions (Sell Position)
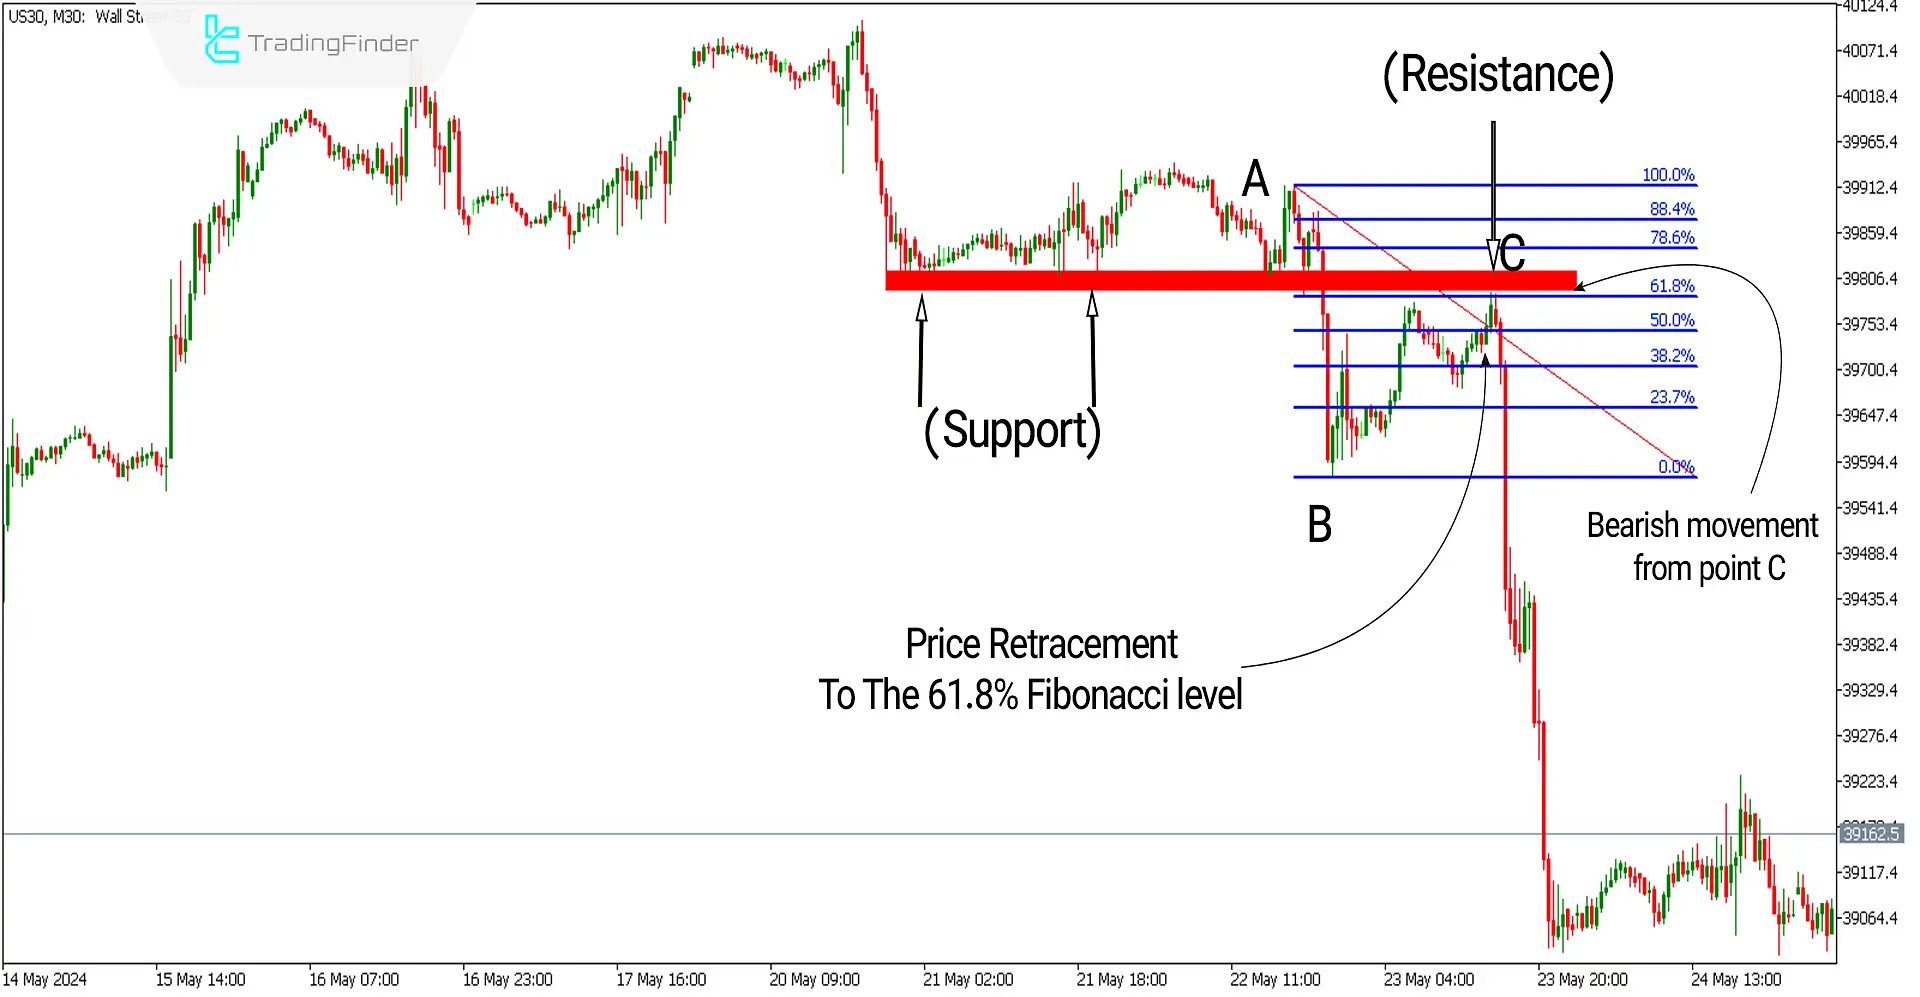
In the image below, a chart of the Dow Jones Index [US30] in a 30-minute timeframe shows the price correction (BC) reaching the 61.8% Fibonacci level and simultaneously encountering a level conversion (support turned into resistance).
In this scenario, the 61.8% Fibonacci level has acted as resistance, creating a suitable condition for entering sell trades.

Fibonacci Retracement Indicator Settings

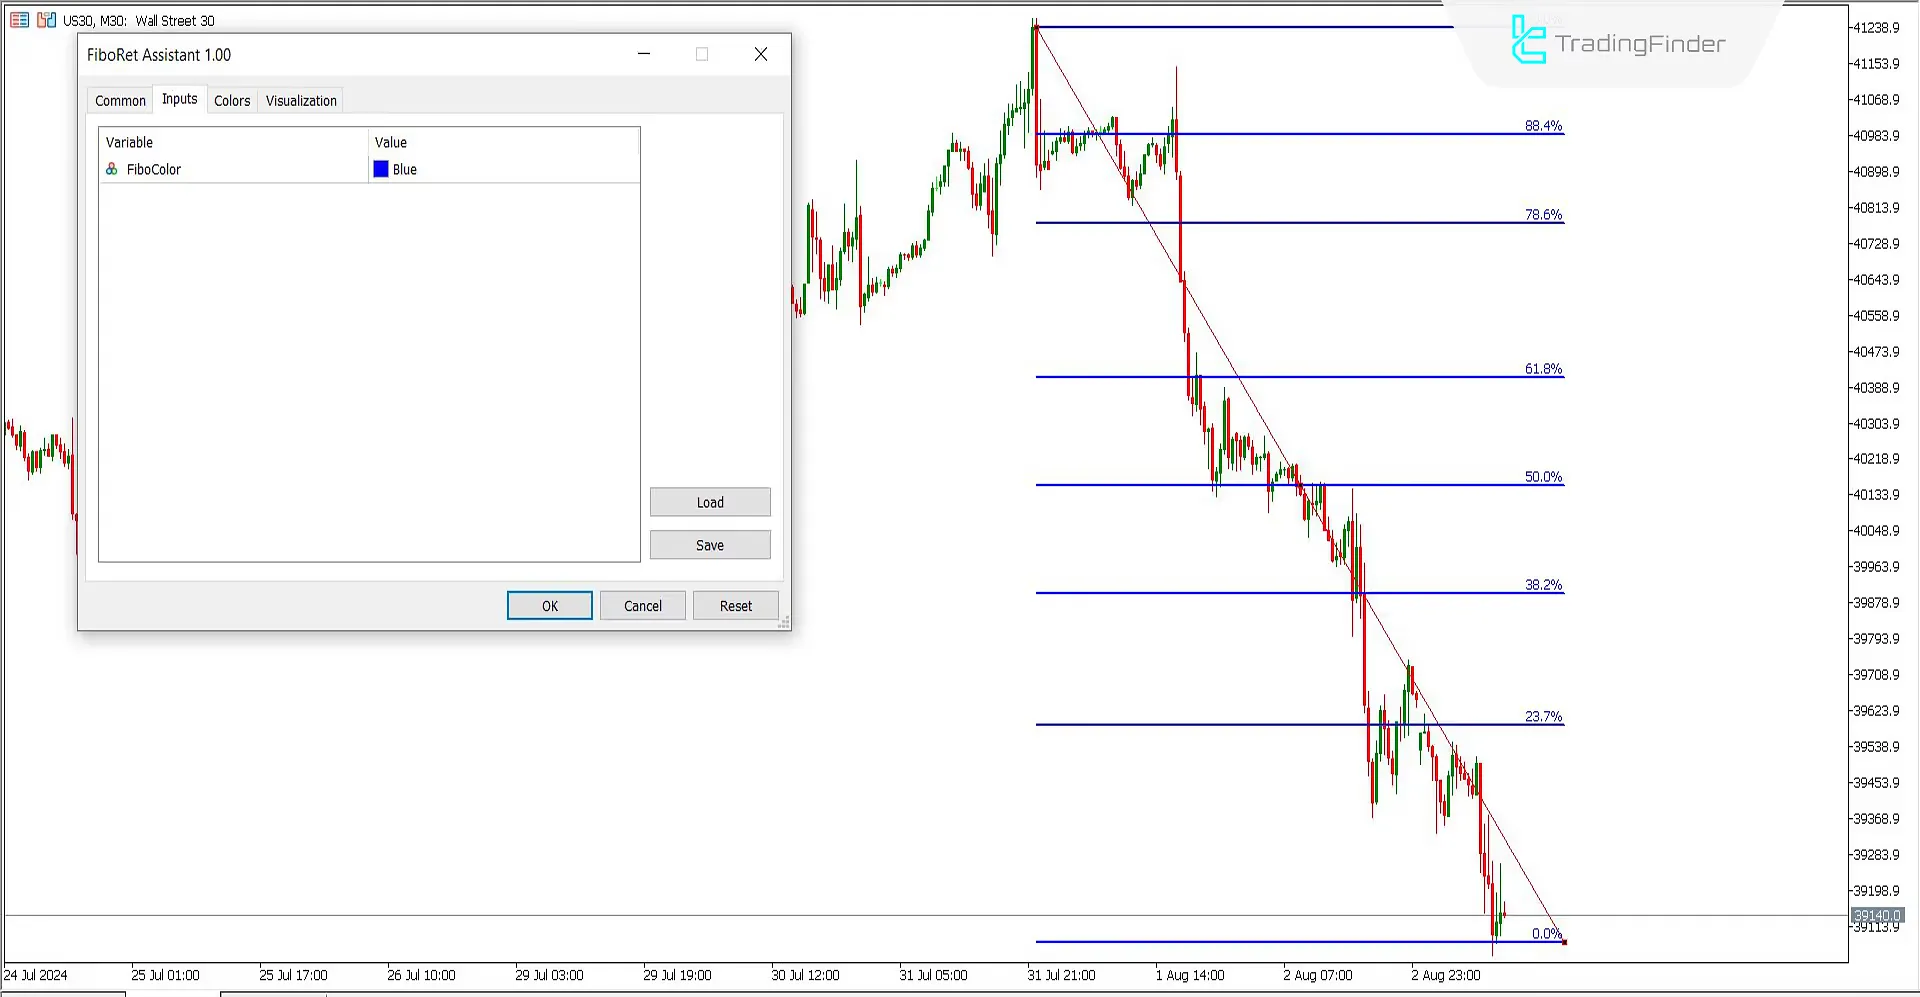
- FiboColor: Choose your preferred color according to the chart background color.
Note: The main level settings for the Fibonacci Assistant Indicator are pre-configured and do not require changes.
Conclusion
Many price movements and corrections occur upon encountering critical levels in the market. Fibonacci retracement levels can be key market levels for price reversals derived from several significant Fibonacci series numbers.
This indicator provides levels that can play a crucial role as MT5 Support and resistance indicator in price, automatically and without the need for adjustments for traders to use in their trading strategies.
Fibonacci Retracement Assistant MT5 PDF
Fibonacci Retracement Assistant MT5 PDF
Click to download Fibonacci Retracement Assistant MT5 PDFWhat is the use of the Fibonacci Retracement Assistant Indicator?
The practicality of the Fibonacci Retracement Indicator lies in its automatic provision of important Fibonacci retracement ratios, which are crucial for identifying price reversal points without the need for manual adjustments.
Is using the Fibonacci Indicator alongside other analytical tools beneficial?
Yes, using the Fibonacci Retracement Indicator with other technical analysis tools, such as price channels, support, and resistance levels, can be very beneficial.


