![Forex MTN Indicator for MetaTrader 5 – Free – [TradingFinder]](https://cdn.tradingfinder.com/image/421622/2-74-en-forex-mtn-mt5-1.webp)
![Forex MTN Indicator for MetaTrader 5 – Free – [TradingFinder] 0](https://cdn.tradingfinder.com/image/421622/2-74-en-forex-mtn-mt5-1.webp)
![Forex MTN Indicator for MetaTrader 5 – Free – [TradingFinder] 1](https://cdn.tradingfinder.com/image/421627/2-74-en-forex-mtn-mt5-2.webp)
![Forex MTN Indicator for MetaTrader 5 – Free – [TradingFinder] 2](https://cdn.tradingfinder.com/image/421628/2-74-en-forex-mtn-mt5-3.webp)
On July 6, 2025, in version 2, alert/notification and signal functionality was added to this indicator
The Forex MTN Indicator is a momentum-based tool developed for the MetaTrader 5 platform.
By technical analysis the intensity of price movements, this indicator identifies overbought and oversold zones in financial markets, including forex, cryptocurrencies, and commodities.
Forex MTN Indicator Specifications Table
The features and general information about the Forex MTN Indicator are comprehensively presented in the table below:
Indicator Categories: | Oscillators MT5 Indicators Signal & Forecast MT5 Indicators Trading Assist MT5 Indicators |
Platforms: | MetaTrader 5 Indicators |
Trading Skills: | Intermediate |
Indicator Types: | Reversal MT5 Indicators |
Timeframe: | Multi-Timeframe MT5 Indicators |
Trading Style: | Intraday MT5 Indicators |
Trading Instruments: | Forex MT5 Indicators Crypto MT5 Indicators Stock MT5 Indicators Commodity MT5 Indicators Indices MT5 Indicators Share Stock MT5 Indicators |
Indicator at a Glance
In the Forex MTN Indicator, when momentum approaches overbought or oversold zones, the tool generates entry and exit signals using colored dots:
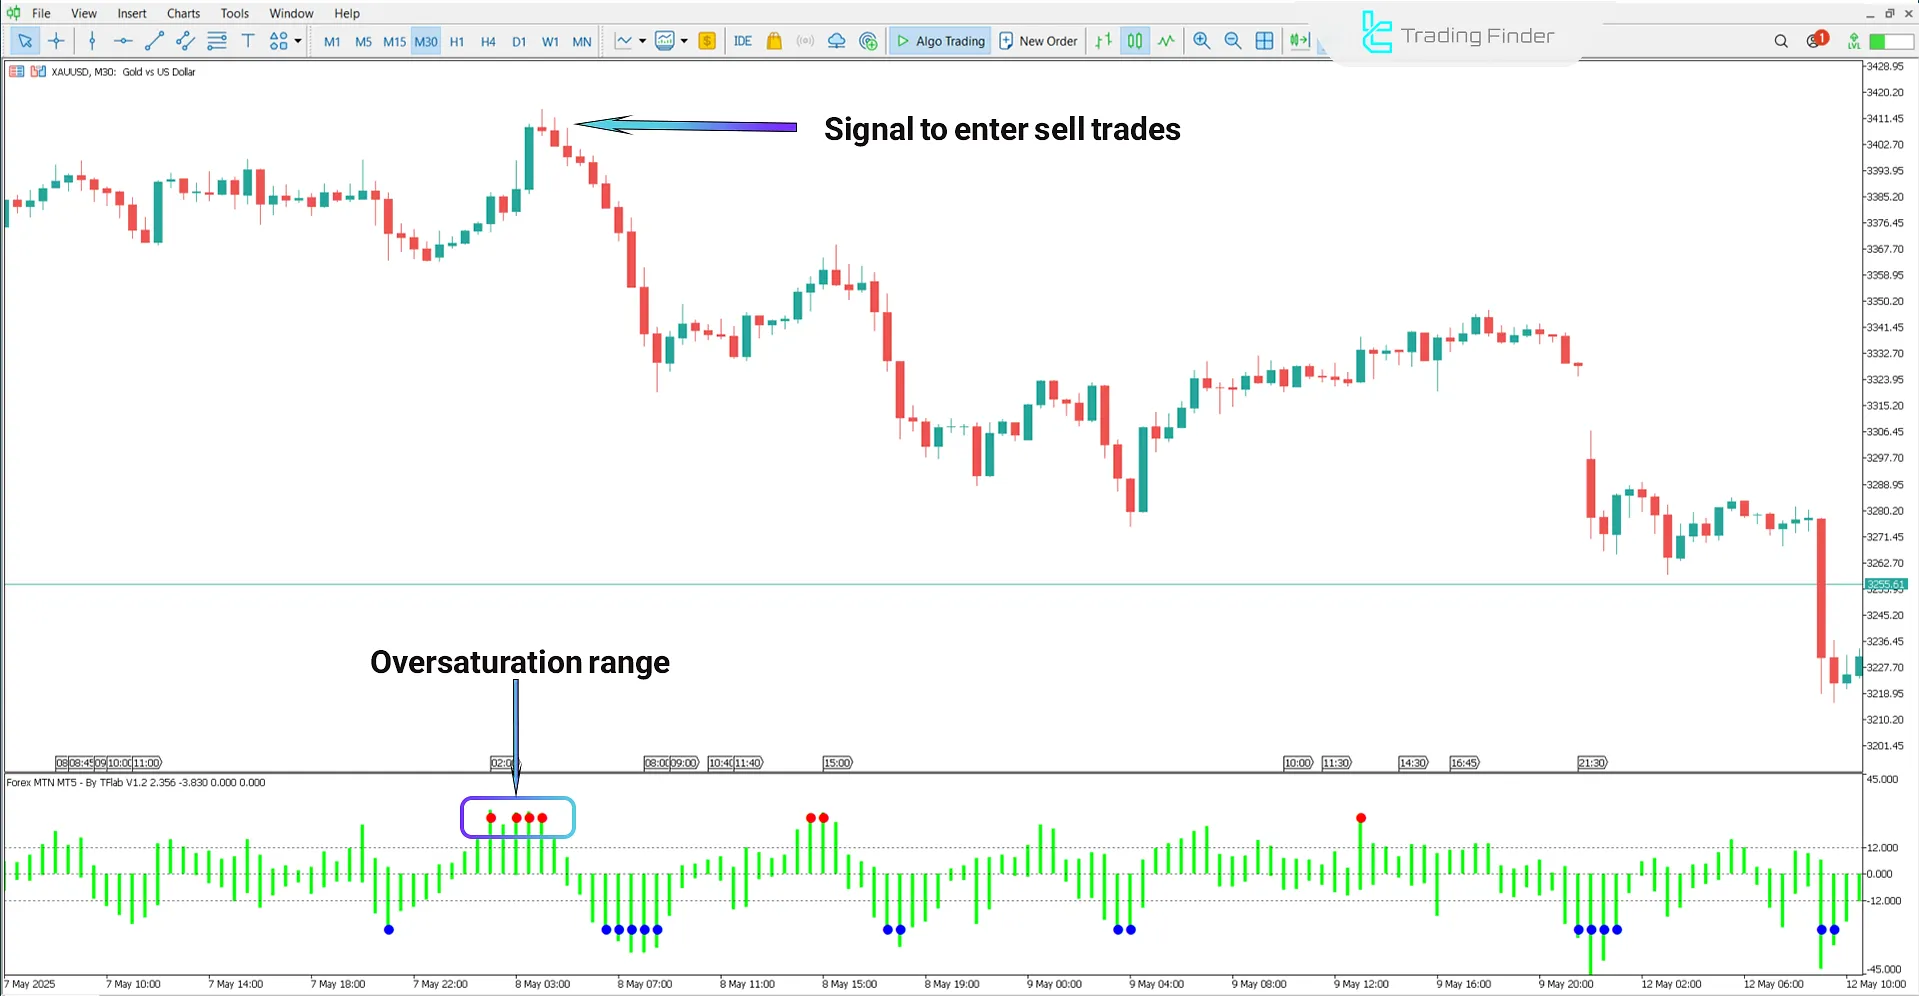
- +24 level: Indicates entry into the overbought zone, shown with a red dot
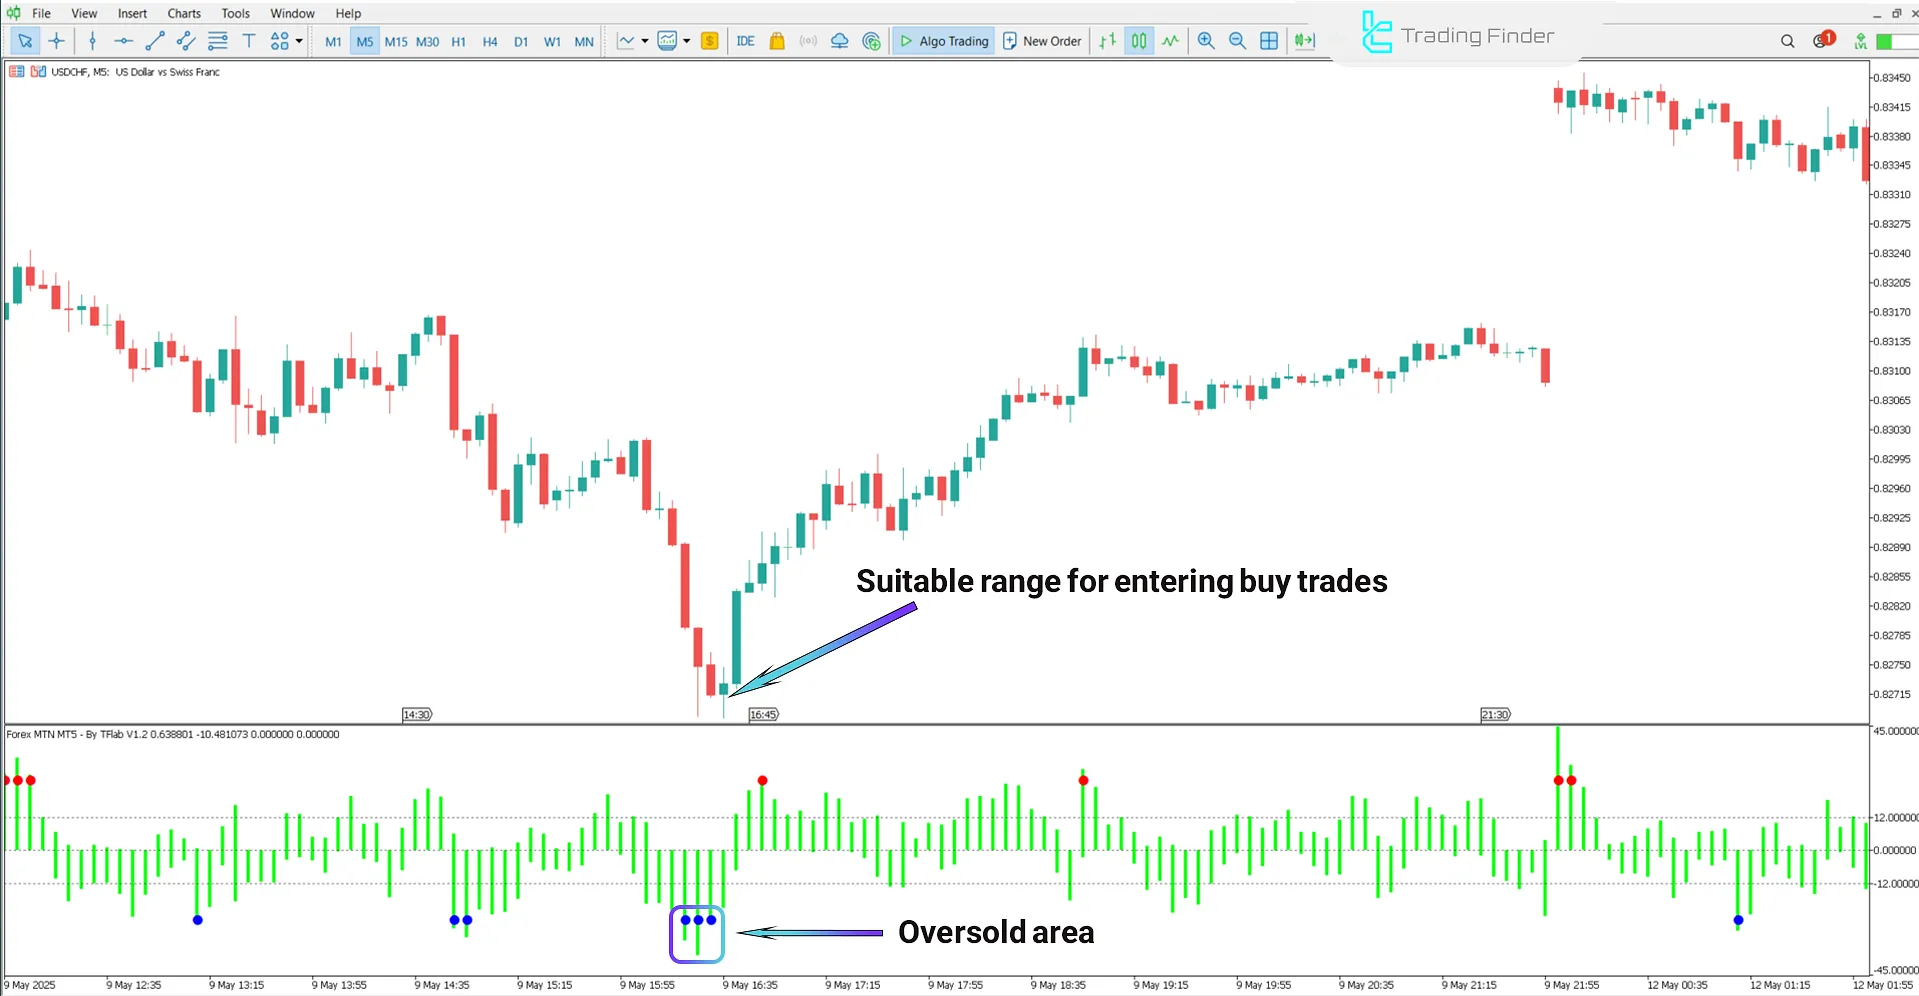
- −24 level: Indicates entry into the oversold zone, shown with a blue dot
Uptrend Conditions
The chart below shows the USD/CHF currency pair in the 5-minute timeframe. When the price is in an uptrend, and the histogram bars enter the oversold zone (below −24), it indicates weakening bearish momentum.
If blue dots appear simultaneously, this can be considered a buy signal.

Downtrend Conditions
The chart below displays XAUUSD (Gold) in the 30-minute timeframe. When the price is in a downtrend, and the histogram bars enter the overbought zone, signs of weakening in the corrective move appear.
If a red dot appears above the bars simultaneously, this can signal a suitable condition for a sell trade.

Conclusion
The Forex MTN Indicator (Forex MTN) is a momentum-based technical analysis tool that provides trading signals by analyzing price movement to identify overbought and oversold zones.
This indicator has no input parameters and operates automatically, requiring no initial settings.
On what basis does the Forex MTN Indicator generate signals?
This trading tool issues entry and exit signals based on momentum analysis and when the histogram crosses into overbought or oversold zones, accompanied by colored dots (blue and red).
When is a buy signal generated in the Forex MTN Indicator?
A buy signal is triggered when the histogram enters the oversold zone (below −24), and a blue dot appears simultaneously below the bars.


