![Forex Profit Boost Indicator for MT5 Download – Free – [TradingFinder]](https://cdn.tradingfinder.com/image/424460/13-141-fa-forex-profit-boost-mt5-01.webp)
![Forex Profit Boost Indicator for MT5 Download – Free – [TradingFinder] 0](https://cdn.tradingfinder.com/image/424460/13-141-fa-forex-profit-boost-mt5-01.webp)
![Forex Profit Boost Indicator for MT5 Download – Free – [TradingFinder] 1](https://cdn.tradingfinder.com/image/424457/13-141-fa-forex-profit-boost-mt5-02.webp)
![Forex Profit Boost Indicator for MT5 Download – Free – [TradingFinder] 2](https://cdn.tradingfinder.com/image/424458/13-141-fa-forex-profit-boost-mt5-03.webp)
![Forex Profit Boost Indicator for MT5 Download – Free – [TradingFinder] 3](https://cdn.tradingfinder.com/image/424459/13-141-fa-forex-profit-boost-mt5-04.webp)
The Forex Profit Boost Indicator is designed to detect bullish and bearish trends across various markets, including forex, cryptocurrency, stock indices, and commodities.
By combining traditional Bollinger Band techniques with moving averages, this tool identifies optimal trade entry and exitpoints and provides buy and sell signals.
The indicator consists of a series of colored histogram bars, where a color change is considered a signal for trade entry.
Forex Profit Boost Indicator Specifications
The technical specifications of the Forex Profit Boost Indicator are presented in the table below.
Indicator Categories: | Signal & Forecast MT5 Indicators Volatility MT5 Indicators Trading Assist MT5 Indicators |
Platforms: | MetaTrader 5 Indicators |
Trading Skills: | Elementary |
Indicator Types: | Reversal MT5 Indicators |
Timeframe: | Multi-Timeframe MT5 Indicators |
Trading Style: | Swing Trading MT5 Indicators Scalper MT5 Indicators Day Trading MT5 Indicators |
Trading Instruments: | Forex MT5 Indicators Crypto MT5 Indicators Stock MT5 Indicators |
Forex Profit Boost at a Glance
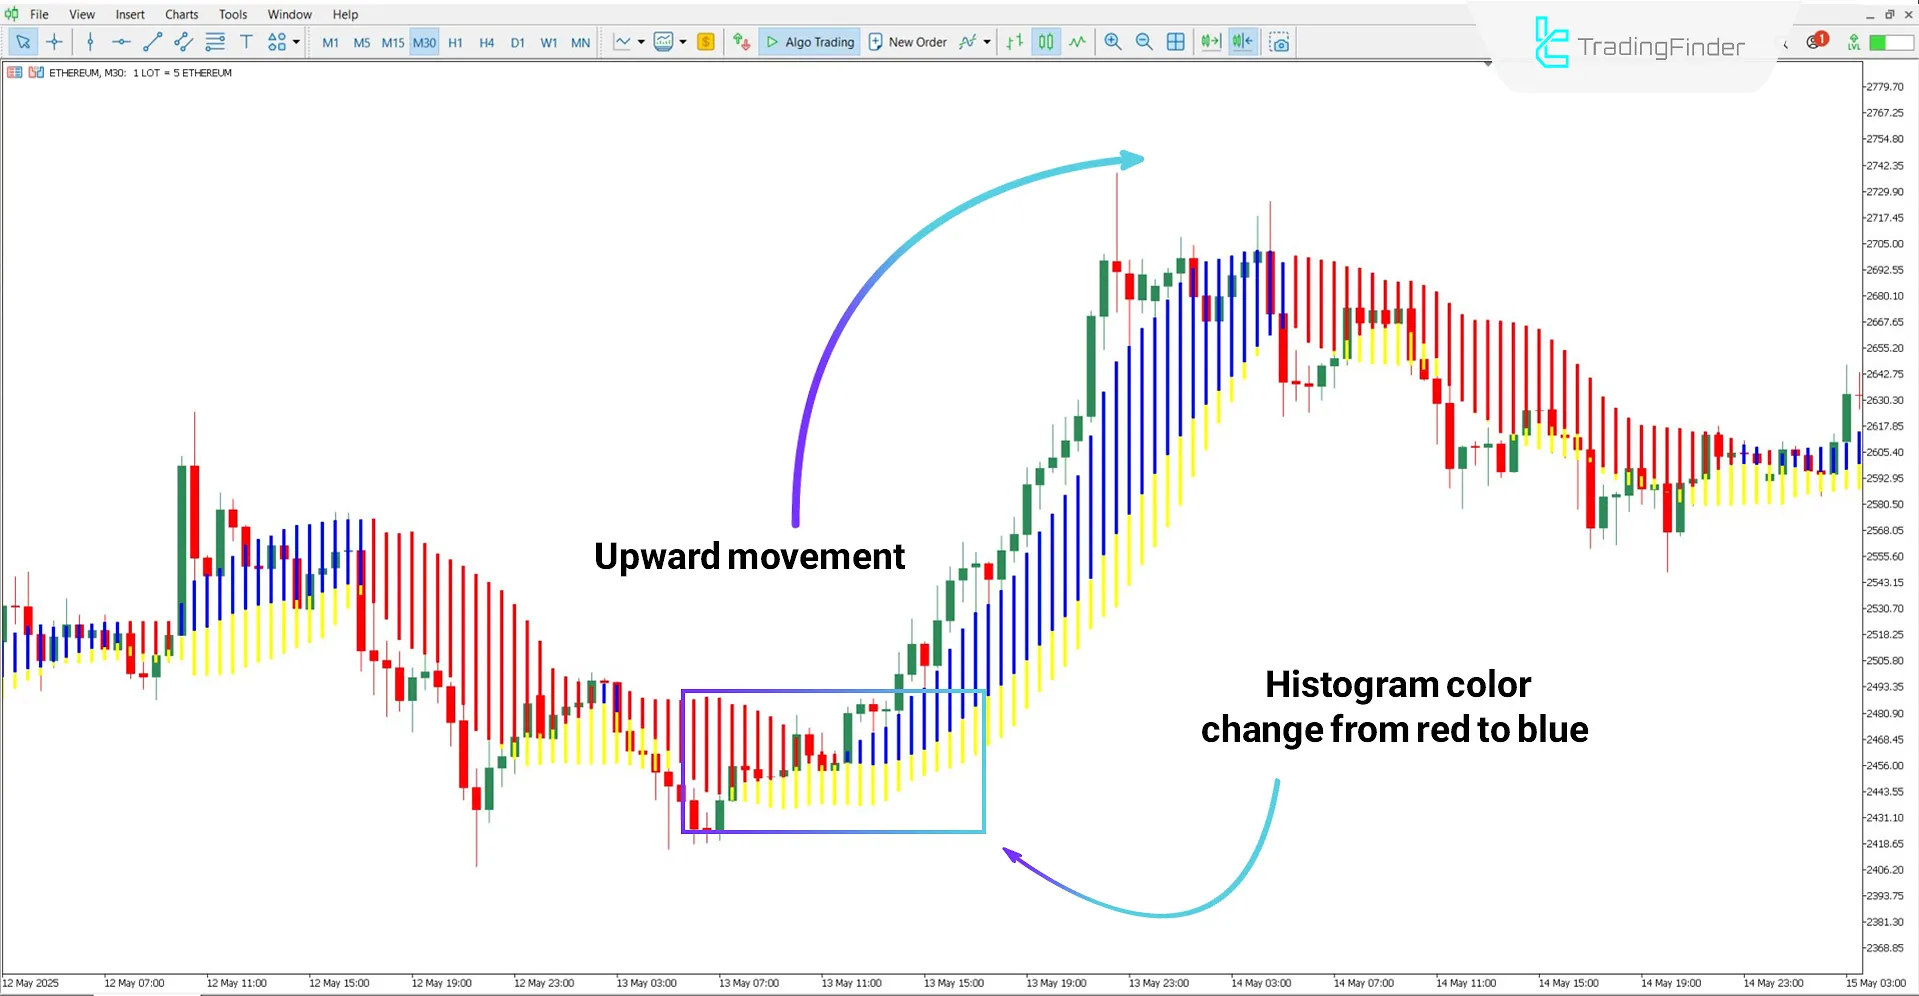
The Forex Profit Boost Indicator uses a combination of yellow and blue bars to show the beginning or continuation of a bullish trend. Similarly, when the market shifts to a bearish trend, the bars change to yellow and red to warn of a potential trend reversal.
Bullish Trend Conditions
Based on the Ethereum (ETH) chart in the 30-minute timeframe, the repeated formation of blue histogram bars indicates a positive market direction and strengthens the bullish trend. Additionally, a color change from red to blue may signal the start of buying opportunities.

Bearish Trend Conditions
According to theNZD/USD currency pair chart in the 1-hour timeframe, a change from blue to red in the histogram bars may indicate the beginning of sell trades. Moreover, a series of red bars reflects strengthening bearish momentum.

Forex Profit Boost Indicator Settings
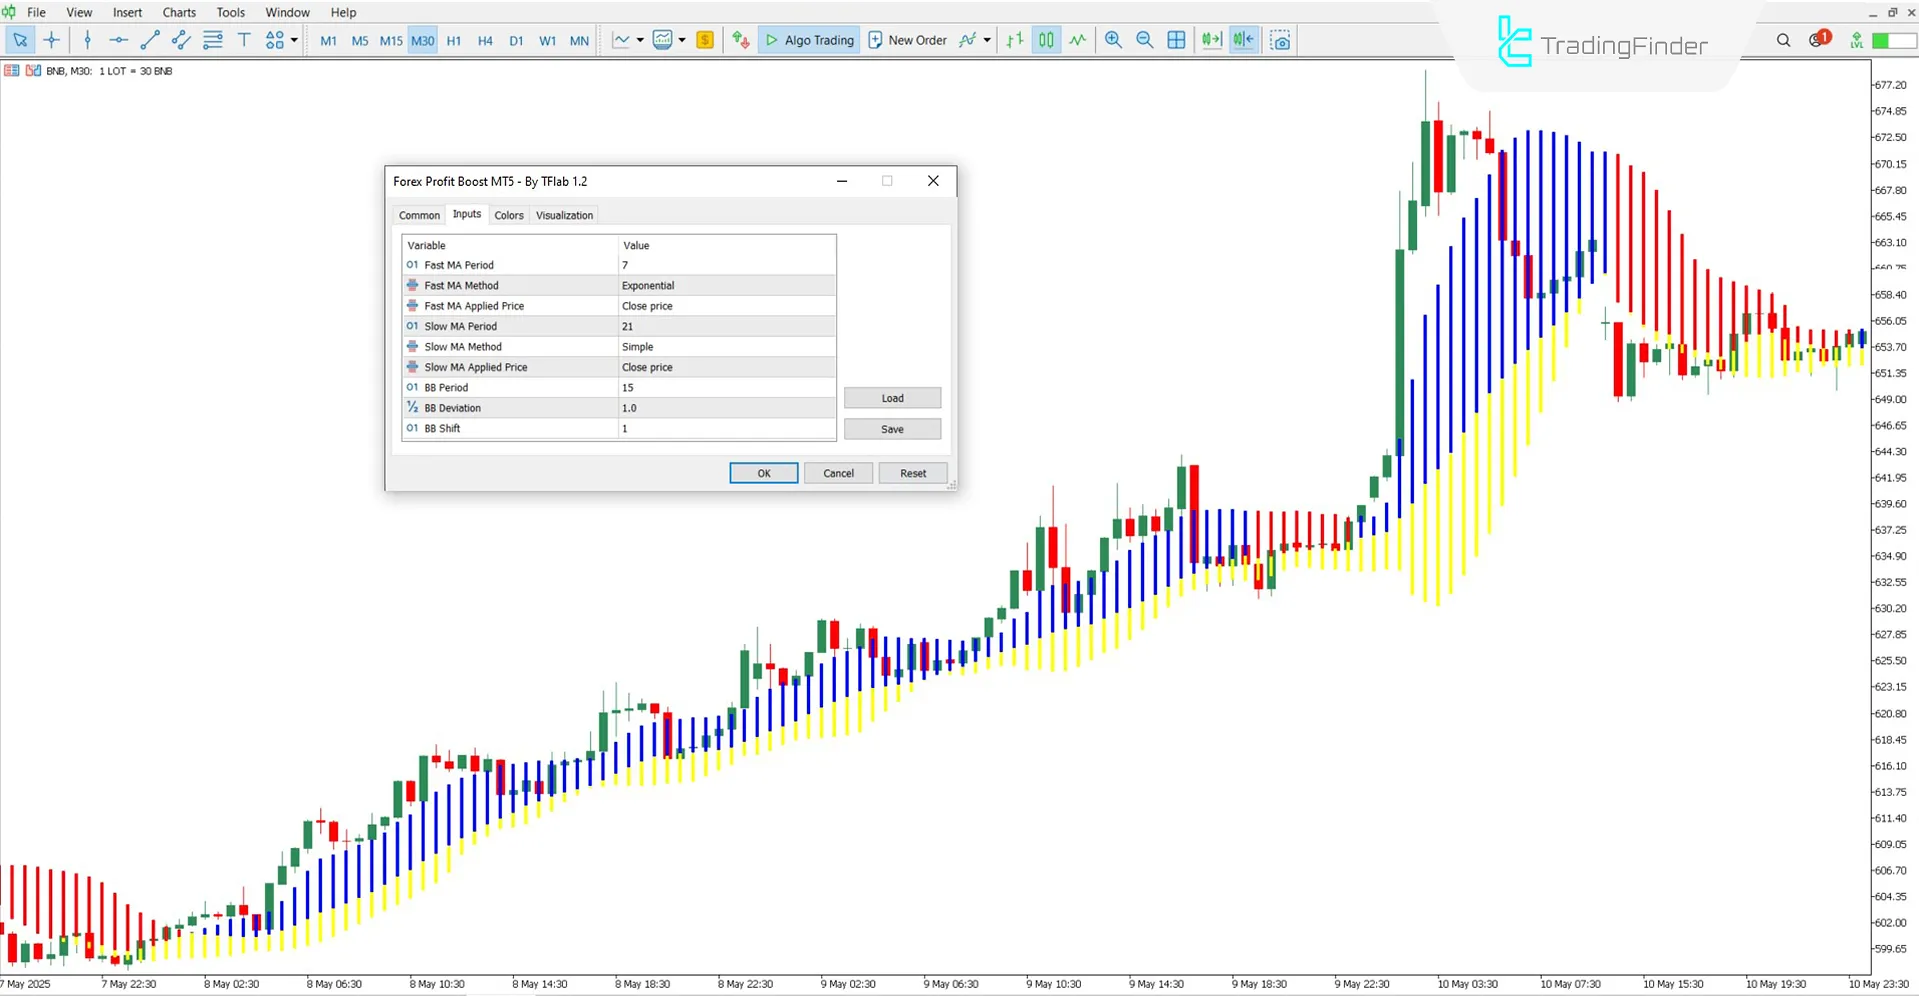
The image below includes the settings section for the Forex Profit Boost Indicator:

- Fast MA Period: Period of the fast moving average
- Fast MA Method: Type of fast moving average
- Fast MA Applied Price: Price type used to calculate the fast moving average
- Slow MA Period: Period of the slow moving average
- Slow MA Method: Type of slow moving average
- Slow MA Applied Price: Price type used to calculate the slow moving average
- BB Period: Calculation period for Bollinger Bands
- BB Deviation: Standard deviation from the mean to draw upper and lower bands
- BB Shift: Forward or backward shift of the Bollinger Bands
Conclusion
The Forex Profit Boost Indicator facilitates the identification of market reversals by graphically and simply displaying price direction through colored histograms. Moreover, the gradual color change of these bars acts as a warning signal, helping to pinpoint optimal moments to enter or exit trades.
Forex Profit Boost MT5 PDF
Forex Profit Boost MT5 PDF
Click to download Forex Profit Boost MT5 PDFIs the Forex Profit Boost Indicator only usable in the Forex market?
No, this indicator can be applied and used across all markets without any limitations.
Can the Forex Profit Boost Indicator be used on larger timeframes?
Yes, this trading tool is multi-timeframe and works on all time intervals.


