![Fractal Dimension Indicator for MetaTrader 5 – [TFlab] - Download](https://cdn.tradingfinder.com/image/443228/2-95-en-fractal-dimension-indicator-mt5-1.webp)
![Fractal Dimension Indicator for MetaTrader 5 – [TFlab] - Download 0](https://cdn.tradingfinder.com/image/443228/2-95-en-fractal-dimension-indicator-mt5-1.webp)
![Fractal Dimension Indicator for MetaTrader 5 – [TFlab] - Download 1](https://cdn.tradingfinder.com/image/443226/2-95-en-fractal-dimension-indicator-mt5-2.webp)
![Fractal Dimension Indicator for MetaTrader 5 – [TFlab] - Download 2](https://cdn.tradingfinder.com/image/443227/2-95-en-fractal-dimension-indicator-mt5-3.webp)
![Fractal Dimension Indicator for MetaTrader 5 – [TFlab] - Download 3](https://cdn.tradingfinder.com/image/443229/2-95-en-fractal-dimension-indicator-mt5-4.webp)
The Fractal Dimension Indicator in MetaTrader 5 is a technical analysis tool used to measure the level of complexity and irregularity in price movements in financial markets.
This oscillator utilizes a green reference line to indicate whether price action within a selected timeframe is trending or exhibiting random oscillations.
Fractal Dimension Indicator Table
The table below presents the specifications of the Fractal Dimension Indicator.
Indicator Categories: | Oscillators MT5 Indicators Volatility MT5 Indicators Trading Assist MT5 Indicators |
Platforms: | MetaTrader 5 Indicators |
Trading Skills: | Intermediate |
Indicator Types: | Reversal MT5 Indicators |
Timeframe: | Multi-Timeframe MT5 Indicators |
Trading Style: | Intraday MT5 Indicators |
Trading Instruments: | Forex MT5 Indicators Crypto MT5 Indicators Stock MT5 Indicators |
Indicator Overview
The Fractal Dimension Indicator consists of three distinct lines, each serving a specific purpose in market condition analysis:
- Reference Line: A dotted horizontal line at the 1.5 level, acting as the boundary between trending and ranging markets;
- Dynamic Color Line (Red / Blue): The main indicator line that changes color based on the fractal dimension value.
Uptrend Conditions
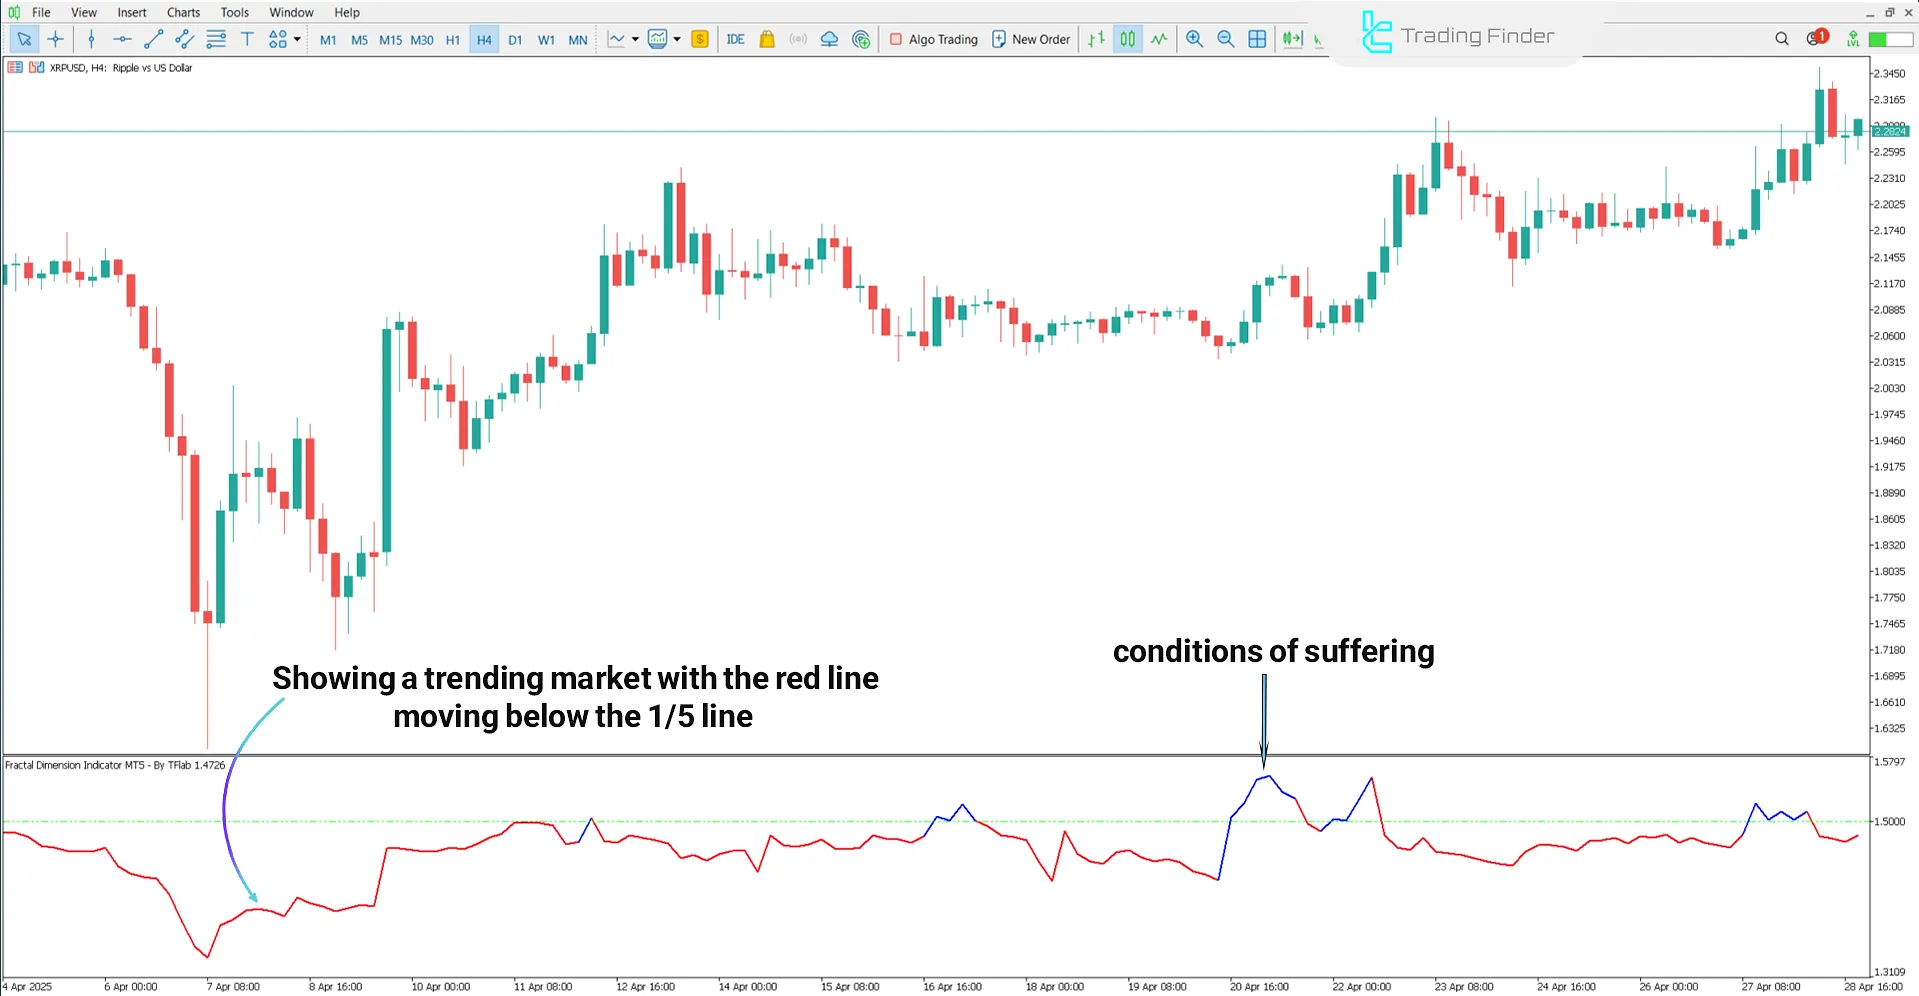
The following chart displays the Ripple cryptocurrency (XRP/USD) over a 4-hour timeframe. When the Fractal Dimension line gradually moves from above 1.5 to below, it indicates reduced volatility and signals the possible beginning of a stable market trend.
In this situation, the line color shifts from blue to red, and maintaining this state across several consecutive candles confirms the presence of a steady uptrend.

Downtrend Conditions
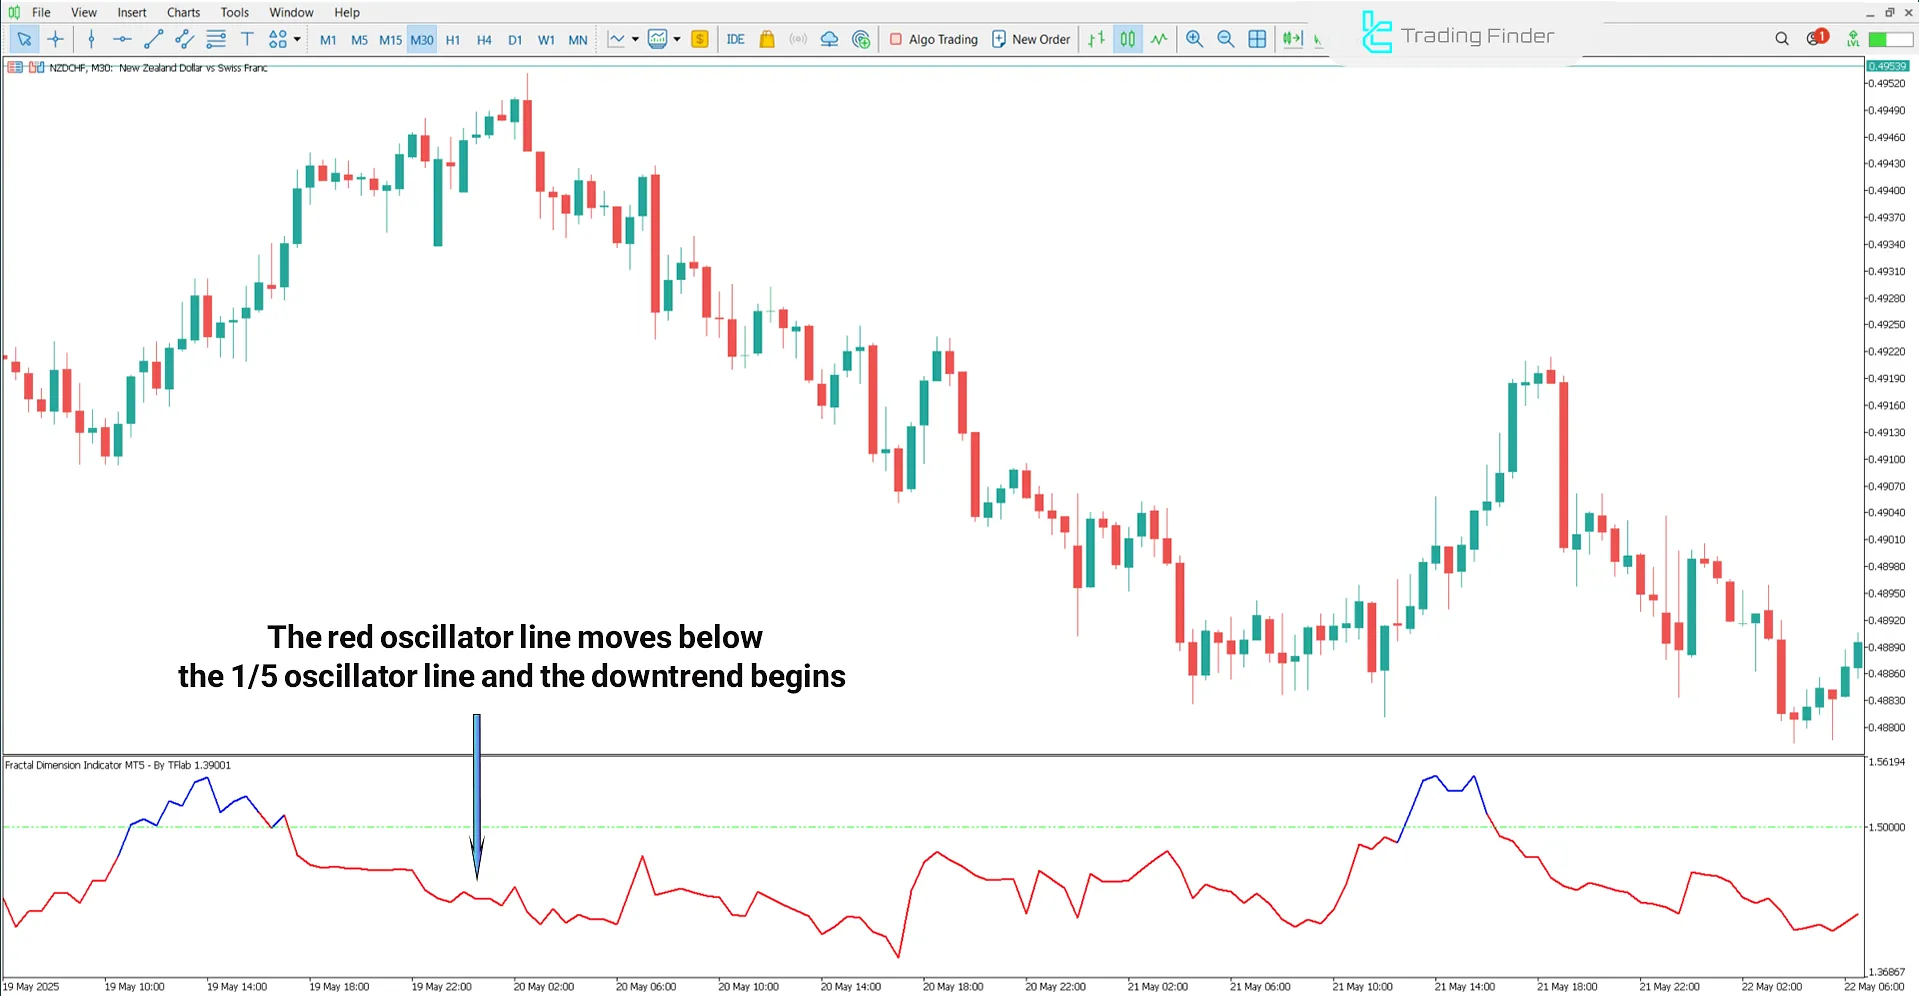
The following image shows the NZD/CHF currency pair in a 30-minute timeframe. When the indicator line stabilizes below the 1.5 level and turns red, the market is considered to be trending.
However, if the color changes to blue and the line moves above 1.5, it signals a weakening trend.

Fractal Dimension Indicator Settings
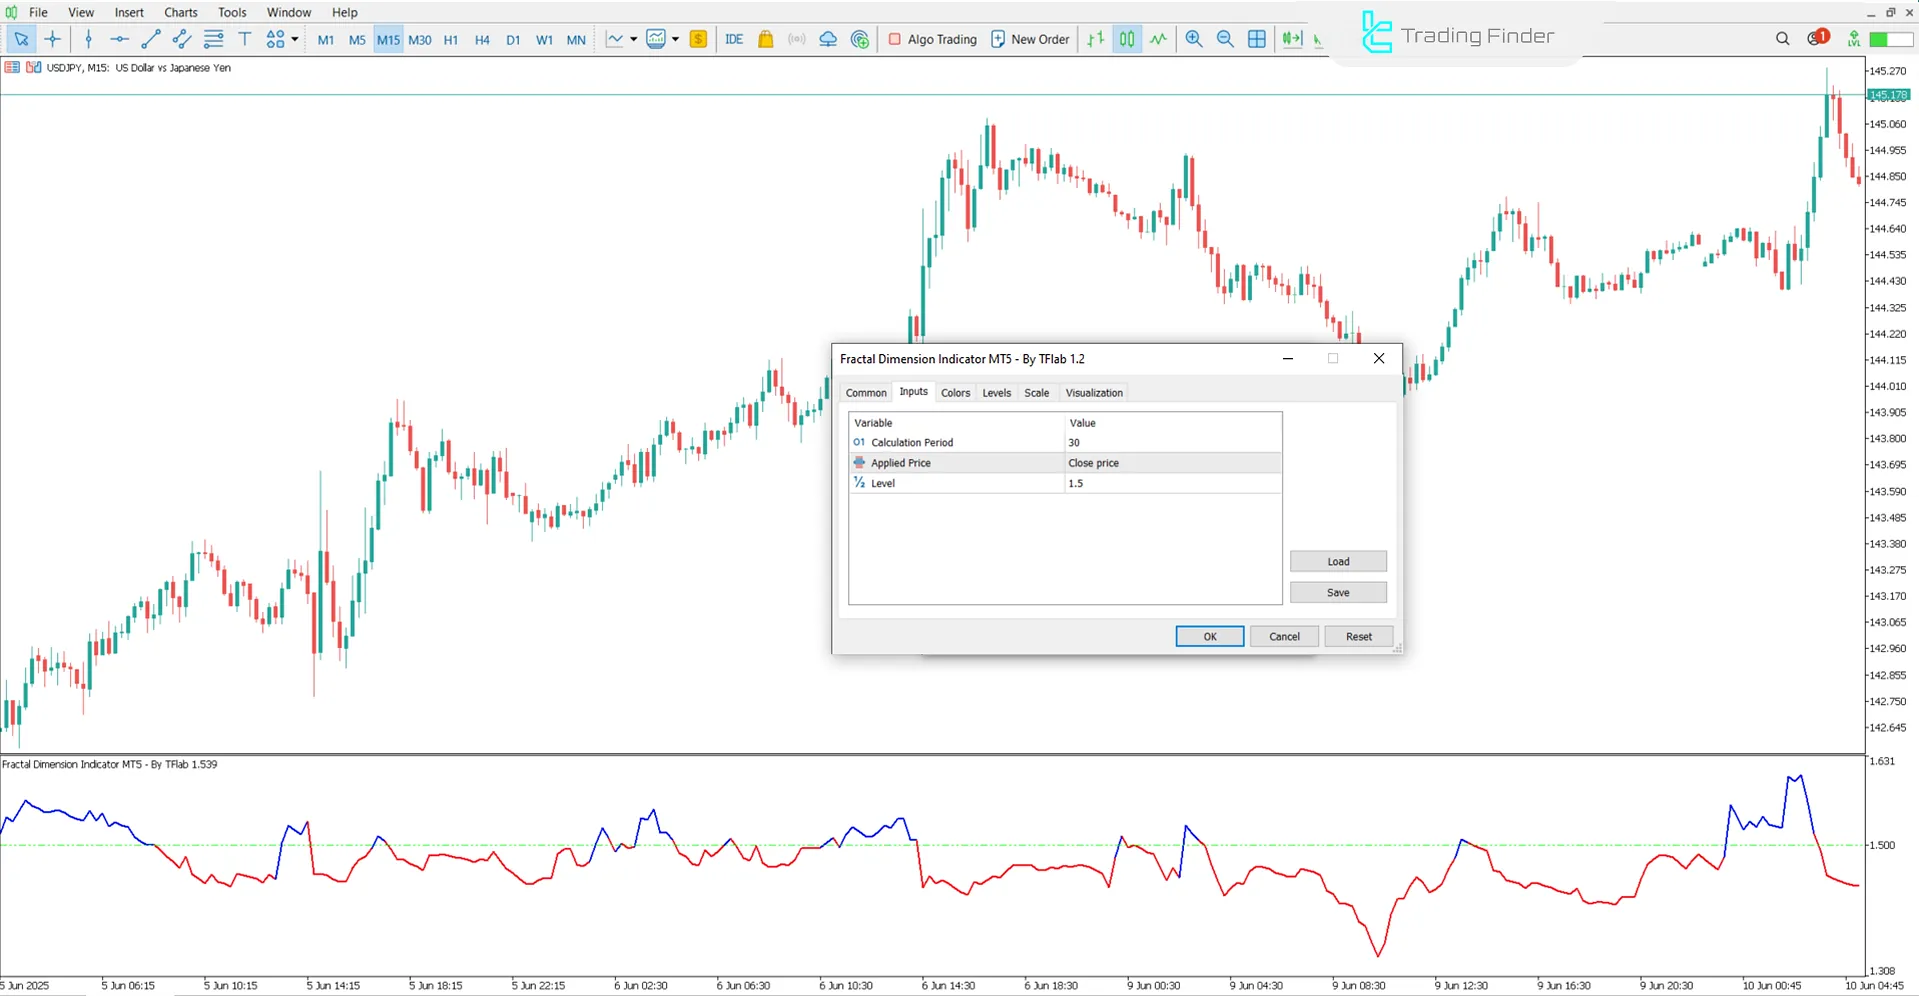
The image below shows the settings panel of the Fractal Dimension Indicator:

- Calculation Period: The calculation window;
- Applied Price: The price type used in calculations;
- Level: The reference threshold.
Conclusion
The Fractal Dimension Indicator is an advanced, non-signal-generating analytical tool that provides a deep insight into price dynamics within the market.
This indicator is helpful in both trend-based and non-trend-based trading strategies, serving as a powerful filter for distinguishing between different market phases.
Fractal Dimension MT5 PDF
Fractal Dimension MT5 PDF
Click to download Fractal Dimension MT5 PDFWhat does the Fractal Dimension Indicator measure?
It measures the level of complexity and order in price movements over a specific period.
In which markets can the Fractal Dimension Indicator be used?
This indicator can be applied across all financial markets, including Forex, stocks, cryptocurrencies, commodities, and indices, and its performance does not depend on the asset class.


