![Free Scalping Indicator for MetaTrader 5 Download - [TradingFinder]](https://cdn.tradingfinder.com/image/233936/2-20-en-free_scalping_indicator-mt5-1.webp)
![Free Scalping Indicator for MetaTrader 5 Download - [TradingFinder] 0](https://cdn.tradingfinder.com/image/233936/2-20-en-free_scalping_indicator-mt5-1.webp)
![Free Scalping Indicator for MetaTrader 5 Download - [TradingFinder] 1](https://cdn.tradingfinder.com/image/233938/2-20-en-free_scalping_indicator-mt5-2.webp)
![Free Scalping Indicator for MetaTrader 5 Download - [TradingFinder] 2](https://cdn.tradingfinder.com/image/233937/2-20-en-free_scalping_indicator-mt5-3.webp)
![Free Scalping Indicator for MetaTrader 5 Download - [TradingFinder] 3](https://cdn.tradingfinder.com/image/233939/2-20-en-free_scalping_indicator-mt5-4.webp)
The Free Scalping Indicator is an effective tool for identifying direction and evaluating trend strength on the MetaTrader 5 platform.
The increasing length of the histogram, whether in the positive or negative range, indicates strengthened momentum and price movement in the same direction.
Due to its capability to provide quick analyses, this highly volatile indicator is an excellent choice for scalpers and traders seeking to capitalize on price fluctuations in forex and cryptocurrency markets.
Free Scalping Specifications Table
Table below provides an overview of the features and specifications of the Free Scalping Indicator.
Indicator Categories: | Oscillators MT5 Indicators Volatility MT5 Indicators Currency Strength MT5 Indicators |
Platforms: | MetaTrader 5 Indicators |
Trading Skills: | Intermediate |
Indicator Types: | Breakout MT5 Indicators Reversal MT5 Indicators |
Timeframe: | Multi-Timeframe MT5 Indicators |
Trading Style: | Intraday MT5 Indicators Scalper MT5 Indicators |
Trading Instruments: | Forex MT5 Indicators Crypto MT5 Indicators Stock MT5 Indicators |
Indicator Overview
The Free Scalping Indicator uses a histogram to analyze trend direction and strength, displaying buy and sell zones to traders.
Moreover, the gradual reduction in histogram size usually indicates weakened momentum and reduced price movement, which sometimes signals the end of a trend.
Uptrend Conditions
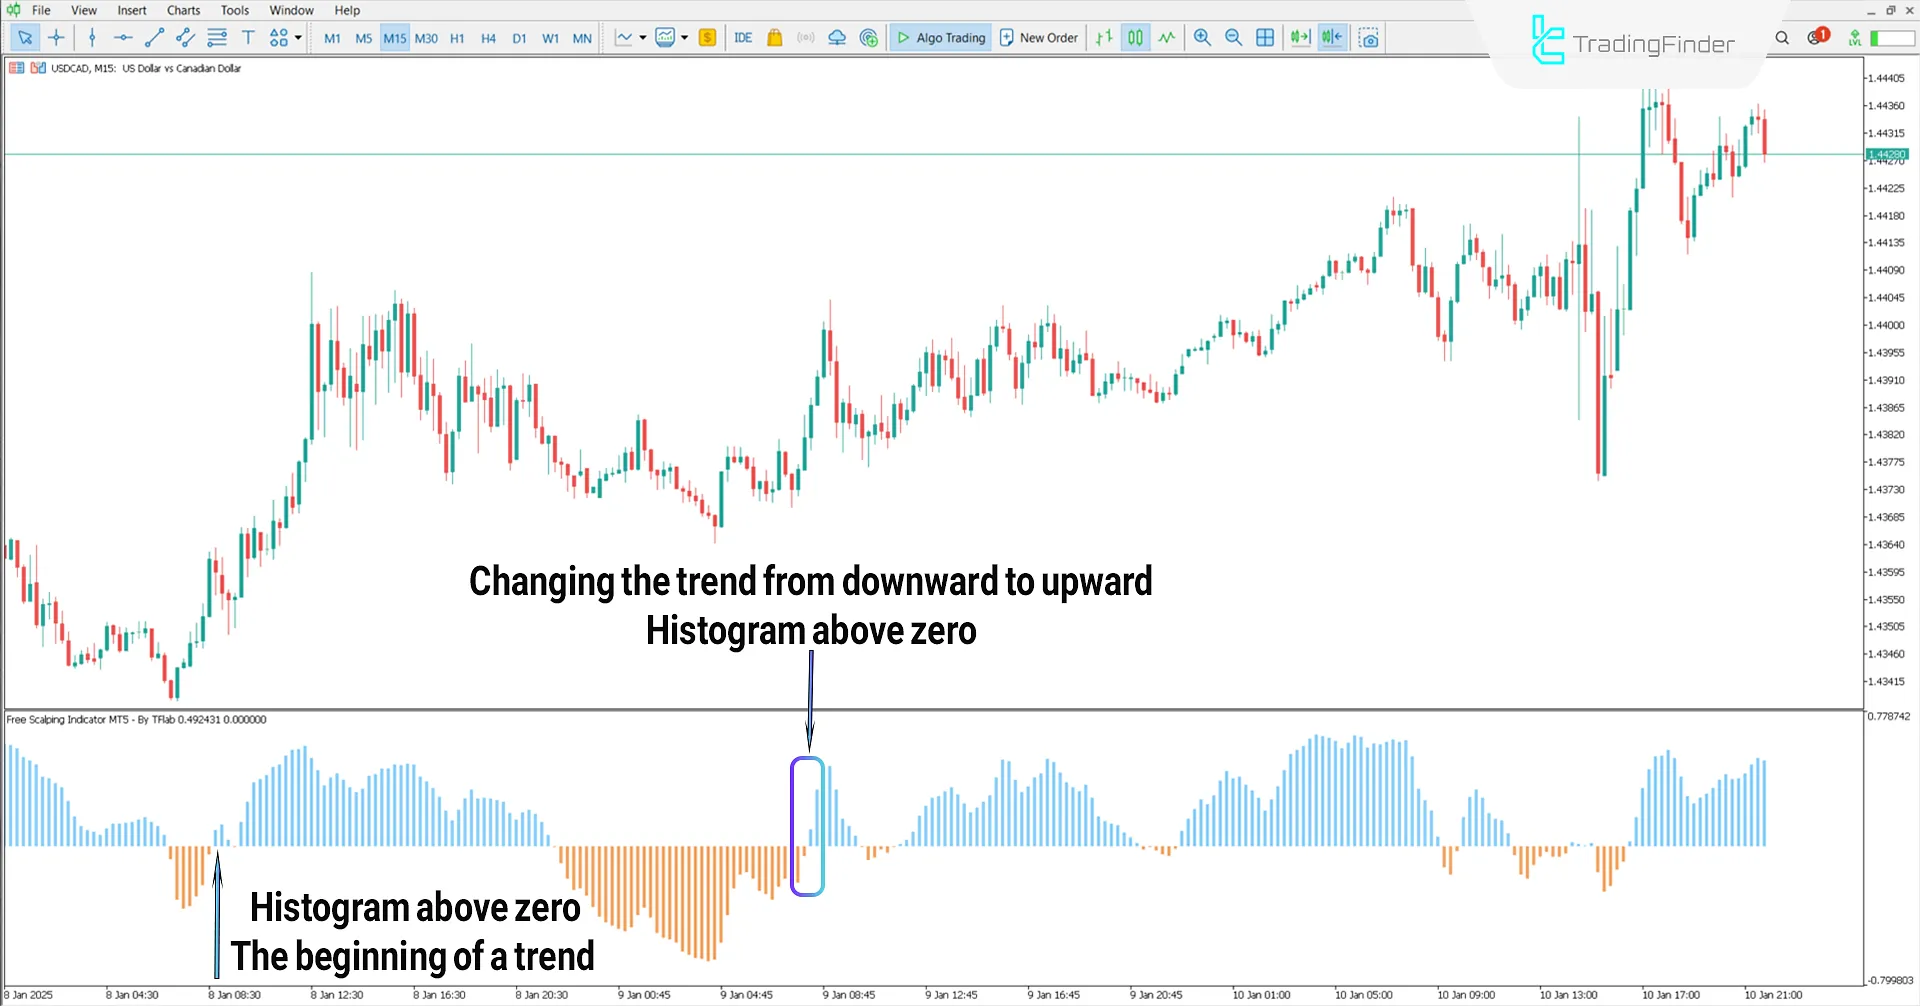
The price chart below shows the USD against CAD (USD/CAD) in a 15-minute timeframe.
When this highly MetaTrader 5 volatile indicator appears in the positive zone (above zero), and the histograms are displayed in blue, this signifies the formation of an upward trend in the market.
The rising height of the histograms signifies strengthening momentum and increased price acceleration upward, providing traders with an entry point for buy positions.

Downtrend Conditions
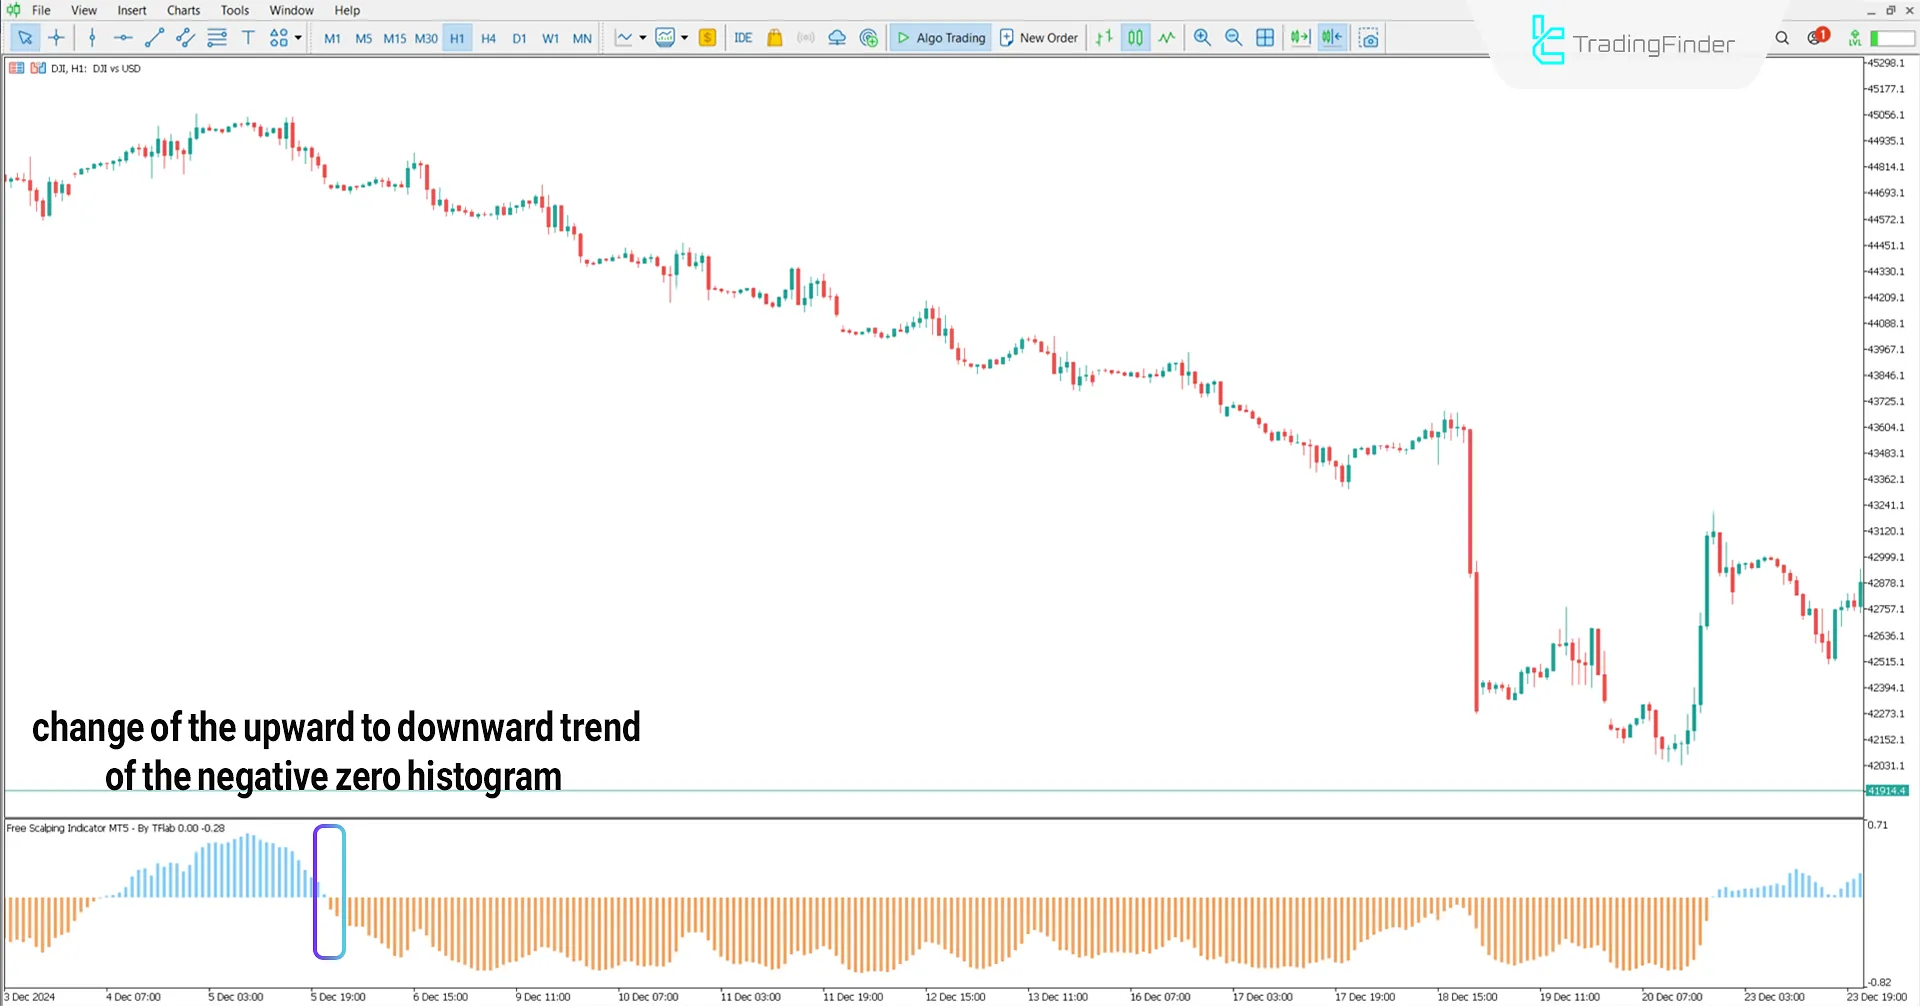
The image below illustrates the Dow Jones Index (DJI) in a 1-hour timeframe. When the oscillator MetaTrader5 falls below zero, and histograms appear orange, the market has entered a bearish trend.
The longer the negative histograms become, the stronger the downward momentum and price acceleration in the bearish direction.

Indicator Settings
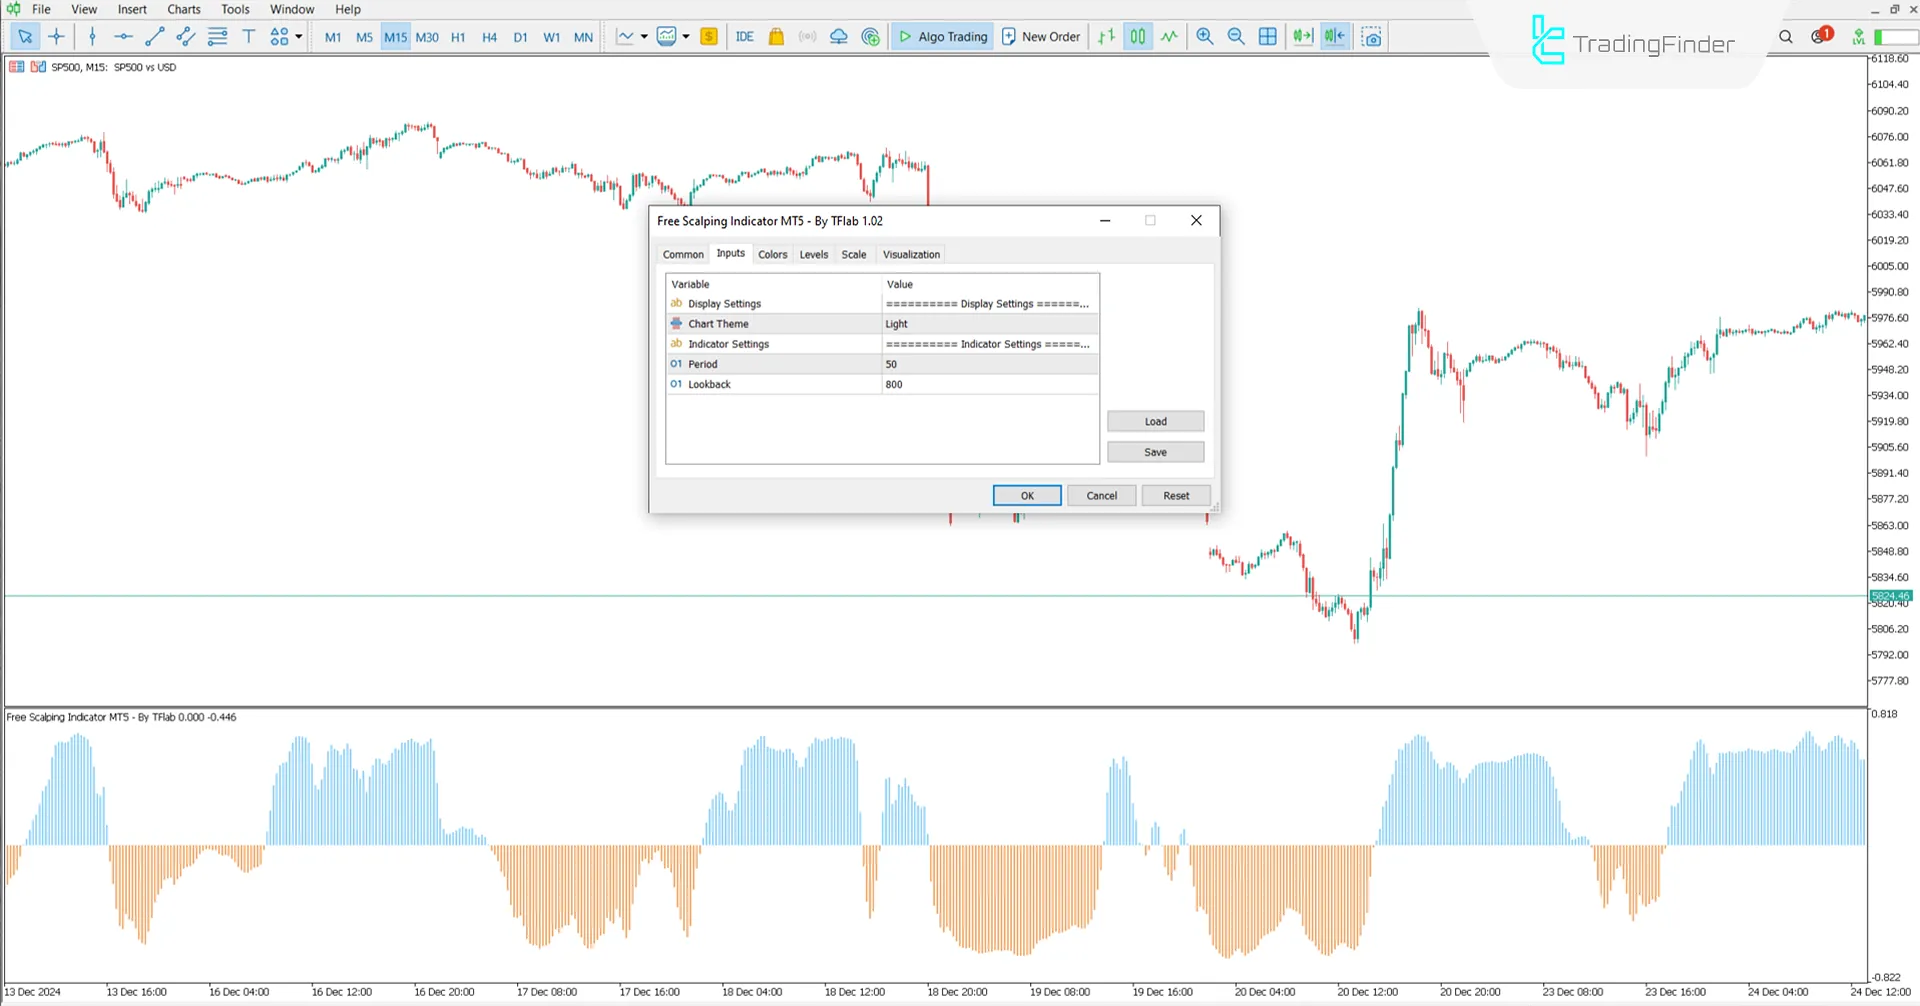
Image below showcases the customizable settings of the Free Scalping Indicator:

- Chart Theme: Chart theme settings
- Period: Candle period
- Lookback: Lookback period
Conclusion
Using histogram-based price analyses, the Free Scalping Indicator is one of the appropriate tools for determining direction and assessing trend strength in volatile markets.
In this trading tool, changes in the histogram length either increasing or decreasing indicate strengthening or weakening momentum, respectively, and can provide traders with suitable entry points.
Scalping MT5 PDF
Scalping MT5 PDF
Click to download Scalping MT5 PDFIs this indicator only applicable to short term timeframes?
Yes, this indicator is suitable for use in short term timeframes.
Does this indicator only display entry zones?
No, this indicator identifies entry zones and effectively identifies trend changes.


