![FTLM STLM Indicator in MetaTrader 5 Download – [TradingFinder]](https://cdn.tradingfinder.com/image/581673/11-102-en-ftlm-stlm-mt5-01.webp)
![FTLM STLM Indicator in MetaTrader 5 Download – [TradingFinder] 0](https://cdn.tradingfinder.com/image/581673/11-102-en-ftlm-stlm-mt5-01.webp)
![FTLM STLM Indicator in MetaTrader 5 Download – [TradingFinder] 1](https://cdn.tradingfinder.com/image/581658/11-102-en-ftlm-stlm-mt5-02.webp)
![FTLM STLM Indicator in MetaTrader 5 Download – [TradingFinder] 2](https://cdn.tradingfinder.com/image/581670/11-102-en-ftlm-stlm-mt5-03.webp)
![FTLM STLM Indicator in MetaTrader 5 Download – [TradingFinder] 3](https://cdn.tradingfinder.com/image/581669/11-102-en-ftlm-stlm-mt5-04.webp)
The FTLM STLM indicator is a practical tool for traders seeking to identify the end of corrective phases in the market.
Designed for MetaTrader 5, this indicator uses two oscillating lines (blue and red) to display overbought and oversold zones.
By recognizing the main market trend and integrating this indicator into their trading strategies, traders can anticipate the continuation of price trends and identify suitable trading opportunities.
FTLM STLM Indicator Table
The following section contains information about the FTLM STLM Indicator:
Indicator Categories: | Oscillators MT5 Indicators Currency Strength MT5 Indicators Trading Assist MT5 Indicators |
Platforms: | MetaTrader 5 Indicators |
Trading Skills: | Elementary |
Indicator Types: | Trend MT5 Indicators Lagging MT5 Indicators |
Timeframe: | Multi-Timeframe MT5 Indicators |
Trading Style: | Intraday MT5 Indicators Scalper MT5 Indicators Day Trading MT5 Indicators |
Trading Instruments: | Forex MT5 Indicators Crypto MT5 Indicators Stock MT5 Indicators Indices MT5 Indicators Share Stock MT5 Indicators |
FTLM STLM Indicator at a Glance
The FTLM STLM indicator is a specialized oscillator for detecting the end of corrective phases in price action. This indicator enables traders to identify trend reversals by analyzing the two oscillator lines.
When the blue line moves above the red line, it indicates the market has entered the overbought zone; when the blue line falls below the red line, the market is in the oversold zone.
Uptrend in the FTLM STLM Indicator
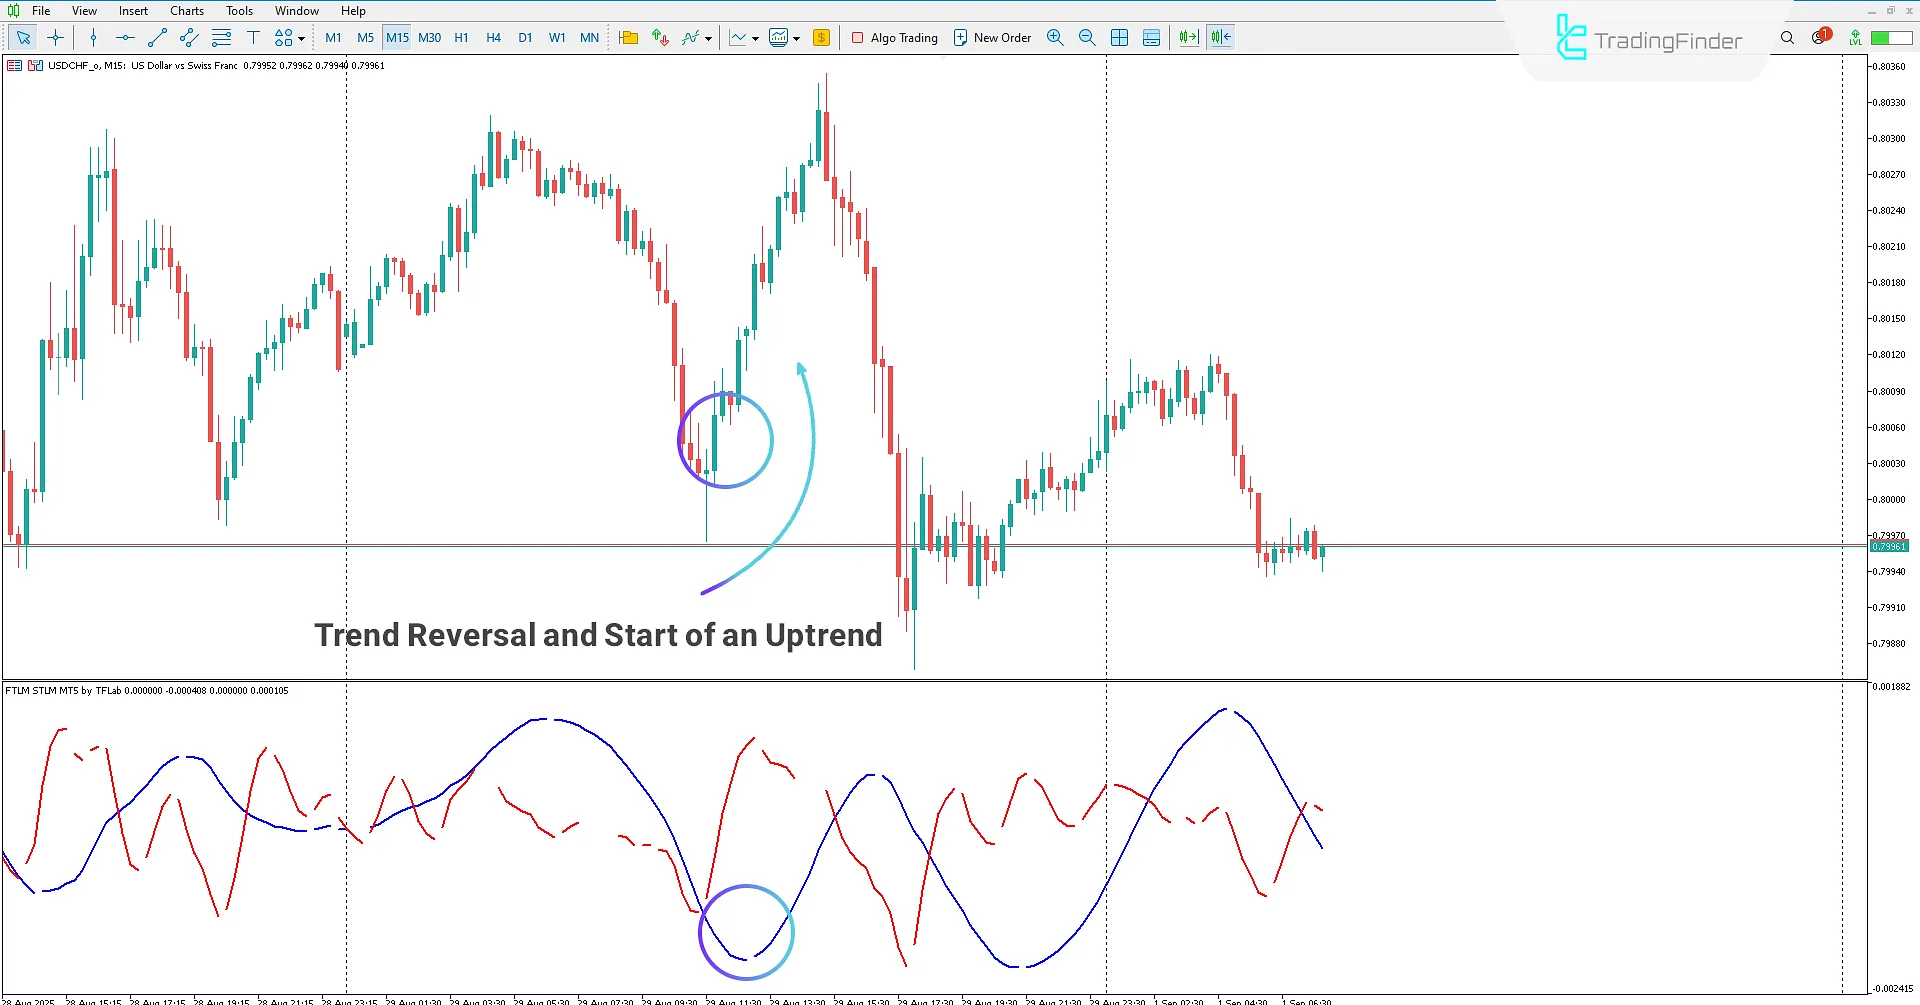
On the 15-minute USD/CHF chart, the FTLM STLM indicator is applied. When the blue line moves below the red line, it signals an oversold market condition.
Once the slope changes upward, it demonstrates a trend reversal from bearish to bullish.

Downtrend in the FTLM STLM Indicator
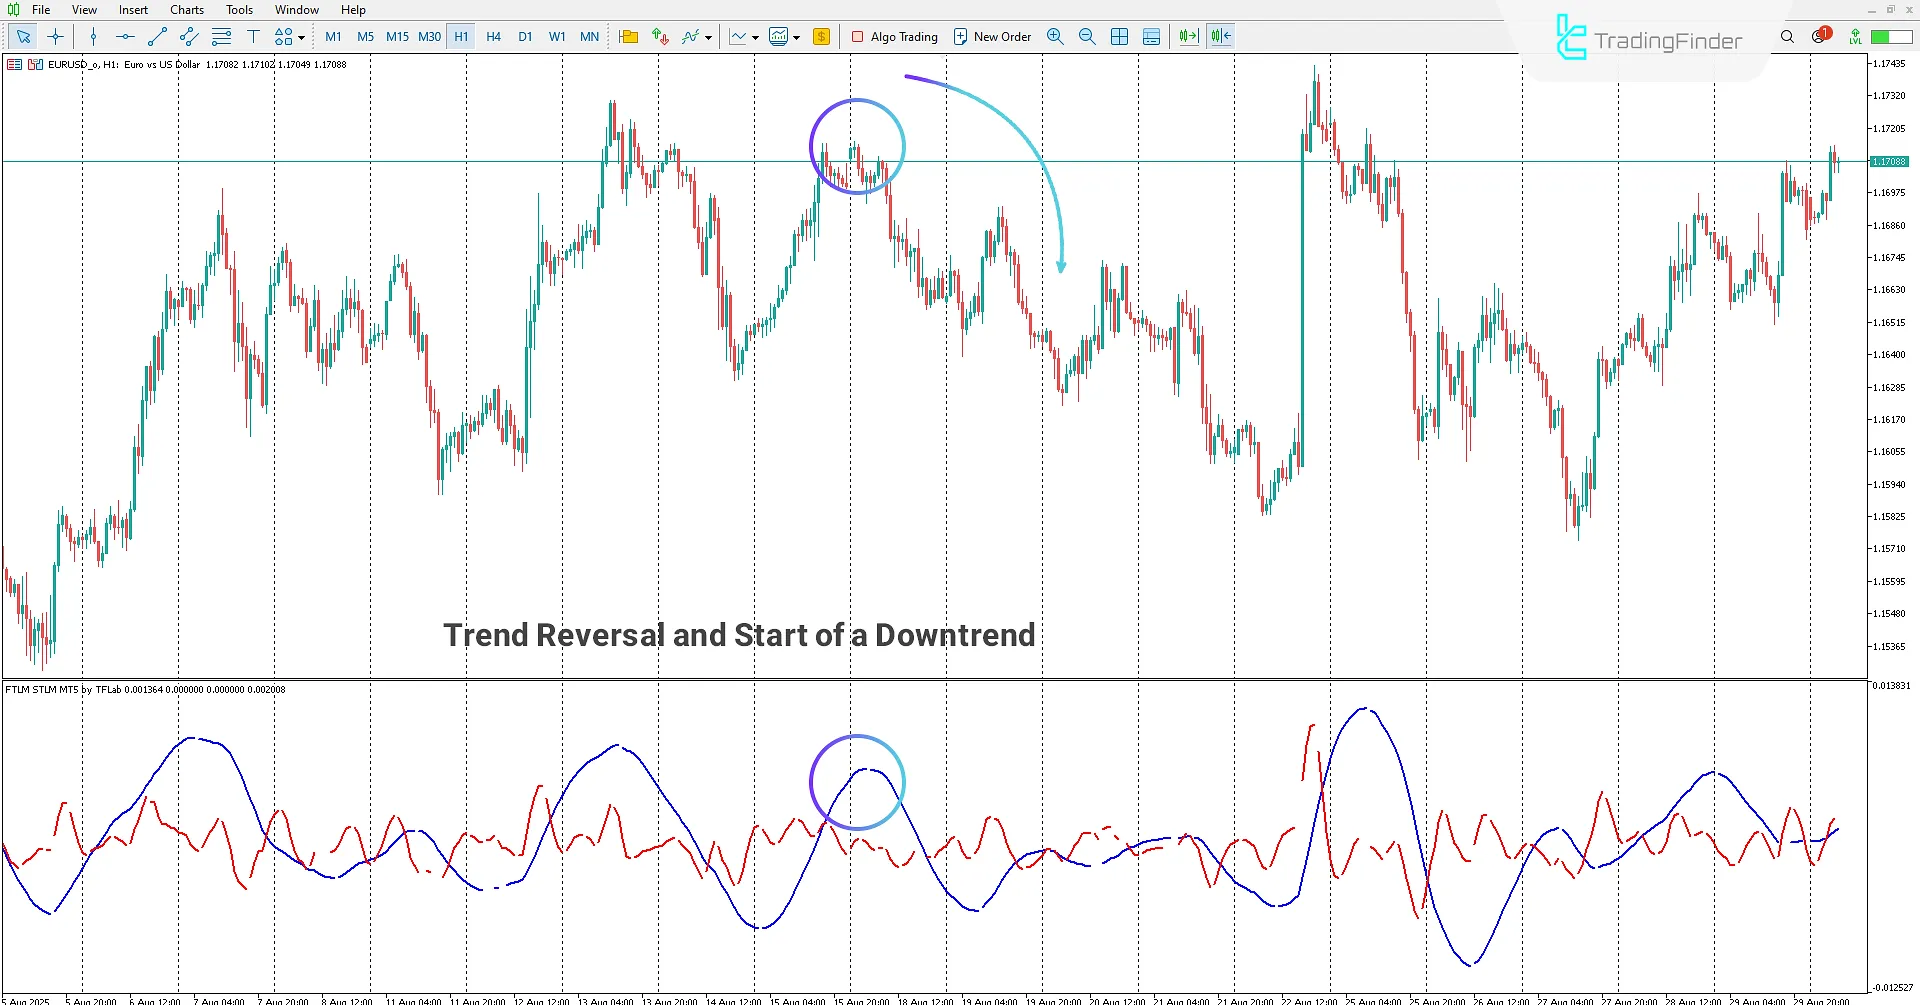
On the 1-hour EUR/USD chart, the price is in a downtrend. When the blue line is above the red line, the market is in the overbought zone.
However, if the blue line starts sloping downward, it indicates continuation of the bearish trend.
In such conditions, traders can interpret the downward slope of the blue line as a valid sell signal and enter short positions.

FTLM STLM Indicator Settings
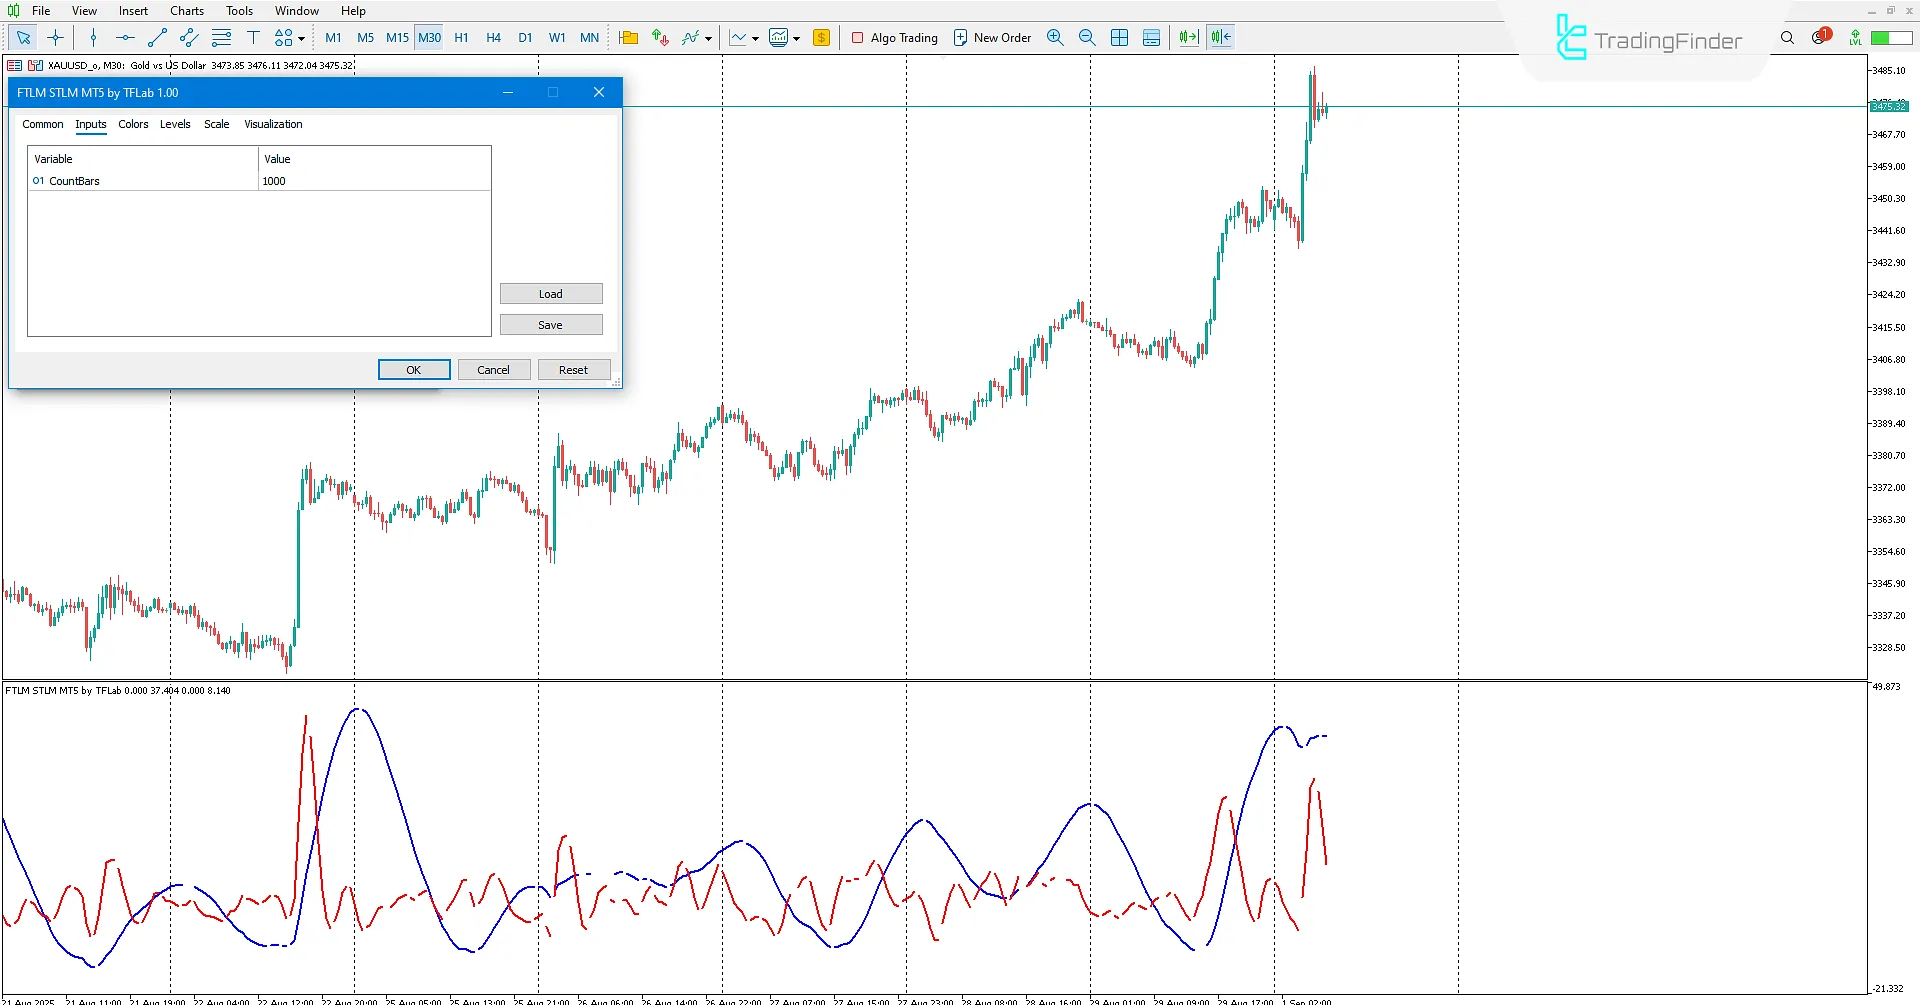
Below are the settings for the FTLM STLM Indicator:

- Count Bars: Maximum number of candlesticks for displaying the histogram on the chart.
Conclusion
The FTLM STLM indicator is a practical oscillator for detecting market trend reversals. By combining technical analysis with the two oscillator lines, traders can identify overbought and oversold zones and anticipate directional changes.
The indicator consists of two oscillator lines: when the blue line is above the red line, the market is in the overbought zone. If the blue line slopes downward, it signals the beginning of a bearish trend.
Conversely, when the blue line moves below the red line, the market is in the oversold zone, and an upward slope signals the start of a bullish trend.
FTLM STLM Indicator in MetaTrader 5 PDF
FTLM STLM Indicator in MetaTrader 5 PDF
Click to download FTLM STLM Indicator in MetaTrader 5 PDFWhat is the FTLM STLM Indicator?
It is a practical tool in MetaTrader 5 used for detecting the end of corrective phases and identifying trend reversals in the market.
What is the role of the blue and red oscillator lines?
- When the blue line is above the red line, the market is in the overbought zone;
- When the blue line is below the red line, the market is in the oversold zone.


