


The FTLM STLM Histogram Indicator is a specialized tool for technical analysts on the MetaTrader 5 platform, designed to identify the end of price corrections and the return to the market’s main trend.
This indicator plots a momentum histogram and uses an oscillator line to show market direction changes.
When the color changes from red to green, it signals the start of a bullish trend; when it changes from green to red, it signals the start of a bearish trend.
FTLM STLM Histogram Indicator Table
Below are the details of the FTLM STLM Histogram Indicator:
Indicator Categories: | Oscillators MT5 Indicators Currency Strength MT5 Indicators Trading Assist MT5 Indicators |
Platforms: | MetaTrader 5 Indicators |
Trading Skills: | Elementary |
Indicator Types: | Trend MT5 Indicators Lagging MT5 Indicators |
Timeframe: | Multi-Timeframe MT5 Indicators |
Trading Style: | Intraday MT5 Indicators Scalper MT5 Indicators Day Trading MT5 Indicators |
Trading Instruments: | Forex MT5 Indicators Crypto MT5 Indicators Stock MT5 Indicators Indices MT5 Indicators Share Stock MT5 Indicators |
Indicator at a glance
The FTLM STLM Histogram Indicator, by plotting colored histograms (red and green), displays the strength and direction of both positive and negative momentum.
With this tool, traders can, within their trading strategy, identify the main market trend and detect the continuation of movement in the direction of the dominant trend at the end of corrective phases, allowing them to enter buy or sell positions.
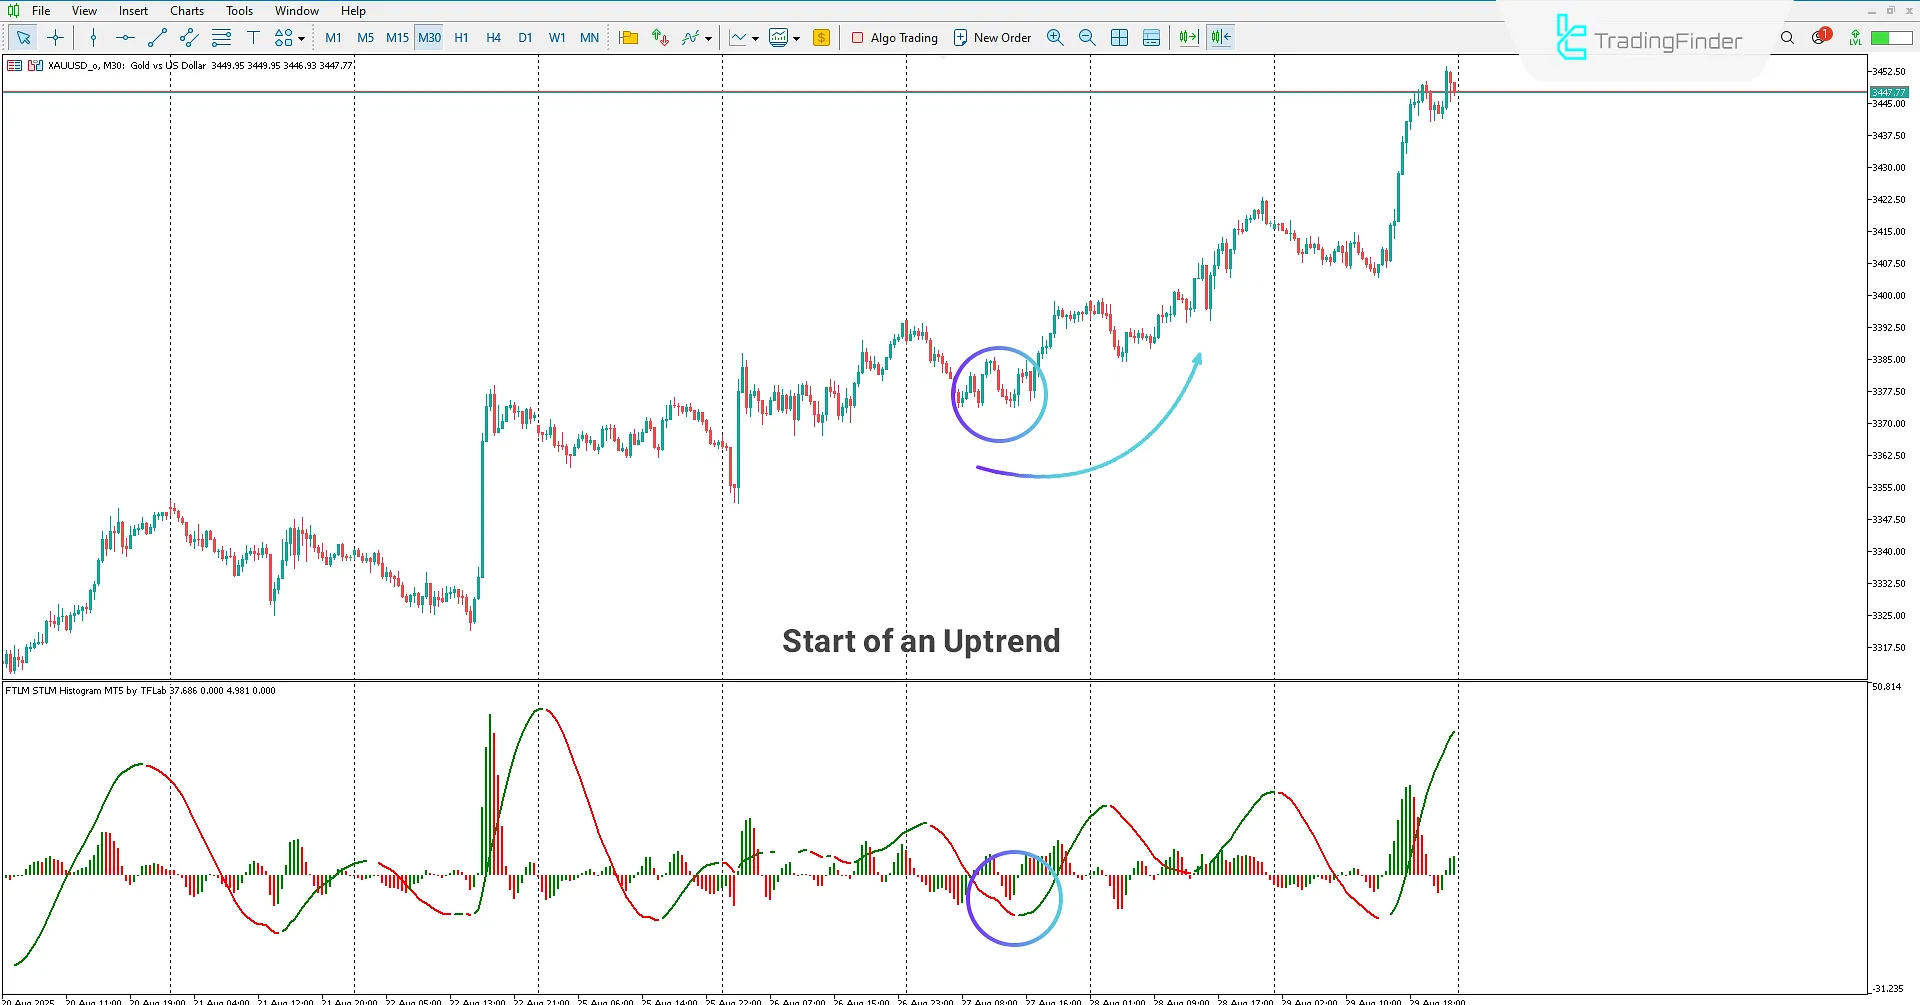
Bullish Trend
On the 30-minute gold chart, the FTLM STLM Histogram Indicator is applied.
Traders can analyze the bullish trend and, with the histogram and oscillator line, identify the end of a bearish correction and the start of price returning to the main uptrend.
In such situations, a color change in the oscillator line from red to green confirms the continuation of the bullish trend and provides a favorable buy signal.
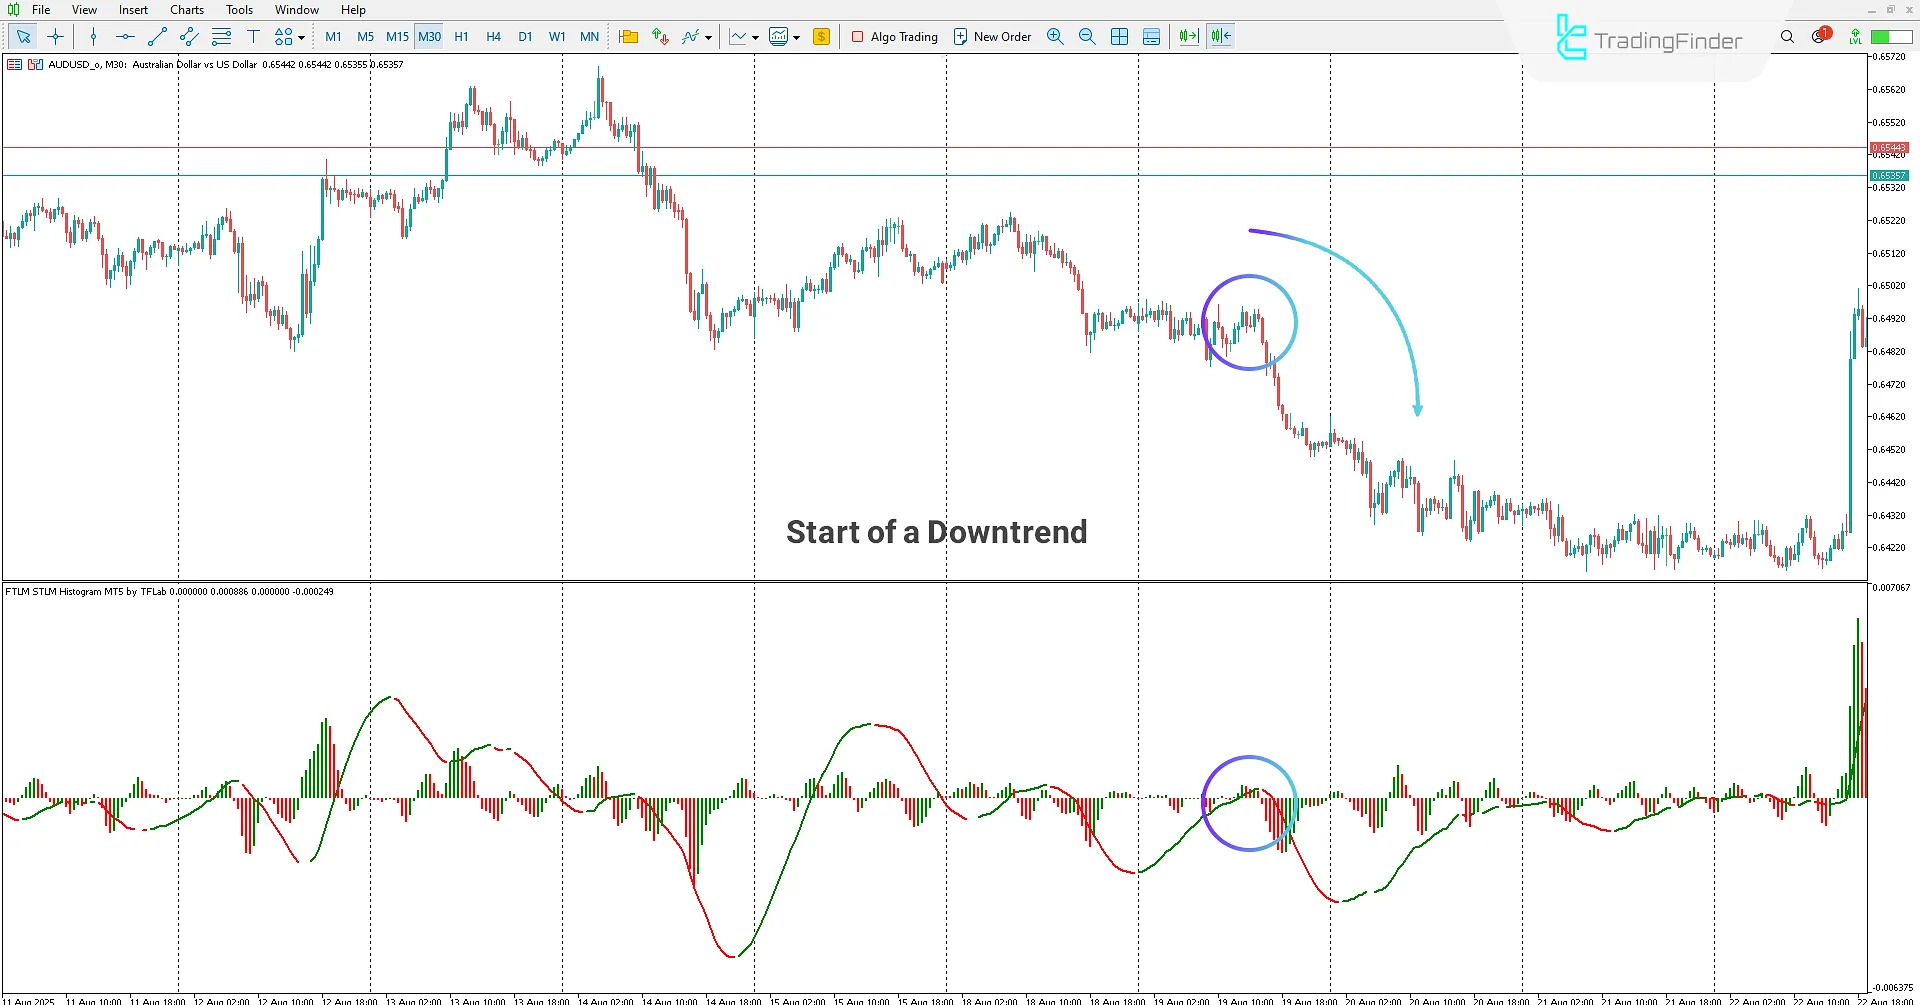
Bearish Trend
On the 30-minute AUDUSD chart, traders can apply the FTLM STLM Histogram Indicator and, by analyzing the main trend, assess momentum and identify the end of corrective price movements.
In this chart, the market is in a bearish trend. When the oscillator line changes from green to red, it signals the end of a bullish correction and the market’s return to the downtrend.
Additionally, the histogram values allow traders to assess momentum strength and trend intensity.
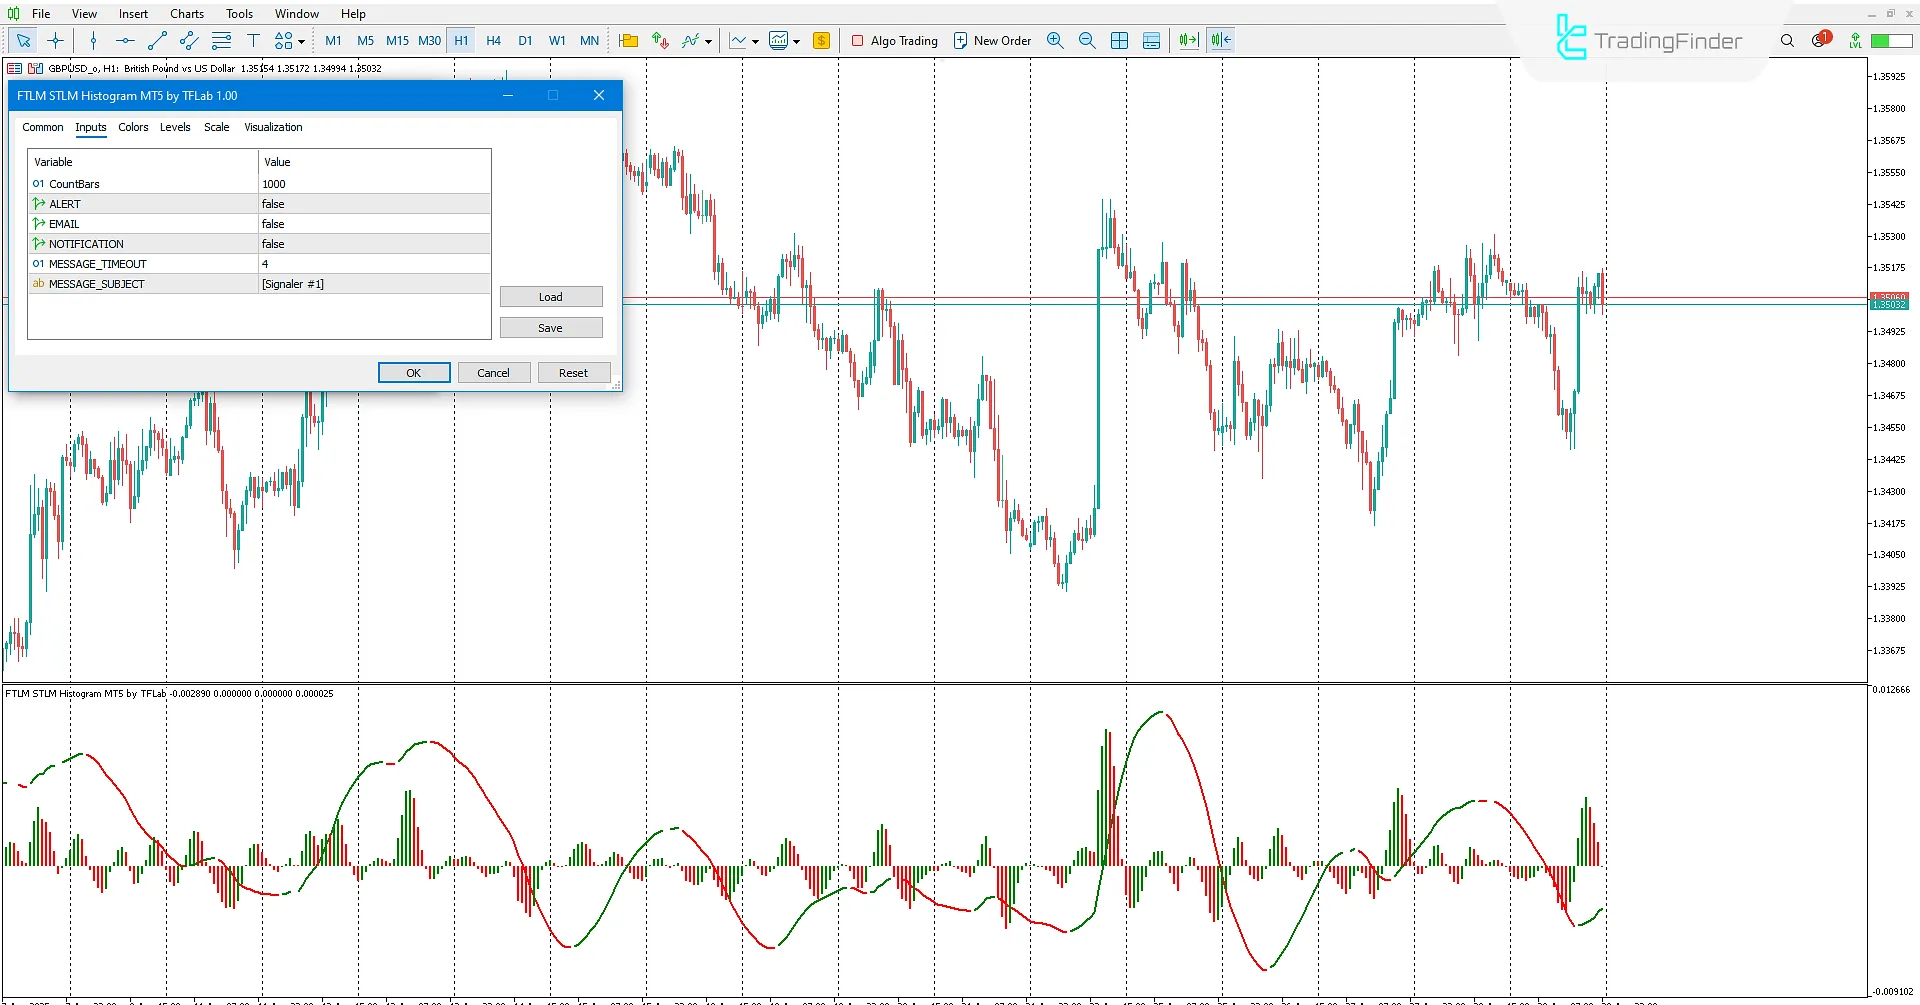
FTLM STLM Histogram Indicator Settings
Below are the FTLM STLM Histogram Indicator settings:
- Count Bars: Set the maximum number of candles to display the histogram on the chart;
- ALERT: Enable/disable alerts when the oscillator line changes trend;
- EMAIL: Enable/disable sending alerts to the mailbox when the oscillator line changes trend;
- NOTIFICATION: Enable/disable sending alerts as notifications to mobile devices when the oscillator line changes trend;
- MESSAGE_TIMEOUT: Set the time interval between alert messages;
- MESSAGE_SUBJECT: Define the alert subject or custom message.
Conclusion
The FTLM STLM Histogram Indicator is a histogram tool that shows the level of momentum and the strength of both bullish and bearish trends, allowing traders to analyze price movements step by step.
This indicator provides an oscillator line that identifies the end of corrective movements by color changes: from green to red when the trend shifts from bullish to bearish, and from red to green when the trend shifts from bearish to bullish.
Traders can use these color changes as entry signals in the direction of the main trend.
FTLM STLM Histogram Indicator in MetaTrader 5 PDF
FTLM STLM Histogram Indicator in MetaTrader 5 PDF
Click to download FTLM STLM Histogram Indicator in MetaTrader 5 PDFWhat is the FTLM STLM Histogram Indicator?
A specialized tool for technical traders in MetaTrader 5, designed to identify the end of corrective price movements and the return to the main market trend.
How does the FTLM STLM Histogram Indicator display market trends?
By plotting a momentum histogram and using an oscillator line, it shows market direction changes: from red to green for the start of bullish trends, and from green to red for the start of bearish trends.


