![FTLM STLM Momentum Indicator for MT5 – Free – [Trading Finder]](https://cdn.tradingfinder.com/image/405898/2-75-en-ftlm-stlm-mt5-1.webp)
![FTLM STLM Momentum Indicator for MT5 – Free – [Trading Finder] 0](https://cdn.tradingfinder.com/image/405898/2-75-en-ftlm-stlm-mt5-1.webp)
![FTLM STLM Momentum Indicator for MT5 – Free – [Trading Finder] 1](https://cdn.tradingfinder.com/image/405899/2-75-en-ftlm-stlm-mt5-2.webp)
![FTLM STLM Momentum Indicator for MT5 – Free – [Trading Finder] 2](https://cdn.tradingfinder.com/image/405900/2-75-en-ftlm-stlm-mt5-3.webp)
![FTLM STLM Momentum Indicator for MT5 – Free – [Trading Finder] 3](https://cdn.tradingfinder.com/image/405901/2-75-en-ftlm-stlm-mt5-4.webp)
FTLM STLM indicator is a price momentum analysis tool that can assess trend strength and detect reversal points in financial markets such as forex and cryptocurrencies. This tool consists of two key components:
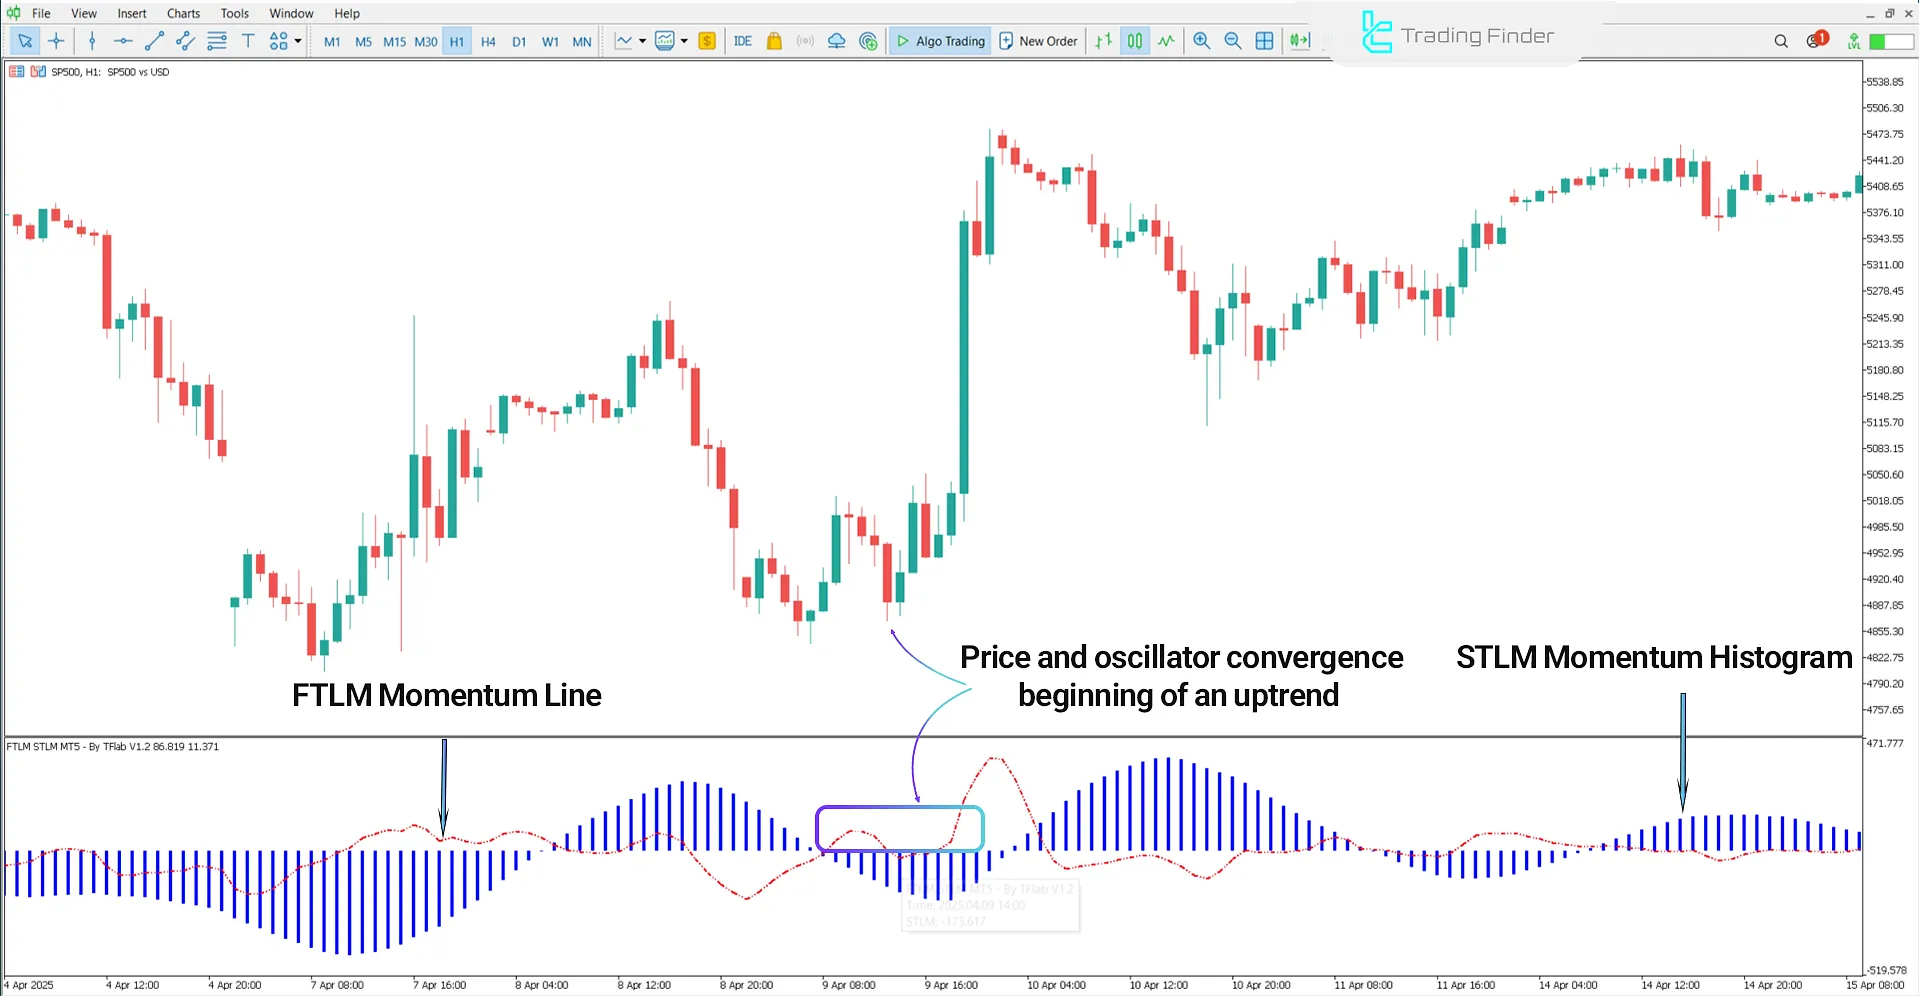
STLM (Slow Trend Line Momentum) is displayed as blue histogram bars and represents the market's long-term or more stable trend. FTLM (Fast Trend Line Momentum) is drawn as a red oscillating line over the indicator window, tracking faster momentum changes.
FTLM STLM Momentum Indicator Table
The details of the FTLM STLM Composite Momentum Indicator are shown in the table below.
Indicator Categories: | Oscillators MT5 Indicators Volatility MT5 Indicators Currency Strength MT5 Indicators |
Platforms: | MetaTrader 5 Indicators |
Trading Skills: | Intermediate |
Indicator Types: | Reversal MT5 Indicators |
Timeframe: | Multi-Timeframe MT5 Indicators |
Trading Style: | Intraday MT5 Indicators |
Trading Instruments: | Forex MT5 Indicators Crypto MT5 Indicators Stock MT5 Indicators Forward MT5 Indicators |
Indicator Overview
The FTLM STLM Momentum Indicator issues entry and exit signals by analyzing the relationship between FTLM and STLM:
When the FTLM line moves above the STLM, it signals strengthening bullish momentum and increases the likelihood of a buy setup. In a downtrend, the opposite condition occurs.
Uptrend Conditions
The following image shows the S&P 500 index chart on a 1-hour timeframe. A bullish crossover occurs when the FTLM line crosses above the STLM line from below, strengthening bullish momentum.
At the same time, the appearance of the first blue bar on the histogram confirms a buy signal.

Downtrend Conditions
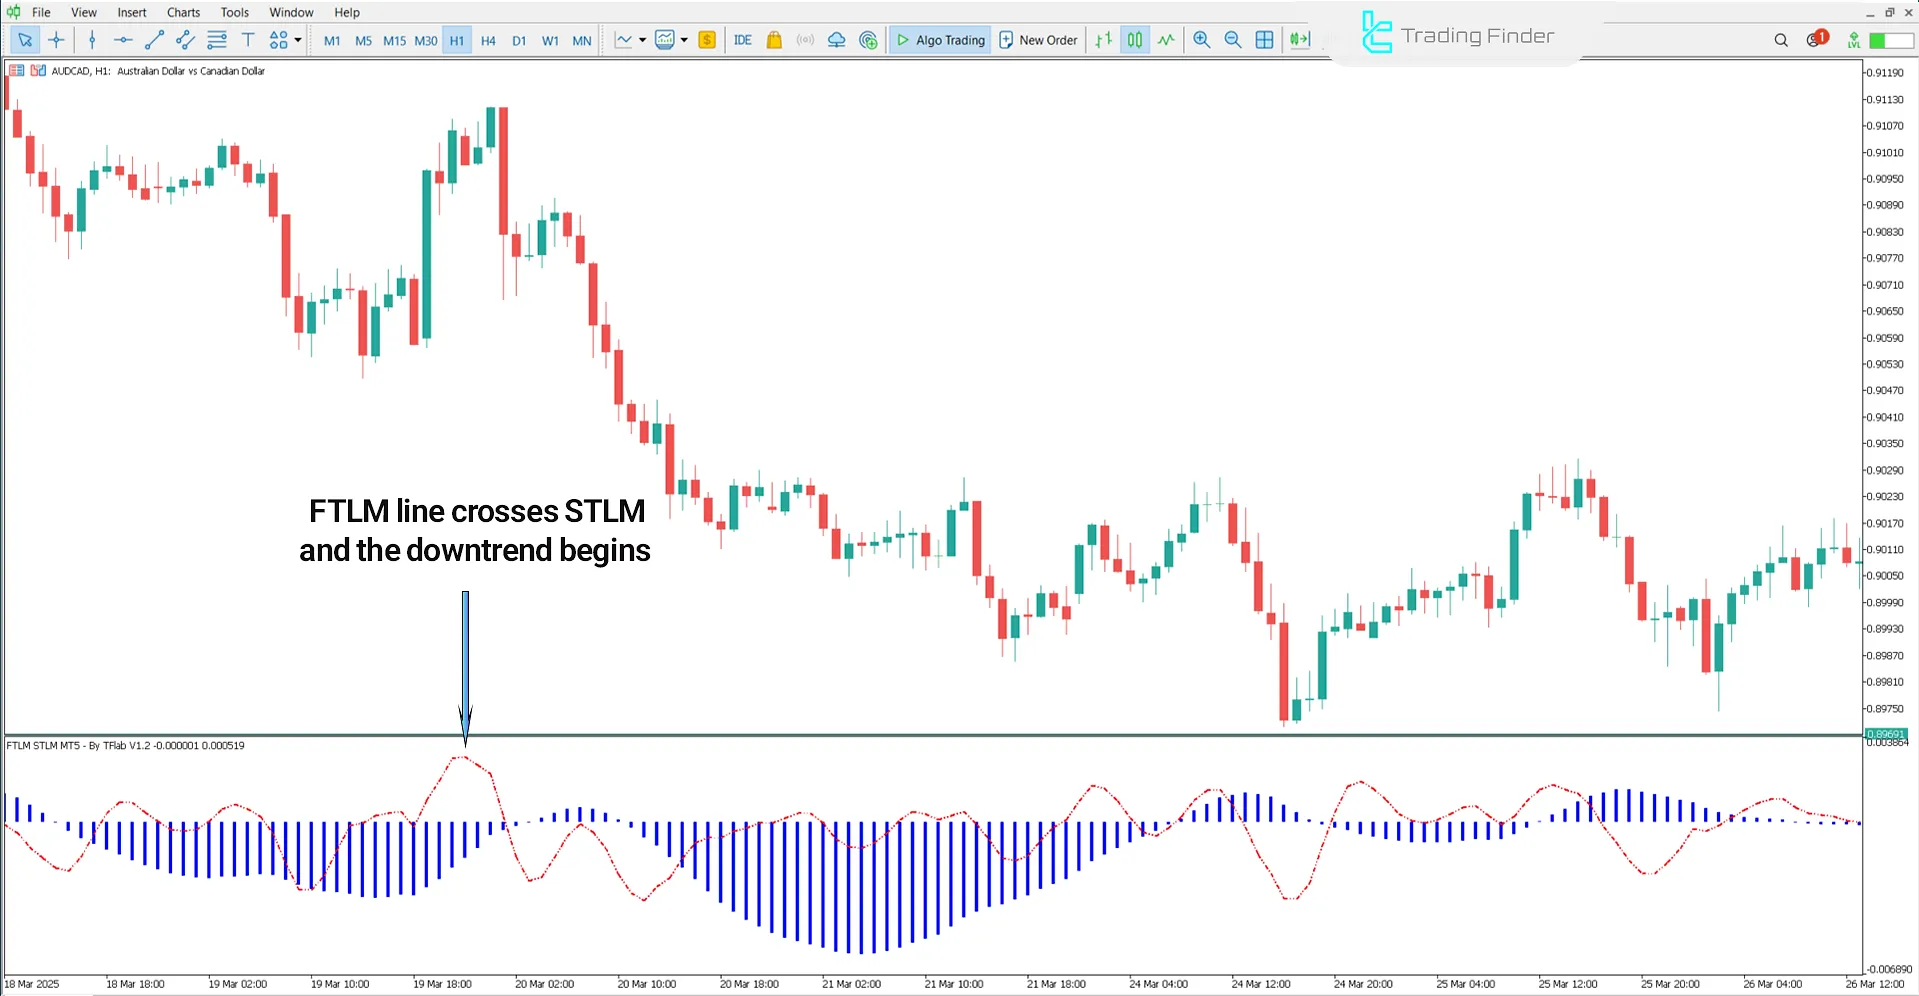
The chart below displays the AUD/CAD currency pair on a 1-hour timeframe. A downward move of the FTLM line toward the STLM from the upper region indicates the start of bearish momentum and a trend reversal; thus, a sell entry zone is considered.

FTLM STLM Indicator Settings
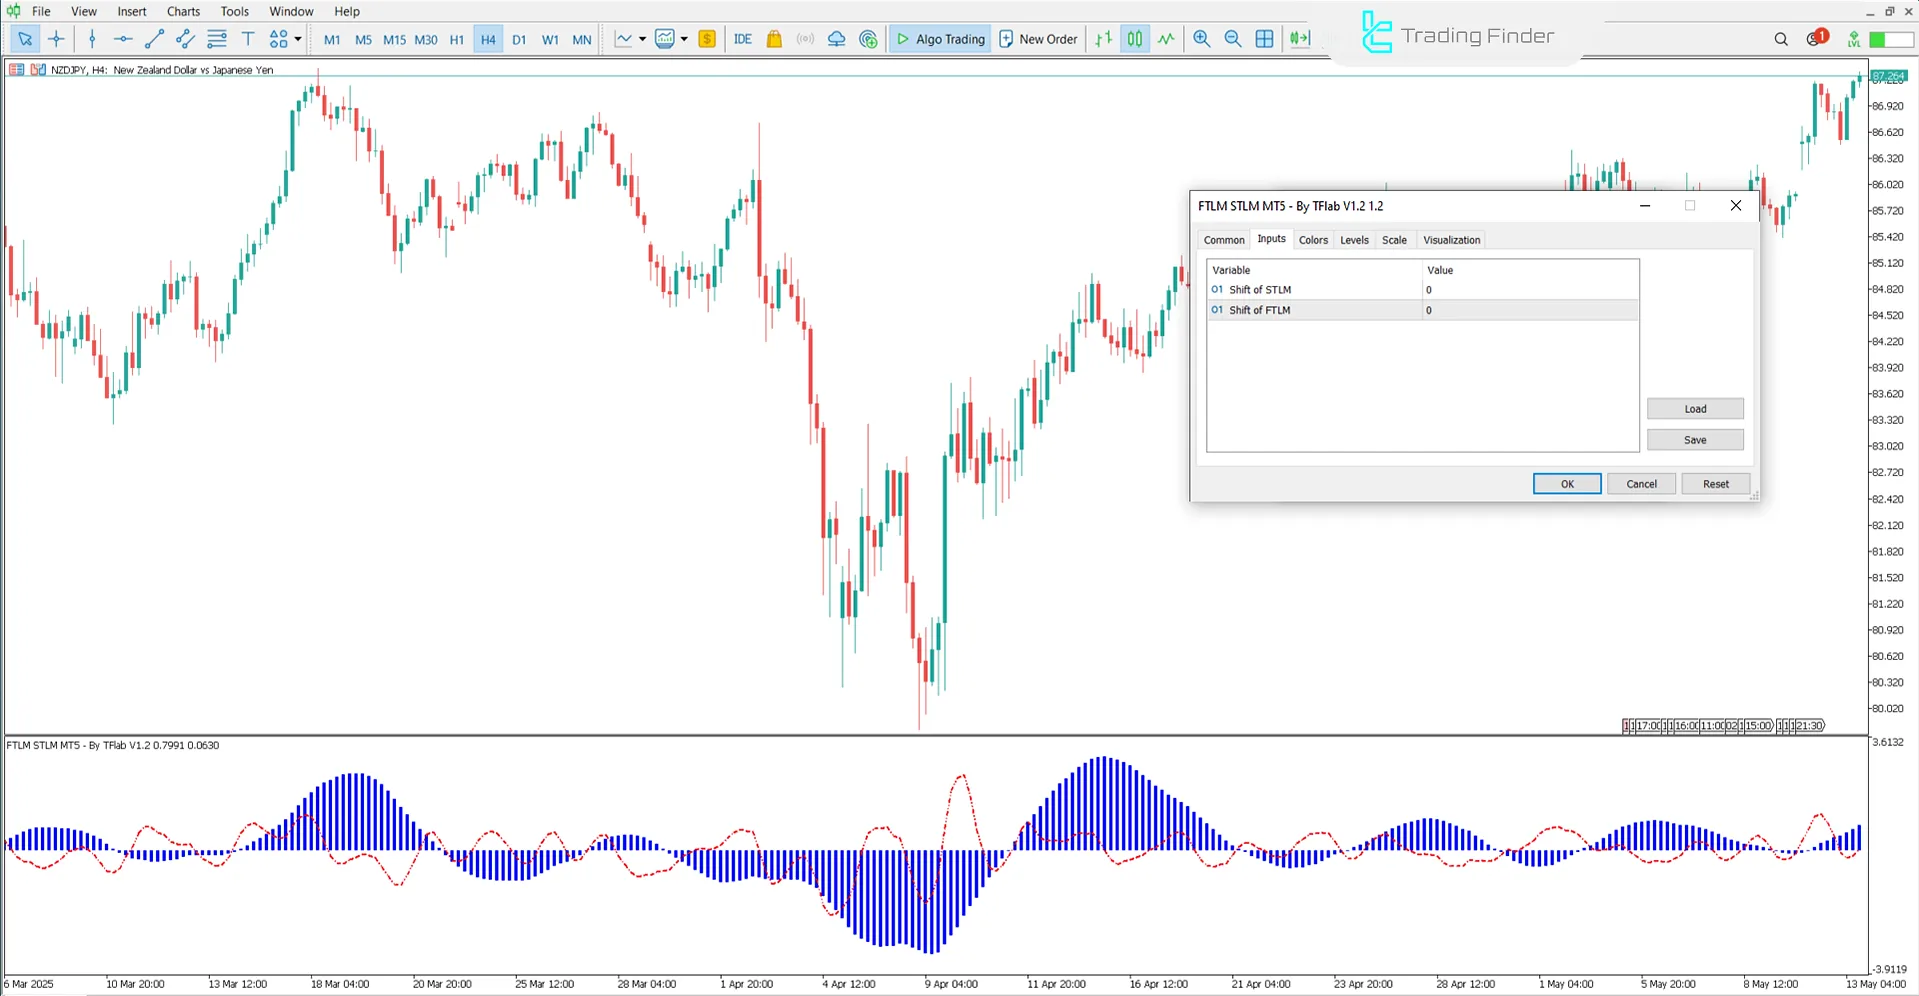
The settings panel for the FTLM STLM Indicator is shown in the image below:

- Shift of STLM: Displacement of STLM
- Shift of FTLM: Displacement of FTLM
Conclusion
The FTLM STLM indicator is a technical analysis tool based on momentum. It combines two momentum parameters—fast (FTLM) and slow (STLM)—to help detect trend strength and potential reversals.
In this indicator, STLM reflects long-term market momentum, while FTLM displays short-term momentum.
FTLM STLM Momentum MT5 PDF
FTLM STLM Momentum MT5 PDF
Click to download FTLM STLM Momentum MT5 PDFCan the FTLM STLM Indicator be combined with other indicators?
Combining it with tools such as moving averages, price action, or RSI can significantly enhance signal accuracy.
What is the difference between FTLM and STLM momentum in this indicator?
In this indicator, FTLM represents the fast trend line momentum, which is more sensitive to price changes.


