![Fair Value Gap intraday Sessions ICT Indicator MT5 Download - [TFlab]](https://cdn.tradingfinder.com/image/256910/4-16-en-fvg-sessions-mt5-1.webp)
![Fair Value Gap intraday Sessions ICT Indicator MT5 Download - [TFlab] 0](https://cdn.tradingfinder.com/image/256910/4-16-en-fvg-sessions-mt5-1.webp)
![Fair Value Gap intraday Sessions ICT Indicator MT5 Download - [TFlab] 1](https://cdn.tradingfinder.com/image/256923/4-16-en-fvg-sessions-mt5-2.webp)
![Fair Value Gap intraday Sessions ICT Indicator MT5 Download - [TFlab] 2](https://cdn.tradingfinder.com/image/256922/4-16-en-fvg-sessions-mt5-3.webp)
![Fair Value Gap intraday Sessions ICT Indicator MT5 Download - [TFlab] 3](https://cdn.tradingfinder.com/image/256921/4-16-en-fvg-sessions-mt5-4.webp)
The FVG Session Intraday Indicator is designed to identify Fair Value Gaps (FVGs) in the New York, London, and Tokyo sessions. This indicator plots horizontal lines for price highs and lows during the specified sessions and marks the first FVG formed.
By detecting bullish and bearish FVG zones, traders using ICT strategies and other liquidity-based methods can analyze potential price reversals with greater accuracy.
Indicator Table
The table below outlines the features of the Fair Value Gap Session Intraday Indicator.
Indicator Categories: | Liquidity Indicators MT5 Indicators Session & KillZone MT5 Indicators ICT MT5 Indicators Sessions Indicators for MetaTrader 5 |
Platforms: | MetaTrader 5 Indicators |
Trading Skills: | Intermediate |
Indicator Types: | Reversal MT5 Indicators |
Timeframe: | Multi-Timeframe MT5 Indicators |
Trading Style: | Day Trading MT4 Indicators Intraday MT5 Indicators |
Trading Instruments: | Forex MT5 Indicators Crypto MT5 Indicators Stock MT5 Indicators Commodity MT5 Indicators Forward MT5 Indicators |
Indicator at a Glance
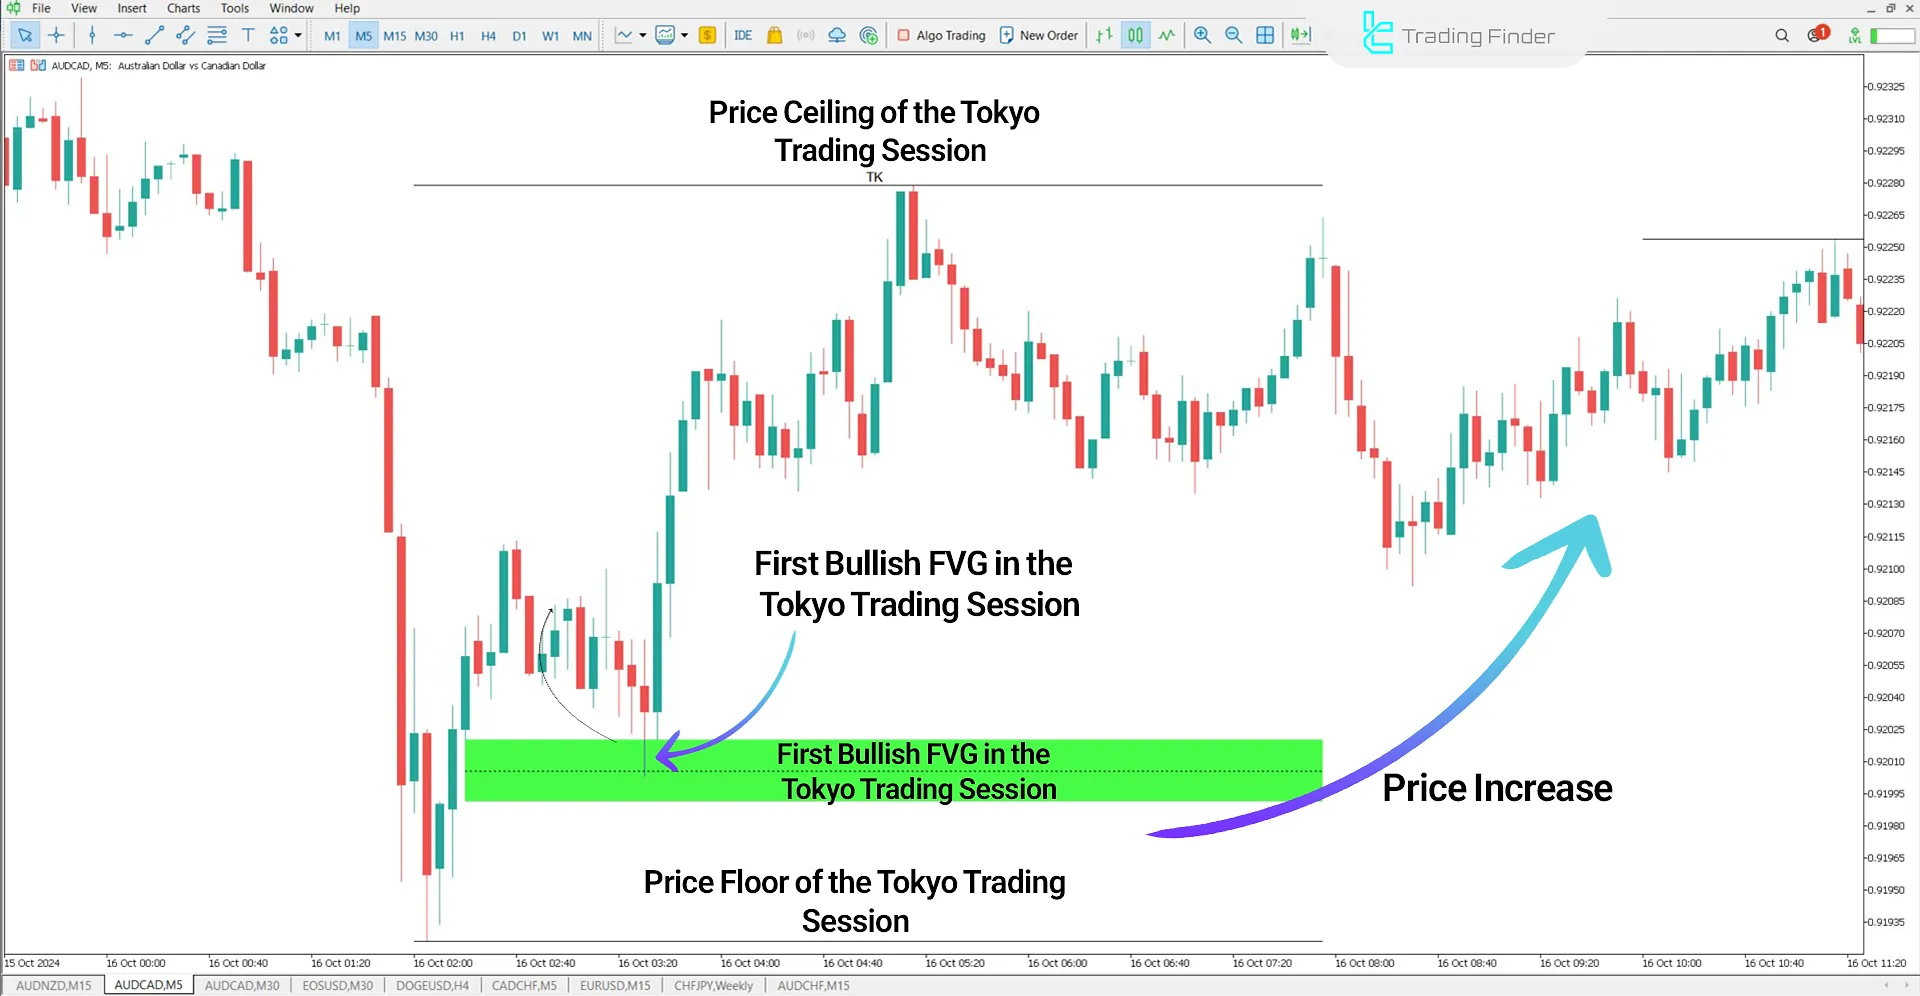
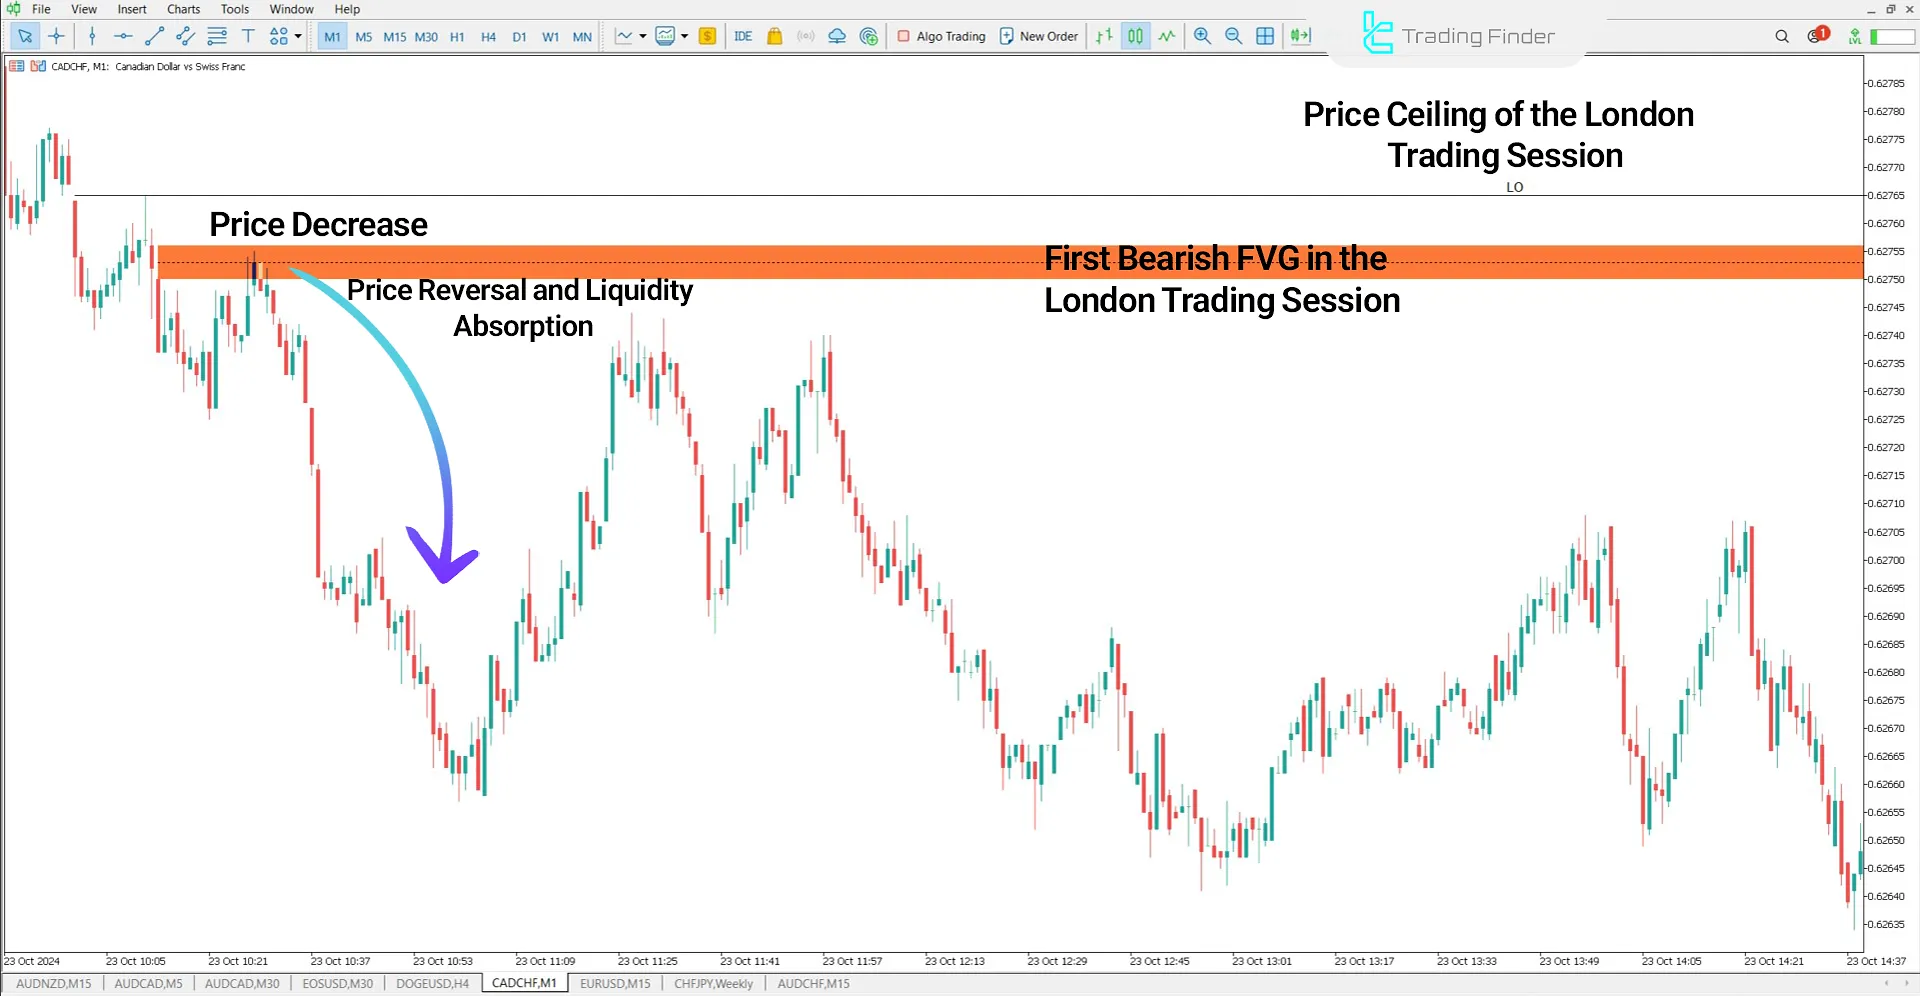
The FVG Session Intraday Indicator in MetaTrader 5 highlights bullish Fair Value Gaps in green and bearish Fair Value Gaps in red. Additionally, if these zones are broken by price, their color fades automatically, alerting traders to their validity or potential failure.
Indicator in an Uptrend
The price chart of the AUD/USD currency pair in a 15-minute uptrend is shown. During the Tokyo session, after forming a bullish FVG, the price moves upward and then retraces back to its first FVG zone to absorb liquidity.

Indicator in a Downtrend
The price chart of the CAD/CHF currency pair in a 1-minute timeframe is displayed. After forming a bearish FVG, the price retraces to this level to trigger pending orders. Traders enter sell (Sell) positions, placing their stop-loss before these zones.

Indicator Settings
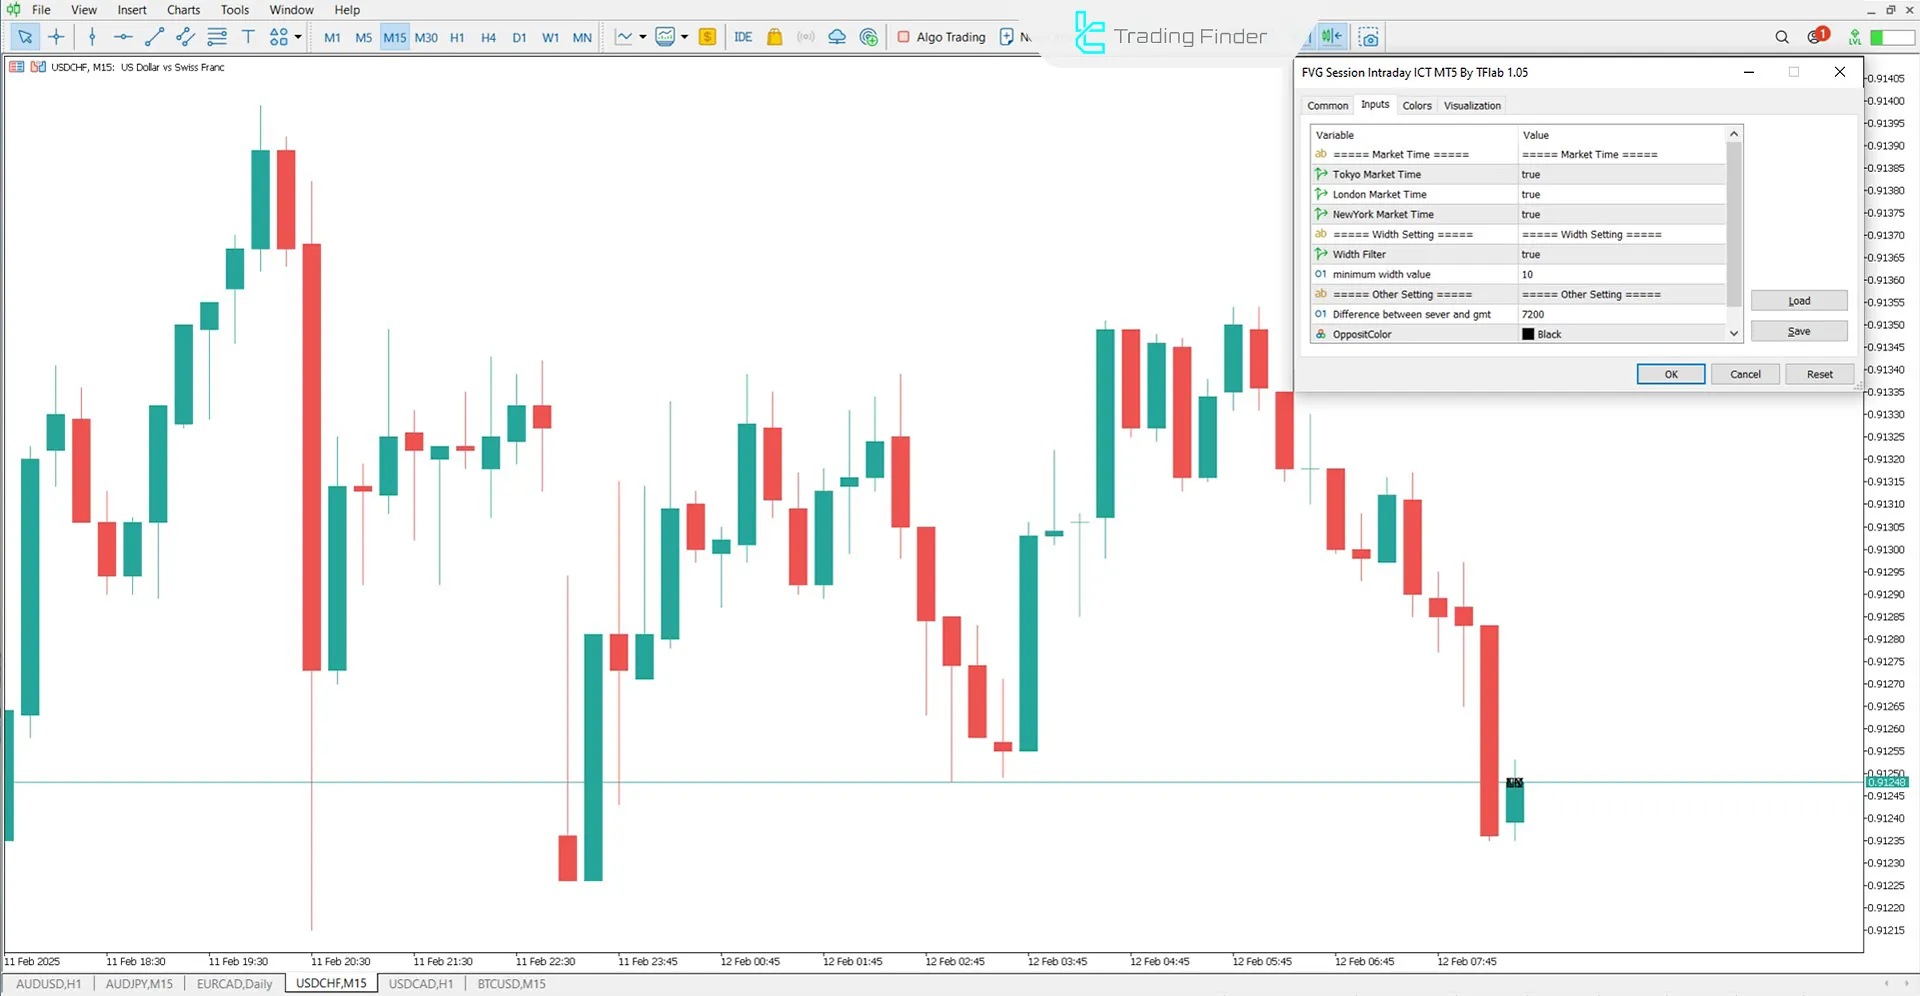
The settings section of the Fair Value Gap Session Intraday Indicator is displayed in the image below:

- Tokyo market time: Tokyo session time
- London market time: London session time
- New York market time: New York session time
- Width filter: Defines the width range
- Minimum width value: Minimum calculated width
- Difference between server and GMT: Time difference relative to GMT
Conclusion
The FVG Session Intraday Indicator is a powerful tool for MetaTrader 5, specifically designed for ICT traders and those using liquidity-based strategies.
This indicator accurately identifies and plots Fair Value Gaps (FVGs) in the New York, London, and Tokyo trading sessions, providing traders with valuable insights.
FVG intraday Sessions ICT MT5 PDF
FVG intraday Sessions ICT MT5 PDF
Click to download FVG intraday Sessions ICT MT5 PDFHow does the FVG Session Indicator display bullish and bearish gaps?
The FVG Session Indicator marks bullish FVGs in green and bearish FVGs in red.
Can this indicator be used across all timeframes?
This indicator is primarily designed for daily timeframes, but it can also be used in lower timeframes if necessary.
dear when I downloads the FG session its not coming the same whish is the same in your site
Please review the usage guide, and if the issue still persists, you can contact support through the online chat.


