![Gann Signal Indicator for MetaTrader 5 Download – Free – [TradingFinder]](https://cdn.tradingfinder.com/image/205888/2-4-en-gan-signal-mt5-1.webp)
![Gann Signal Indicator for MetaTrader 5 Download – Free – [TradingFinder] 0](https://cdn.tradingfinder.com/image/205888/2-4-en-gan-signal-mt5-1.webp)
![Gann Signal Indicator for MetaTrader 5 Download – Free – [TradingFinder] 1](https://cdn.tradingfinder.com/image/205886/2-4-en-gan-signal-mt5-2.webp)
![Gann Signal Indicator for MetaTrader 5 Download – Free – [TradingFinder] 2](https://cdn.tradingfinder.com/image/205887/2-4-en-gan-signal-mt5-3.webp)
![Gann Signal Indicator for MetaTrader 5 Download – Free – [TradingFinder] 3](https://cdn.tradingfinder.com/image/205885/2-4-en-gan-signal-mt5-4.webp)
On July 6, 2025, in version 2, alert/notification and signal functionality was added to this indicator
The Gann Signal Indicator is one of the analytical tools in technical analysis, designed based on the Gann model and built using the Williams Percent Range. This MetaTrader 5 tool identifies market trend changes and provides suitable entry points for trades.
Gann Signal Specifications Table
Table below outlines the features and specifications of the Gann Signal Indicator:
Indicator Categories: | Signal & Forecast MT5 Indicators Volatility MT5 Indicators Trading Assist MT5 Indicators |
Platforms: | MetaTrader 5 Indicators |
Trading Skills: | Intermediate |
Indicator Types: | Reversal MT5 Indicators |
Timeframe: | Multi-Timeframe MT5 Indicators |
Trading Style: | Intraday MT5 Indicators |
Trading Instruments: | Forex MT5 Indicators Crypto MT5 Indicators Stock MT5 Indicators Commodity MT5 Indicators Indices MT5 Indicators Forward MT5 Indicators Share Stock MT5 Indicators |
Introduction
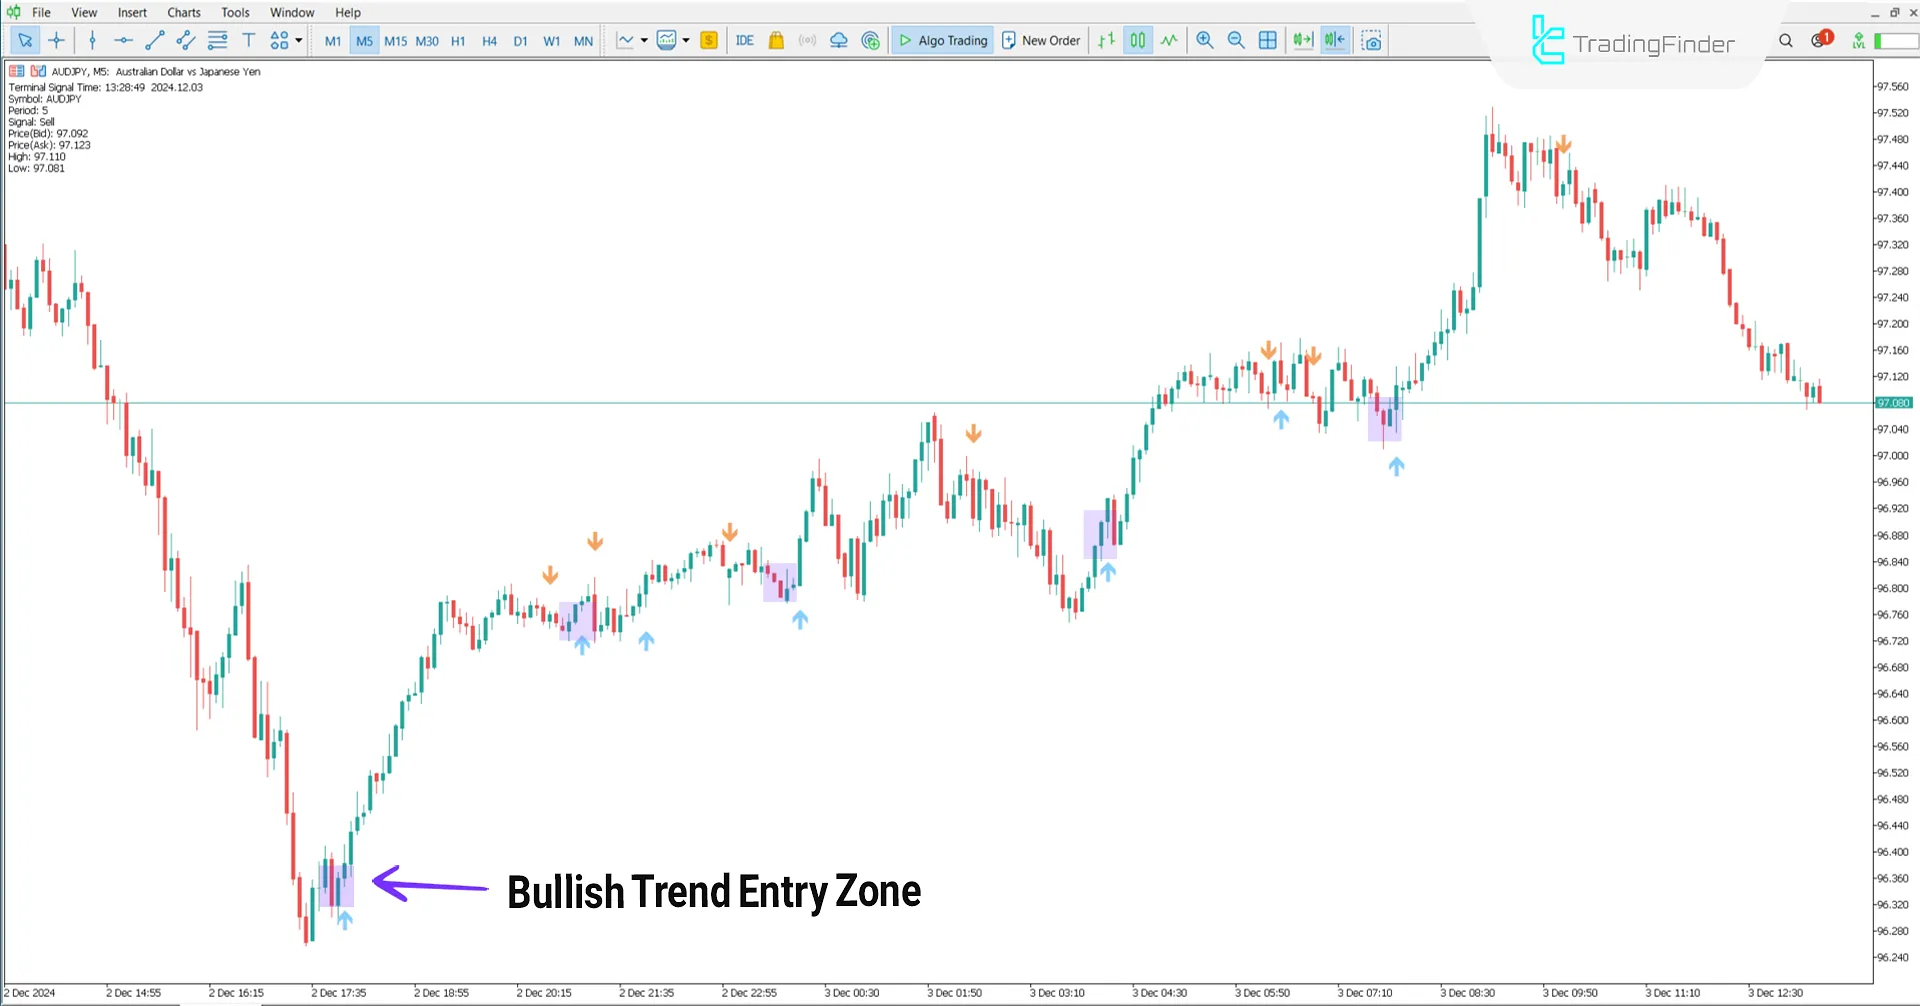
The Gann Signal Indicator is one of the analytical tools in technical analysis, designed based on the Gann model and built using the Williams Percent Range. This tool identifies market trend changes and provides suitable entry points for trades.Uptrend Conditions
The price chart below shows the AUD/JPY currency pair on a 5 minute timeframe using a MetaTrader 5 indicator.Blue arrows indicate short term or long term trend changes and entry points for trades.

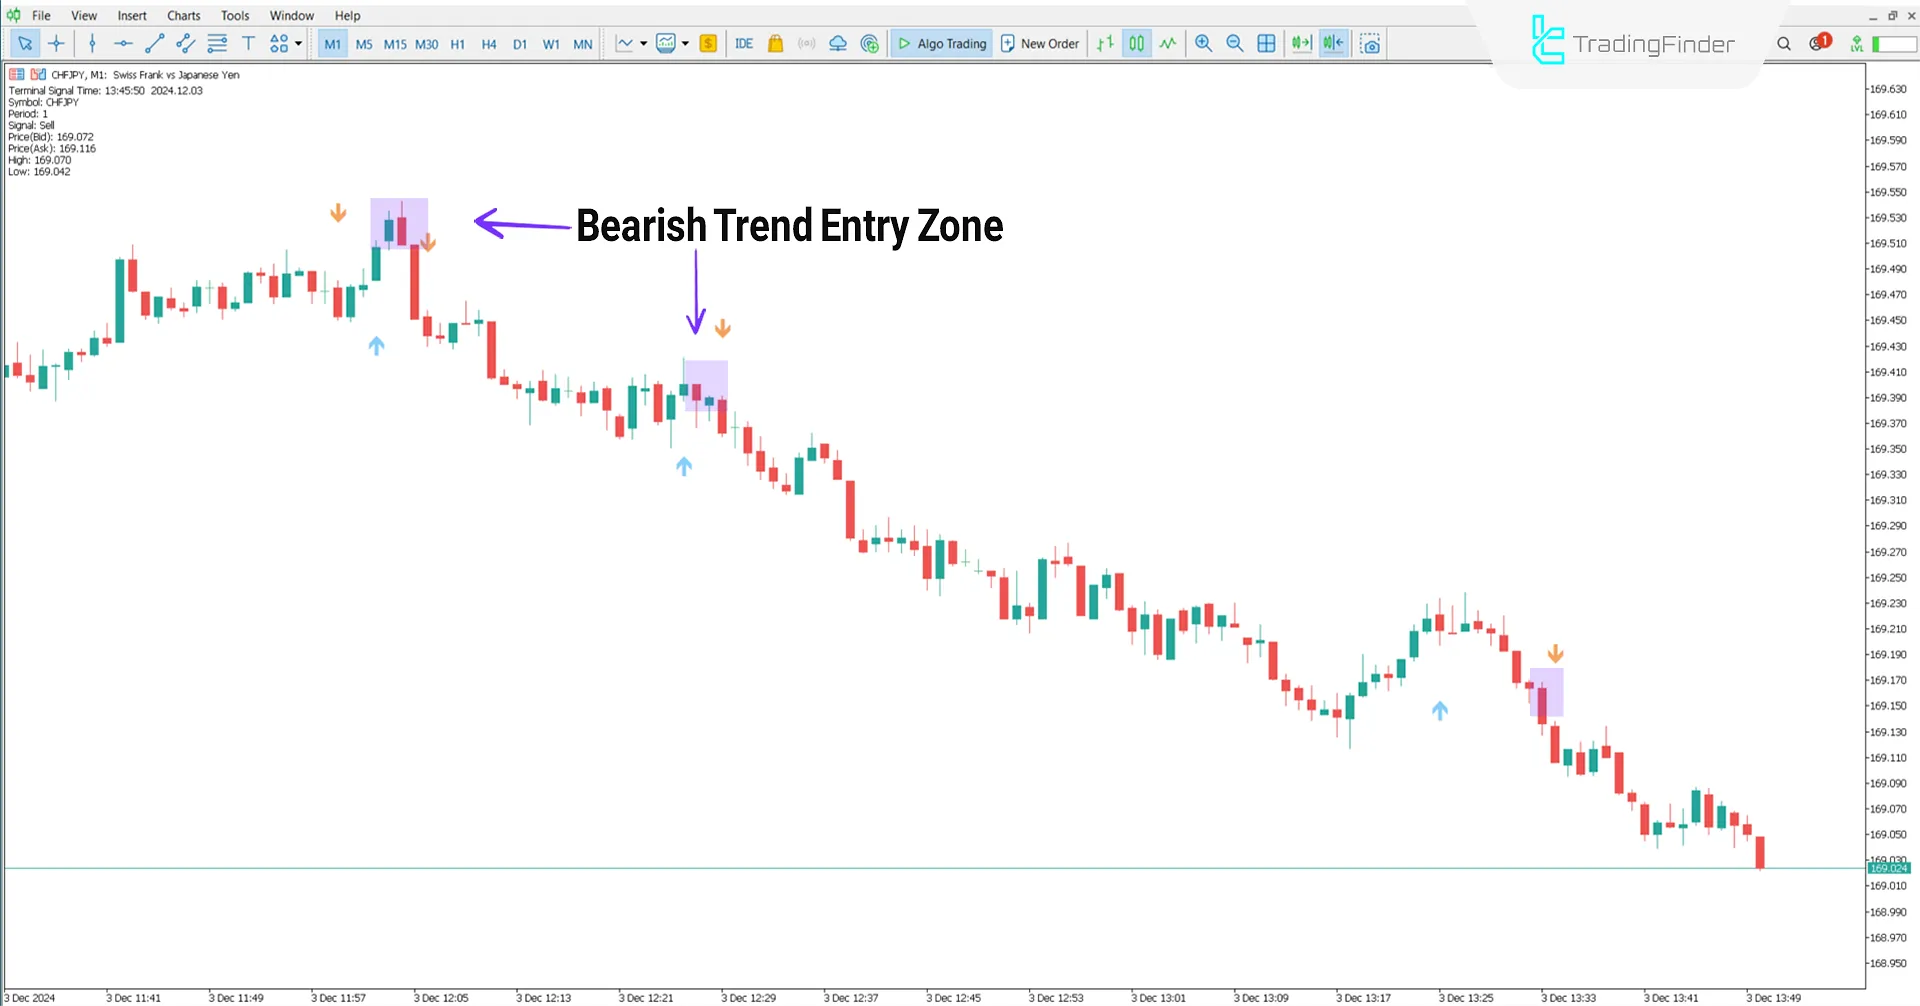
Downtrend Conditions
The price chart below illustrates the CHF/JPY currency pair on a 1 minute timeframe. Red arrows represent transitions from bullish to bearish trends, marking suitable selling points.
Thesesignals are used to identify entry points for sell trades during bearish market conditions.

Indicator Settings
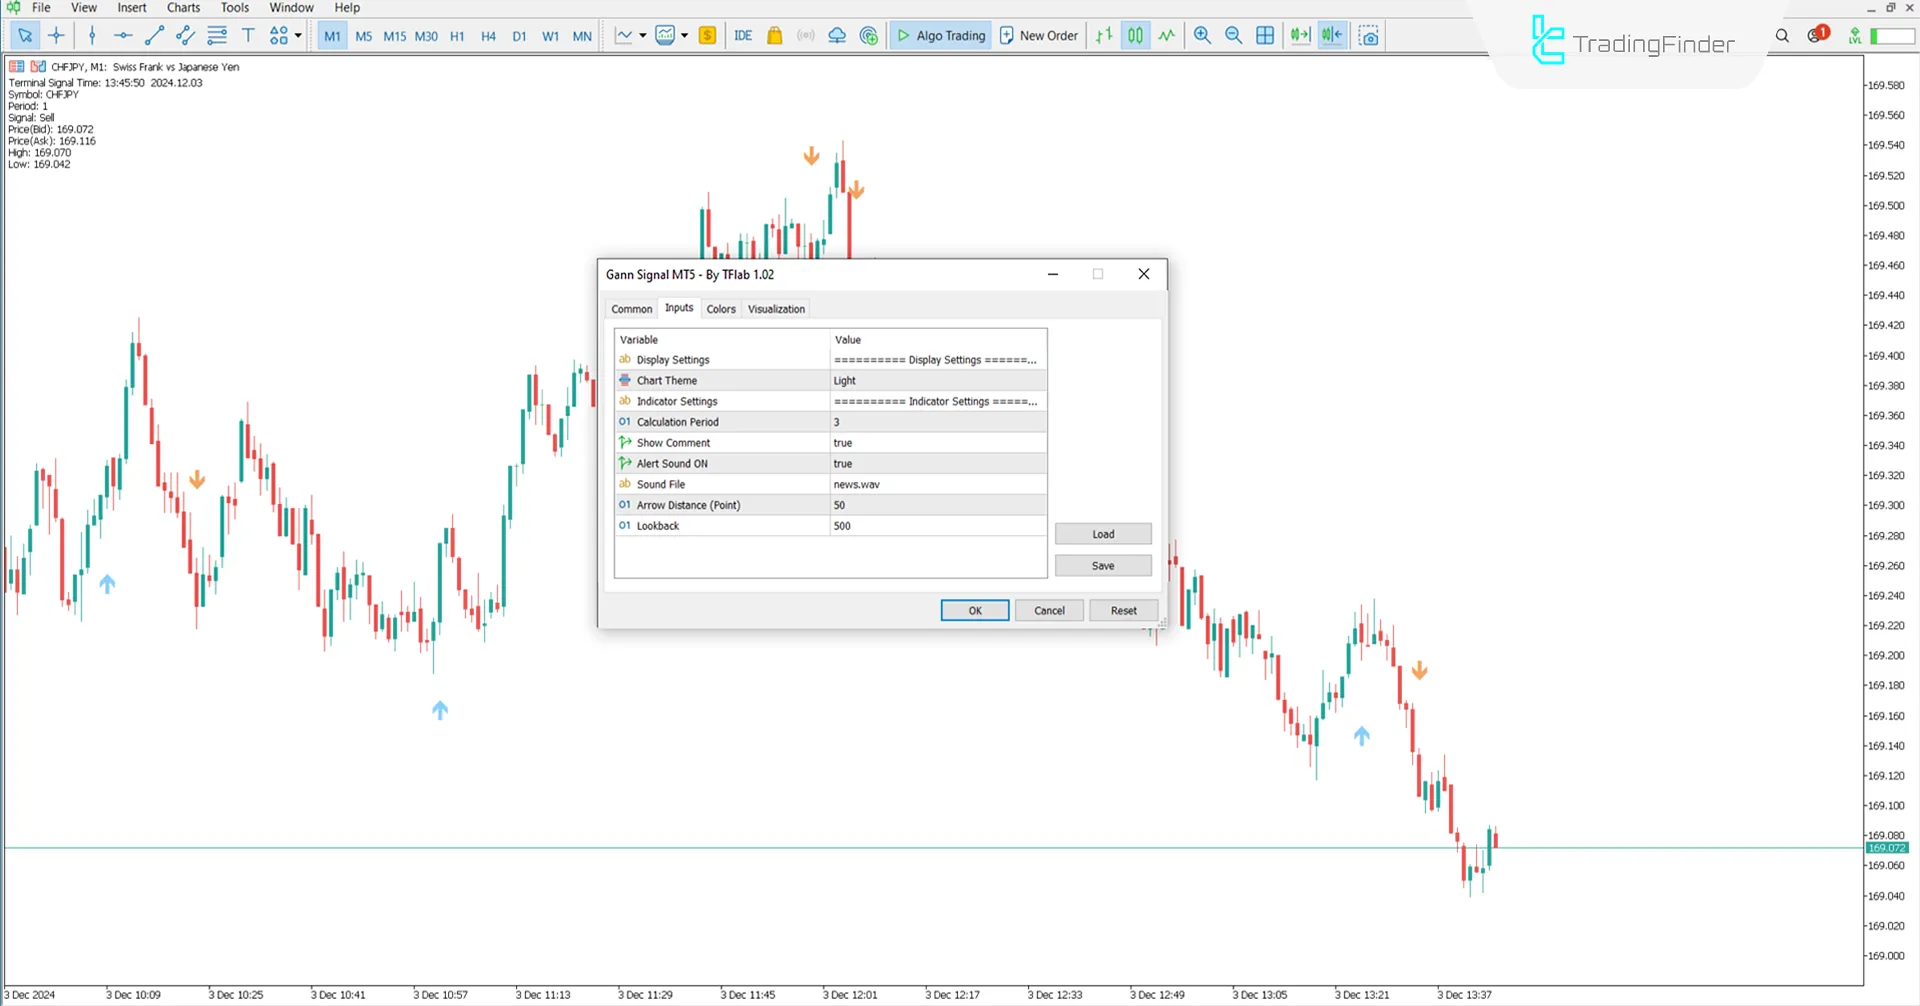
Image below displays the settings of Gann Signal Indicator in the MetaTrader 5 platform:

- Chart theme: Graph theme;
- Calculation Period: Set to 3;
- Show Comment: Notes;
- Alert Sound ON: Alert sound;
- Sound file: Sound file used;
- Arrow Distance: Set to 50;
- Lookback: Historical view range to 500.
Conclusion
The Gann Signal Indicator provides a framework for identifying bullish and bearish trends using blue and orange arrows. This MT5 Volatile indicator uses blue arrows to indicate a signal to start an uptrend and a buying opportunity.
Orange arrows indicate the beginning of a downtrend and a selling opportunity in the Trading tool.
Gann Signal MT5 PDF
Gann Signal MT5 PDF
Click to download Gann Signal MT5 PDFHow can this indicator be used for entering trades?
This tool identifies entry points for trades using blue and red arrows.
Which financial markets can this indicator be applied to?
This tool is applicable to all financial markets.


