


On July 1, 2025, in version 2, alert/notification and signal functionality was added to this indicator
The Gartley Harmonic Pattern Indicator is one of the Harmonic Pattern Indicators for MetaTrader 5 designed for traders seeking to analyze harmonic patterns and predict price reversals.
This indicator identifies specific Gartley structures based on Fibonacci ratios and key market points, enabling traders to detect potential reversal zones and optimize their trading strategies. Its high flexibility makes it suitable for both beginners and professional traders in markets like Forex and stocks.
Gartley Harmonic Pattern Indicator Table
Below are the general specifications of the indicator.
Indicator Categories: | Price Action MT5 Indicators Chart & Classic MT5 Indicators Harmonic MT5 Indicators |
Platforms: | MetaTrader 5 Indicators |
Trading Skills: | Intermediate |
Indicator Types: | Leading MT5 Indicators Non-Repaint MT5 Indicators Reversal MT5 Indicators |
Timeframe: | Multi-Timeframe MT5 Indicators |
Trading Style: | Intraday MT5 Indicators Scalper MT5 Indicators Day Trading MT5 Indicators |
Trading Instruments: | Forex MT5 Indicators Stock MT5 Indicators Indices MT5 Indicators Share Stock MT5 Indicators |
The Indicator at a Glance
The Gartley Indicator is a powerful tool for traders aiming to quickly identify harmonic patterns and capitalize on market opportunities. By automating the analysis of price structures and integrating Fibonacci ratios, it highlights entry and exit points upon detecting harmonic patterns.
This tool is effective across all markets, including Forex and stock markets. Its ability to detect Gartley Harmonic Patterns accelerates decision-making, making it ideal for traders.
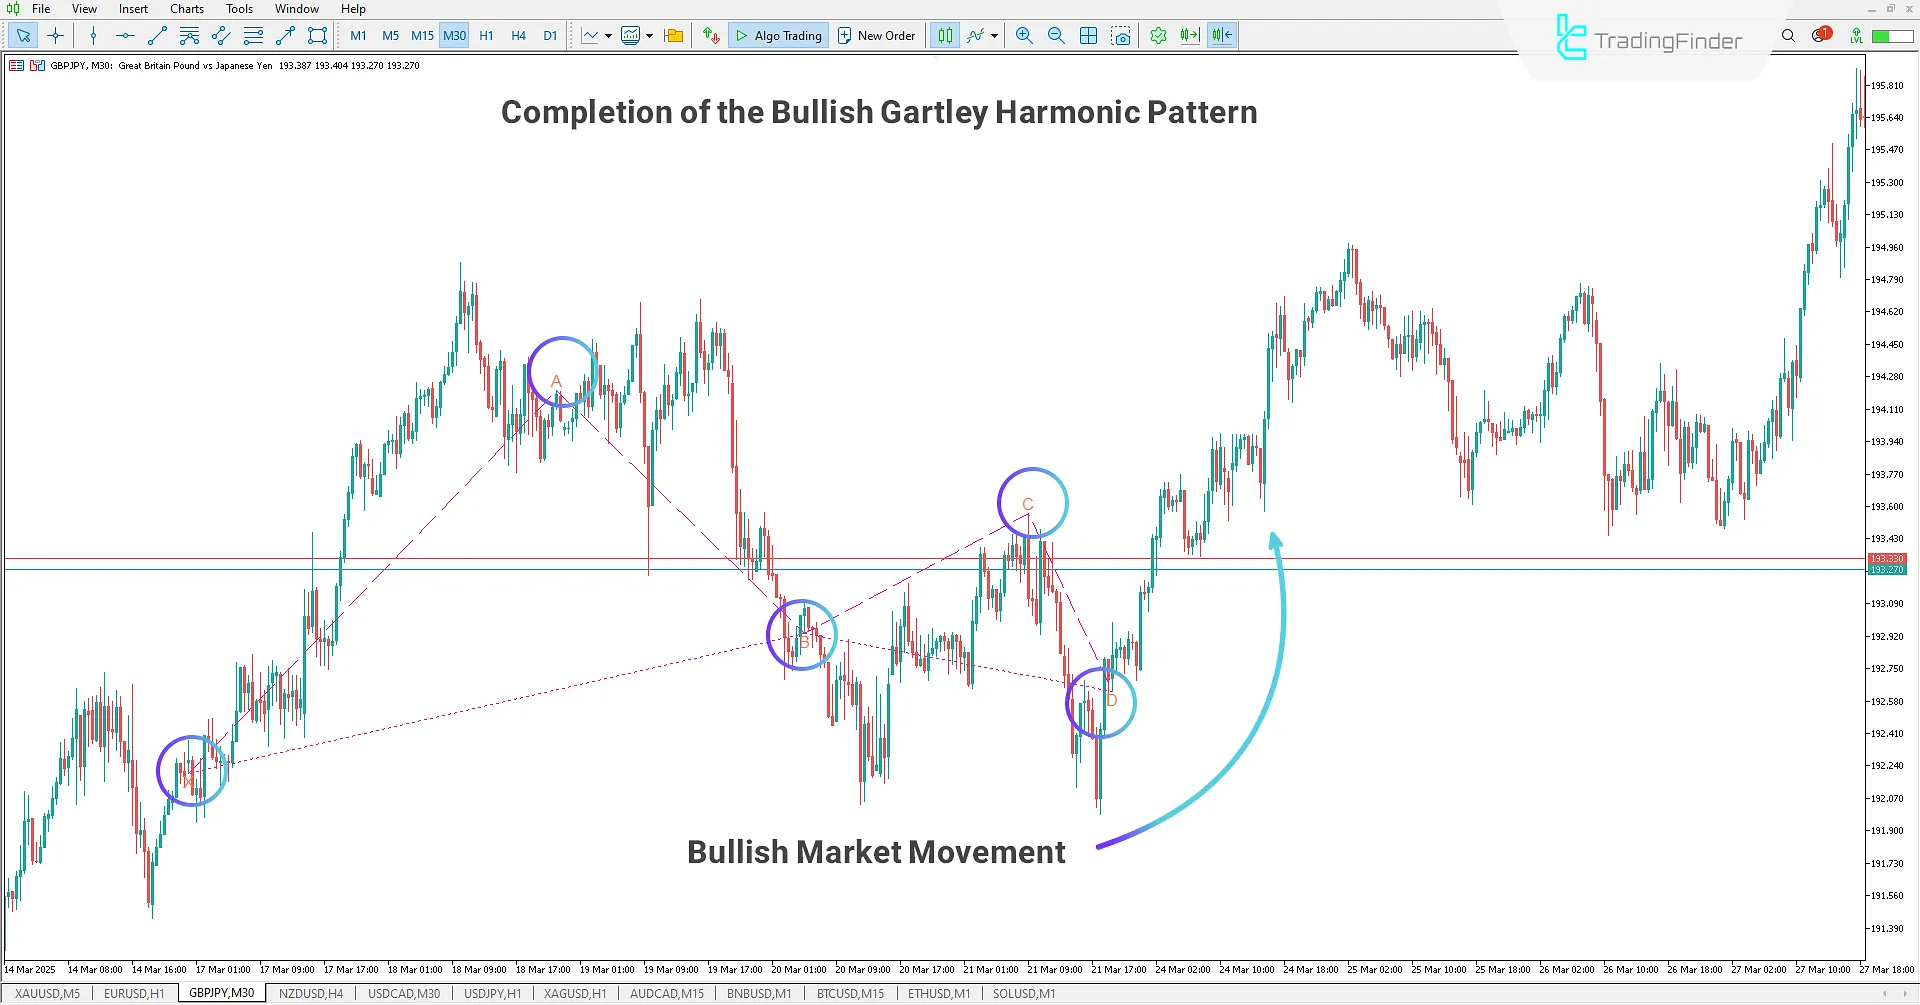
Bullish Gartley Harmonic Pattern
In the 30-minute chart of GBP/JPY, a bullish Gartley Harmonic Pattern has been identified and marked with lines on the chart.
Traders can use this indicator to spot the Gartley pattern and execute buy trades based on their trading strategy. The indicator simplifies pattern recognition by plotting five key points, enabling precise analysis and effective market entry.
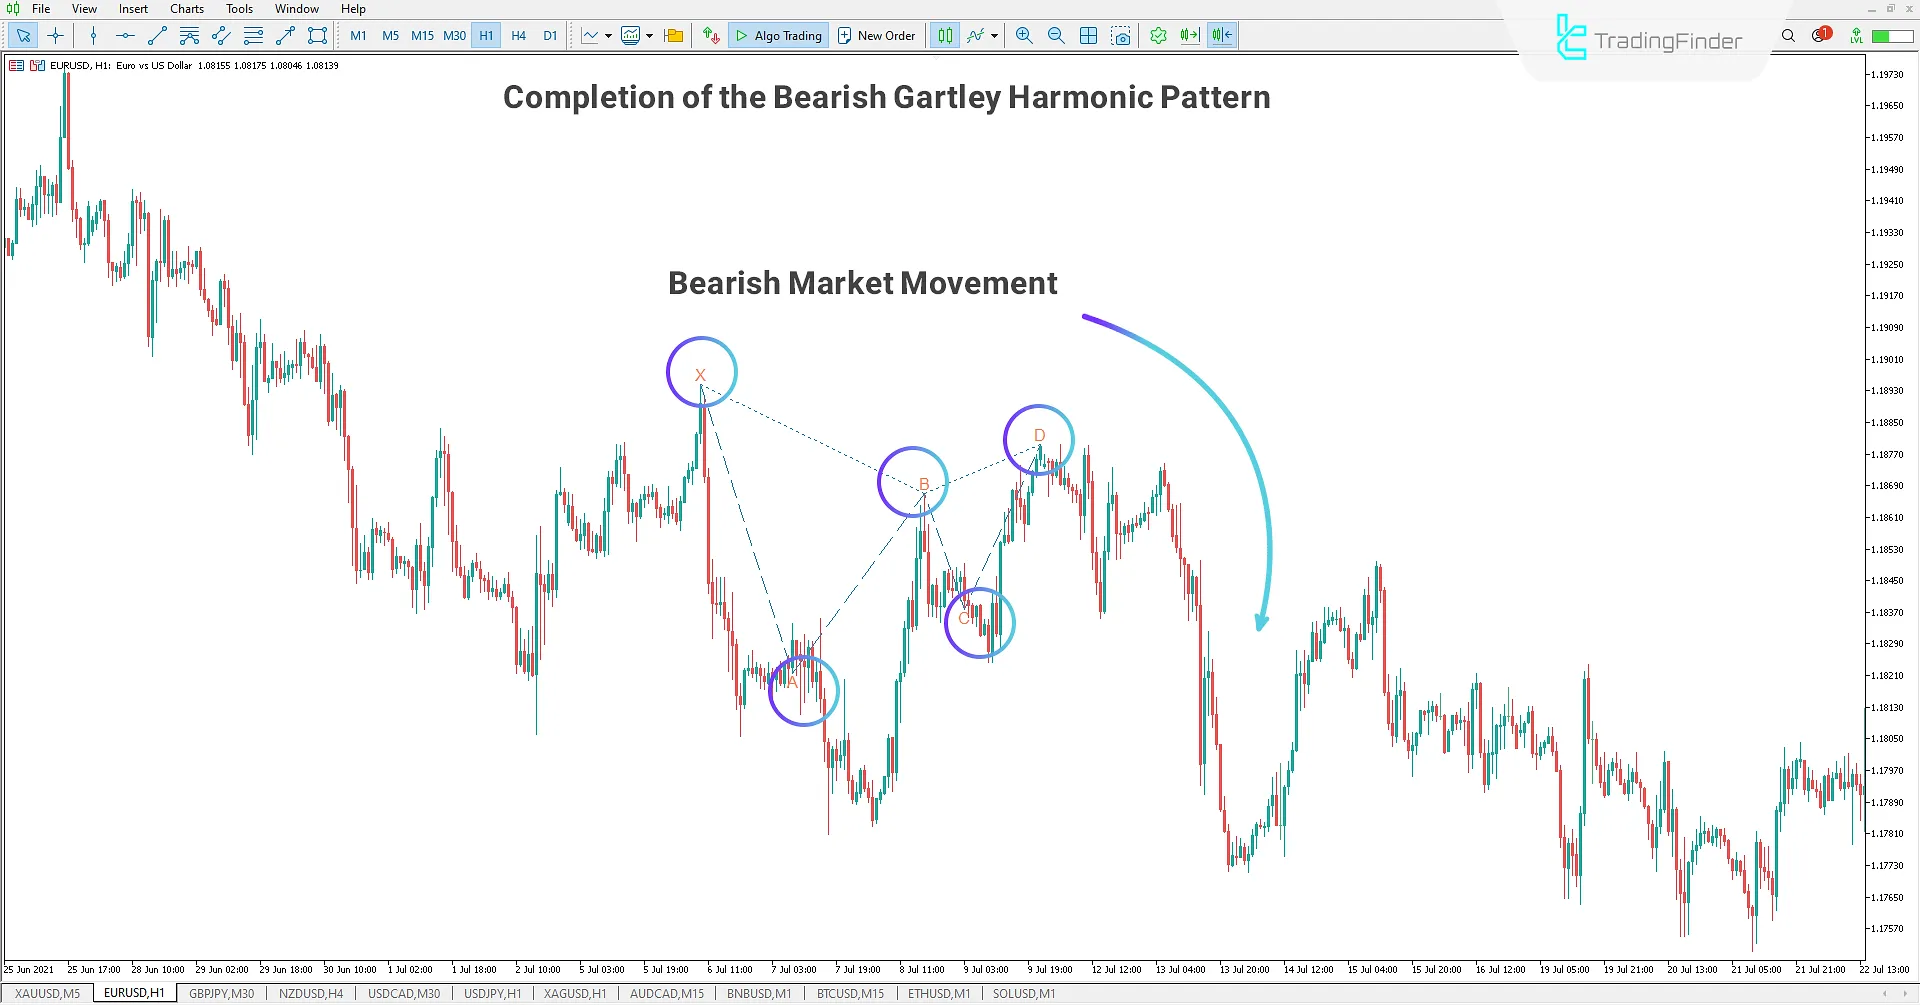
Bearish Gartley Harmonic Pattern
In the 1-hour chart of EUR/USD, after forming a Gartley Harmonic Pattern, the price entered a downtrend.
Traders can use the Gartley Harmonic Pattern Indicator to identify bearish patterns and perform advanced technical analysis. This tool allows them to confirm the pattern and execute sell trades, maximizing market opportunities.
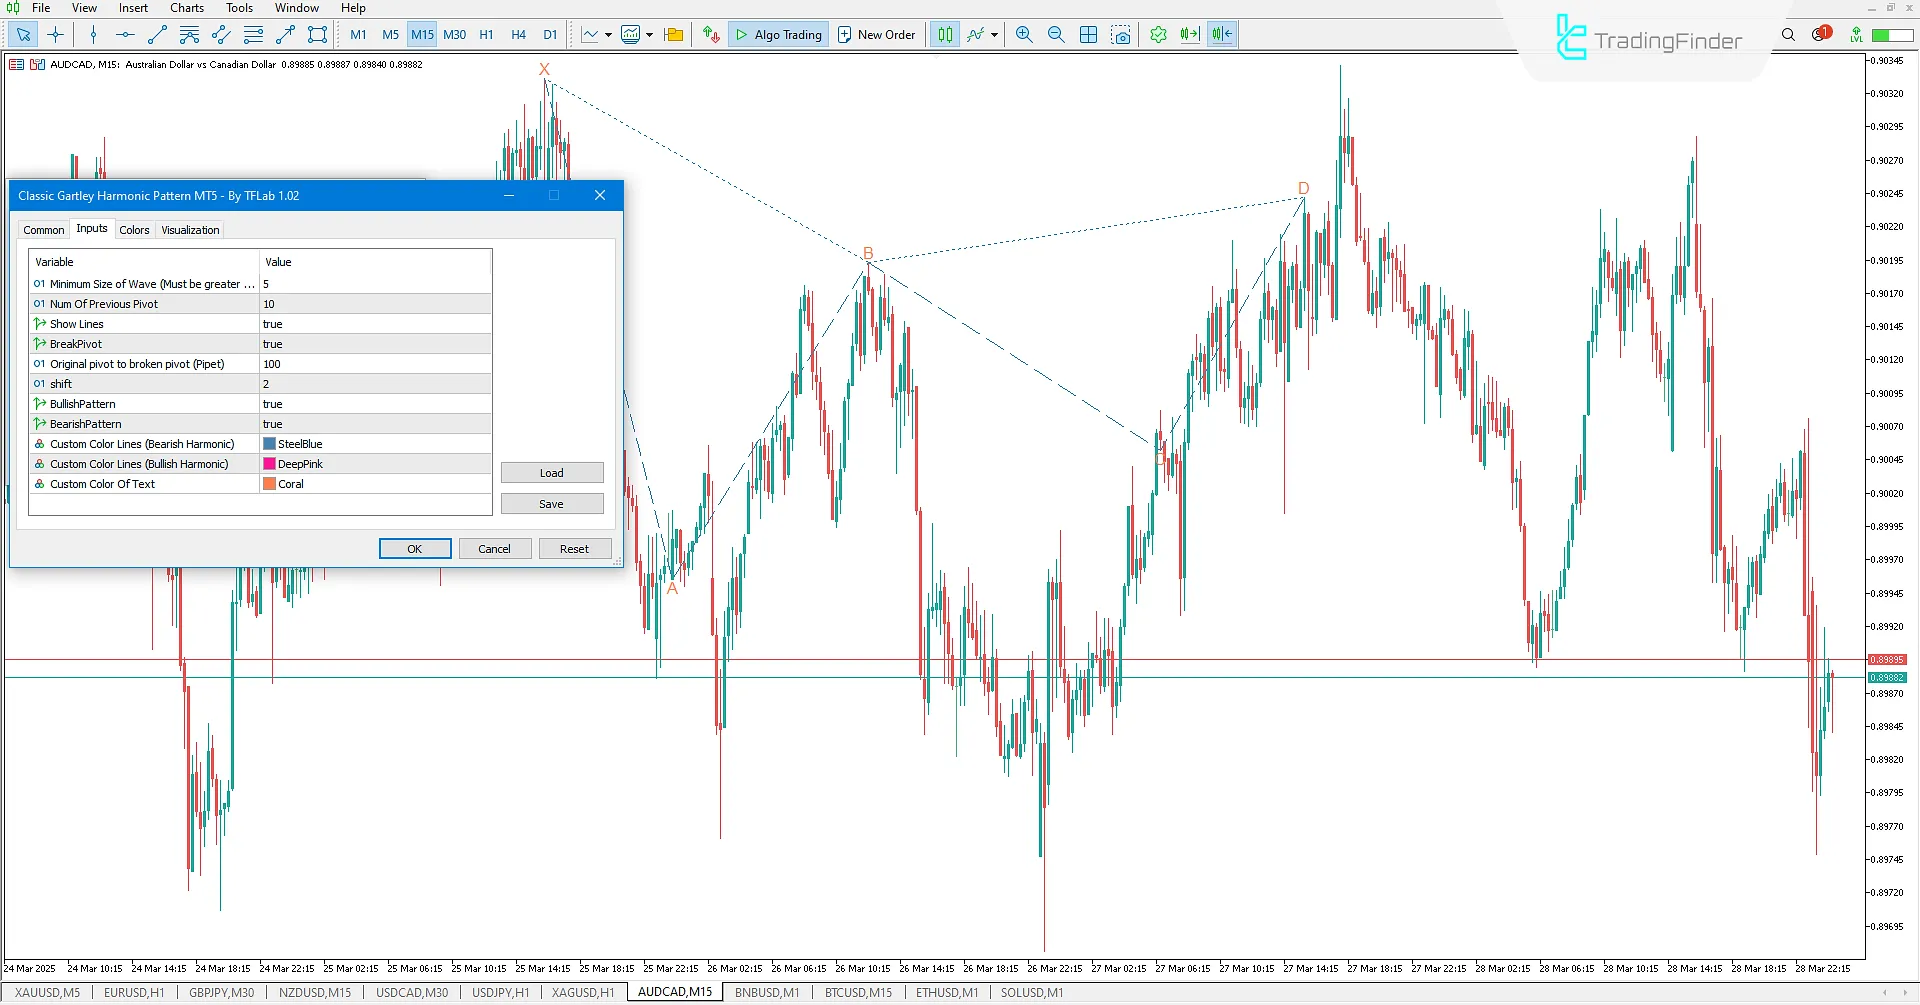
Gartley Harmonic Pattern Indicator Settings
Below are the settings for the Gartley Harmonic Pattern Indicator:
- Minimum Length Of Wave (candle): Set the minimum wave length in candles.
- Num Of Previous Candle: Select the number of historical candles.
- Show Lines: Toggle pattern lines on/off.
- Break Pivot: Toggle pivot break alerts on/off.
- Original Pivot to Broken Pivot (Pipet): Set pivot break threshold.
- Shift: Adjust the shift value.
- Bullish Pattern: Toggle bullish pattern display.
- Bearish Pattern: Toggle bearish pattern display.
- Style Of Line: Choose line drawing style.
- Width Of Line: Adjust line thickness.
- Custom Color Lines (Bearish Harmonic): Set bearish pattern color.
- Custom Color Lines (Bullish Harmonic): Set bullish pattern color.
- Custom Color Of Text: Set text color.
Conclusion
The Gartley Harmonic Pattern Indicator is one of the Classic Chart Indicators for MetaTrader 5, designed for traders analyzing market reversals using harmonic patterns.
By combining Fibonacci ratios with the Gartley structure, it provides high accuracy in predicting price movements. Traders can confidently enter trades after confirming the fifth point of the pattern in trading strategies, leveraging market opportunities.
Gartley Harmonic Pattern MT5 PDF
Gartley Harmonic Pattern MT5 PDF
Click to download Gartley Harmonic Pattern MT5 PDFWhat is the Gartley Harmonic Pattern Indicator?
It is a harmonic pattern detection tool for MetaTrader 5/4, designed to analyze harmonic patterns and forecast price reversals.
How does this indicator help traders?
It identifies market reversal points, facilitates buy/sell decisions, and enables advanced chart analysis.


