![Head and Shoulders Visual Indicator for MetaTrader 5 Download - [TradingFinder]](https://cdn.tradingfinder.com/image/310417/2-44-en-head-shoulders-visual-mt5-1-png.webp)
![Head and Shoulders Visual Indicator for MetaTrader 5 Download - [TradingFinder] 0](https://cdn.tradingfinder.com/image/310417/2-44-en-head-shoulders-visual-mt5-1-png.webp)
![Head and Shoulders Visual Indicator for MetaTrader 5 Download - [TradingFinder] 1](https://cdn.tradingfinder.com/image/310412/2-44-en-head-shoulders-visual-mt5-2-png.webp)
![Head and Shoulders Visual Indicator for MetaTrader 5 Download - [TradingFinder] 2](https://cdn.tradingfinder.com/image/310413/2-44-en-head-shoulders-visual-mt5-3.webp)
![Head and Shoulders Visual Indicator for MetaTrader 5 Download - [TradingFinder] 3](https://cdn.tradingfinder.com/image/310416/2-44-en-head-shoulders-visual-mt5-4.webp)
The Head and Shoulders Visual Indicator in MetaTrader 5 appears in two forms: Head and Shoulders Top (Bearish) and Head and Shoulders Bottom (Bullish). This Indicator helps predict trend reversals and identify key market turning points in Technical analysis.
Head and Shoulders Visual Specifications Table
The table below outlines the specifications of the Head and Shoulders Visual Indicator in MetaTrader 5:
Indicator Categories: | Price Action MT5 Indicators Chart & Classic MT5 Indicators Harmonic MT5 Indicators |
Platforms: | MetaTrader 5 Indicators |
Trading Skills: | Intermediate |
Indicator Types: | Range MT5 Indicators Breakout MT5 Indicators |
Timeframe: | Multi-Timeframe MT5 Indicators |
Trading Style: | Intraday MT5 Indicators |
Trading Instruments: | Forex MT5 Indicators Crypto MT5 Indicators Stock MT5 Indicators |
Indicator Overview
The Head and Shoulders Indicator automatically detects Head and Shoulders Top (Bearish) and Head & Shoulders Bottom (Bullish) patterns on charts.
This MetaTrader 5 classic chart pattern indicator identifies key points such as the left shoulder, head, right shoulder, and neckline, helping traders determine entry and exit zones.
Uptrend Conditions
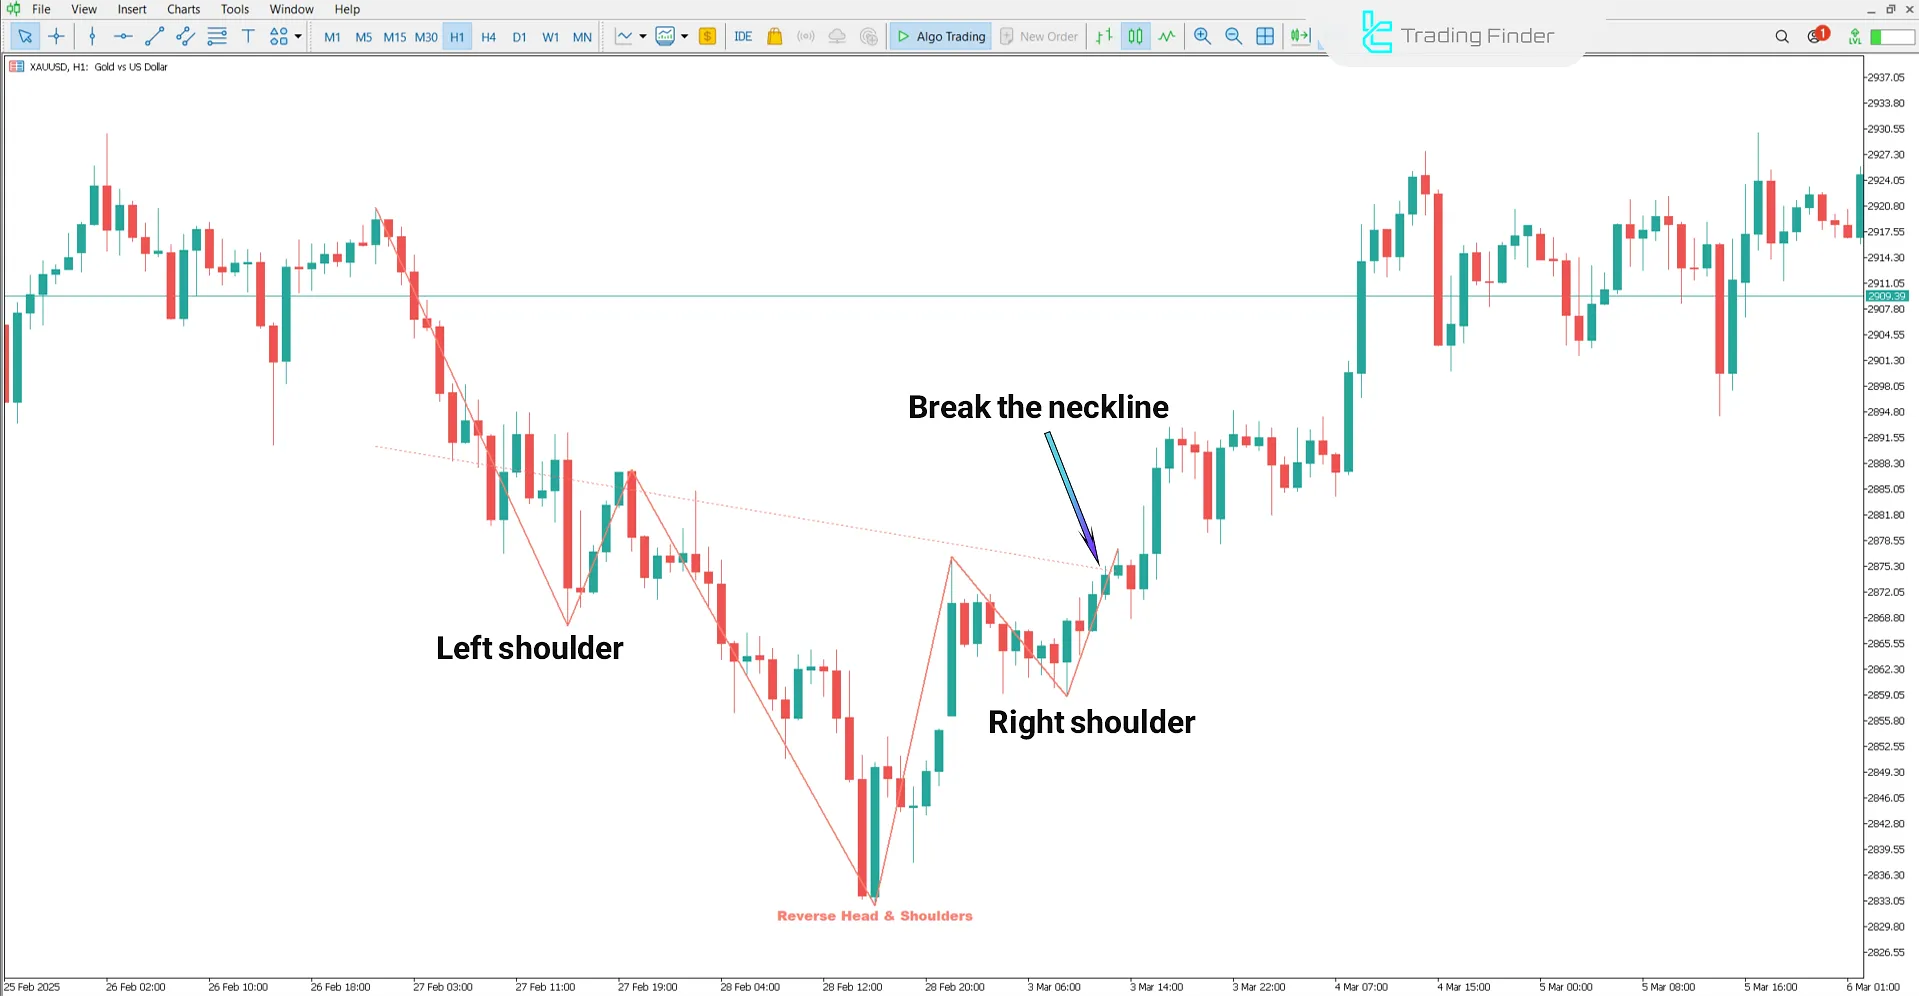
The price chart below shows the global gold price (XAUUSD) in a 1-hour timeframe.
An inverse Head and Shoulders pattern typically forms at the end of a downtrend, indicating a potential reversal to an uptrend. When the neckline breaks upward, a Buy Signal is triggered, signaling the start of a new uptrend.

Downtrend Conditions
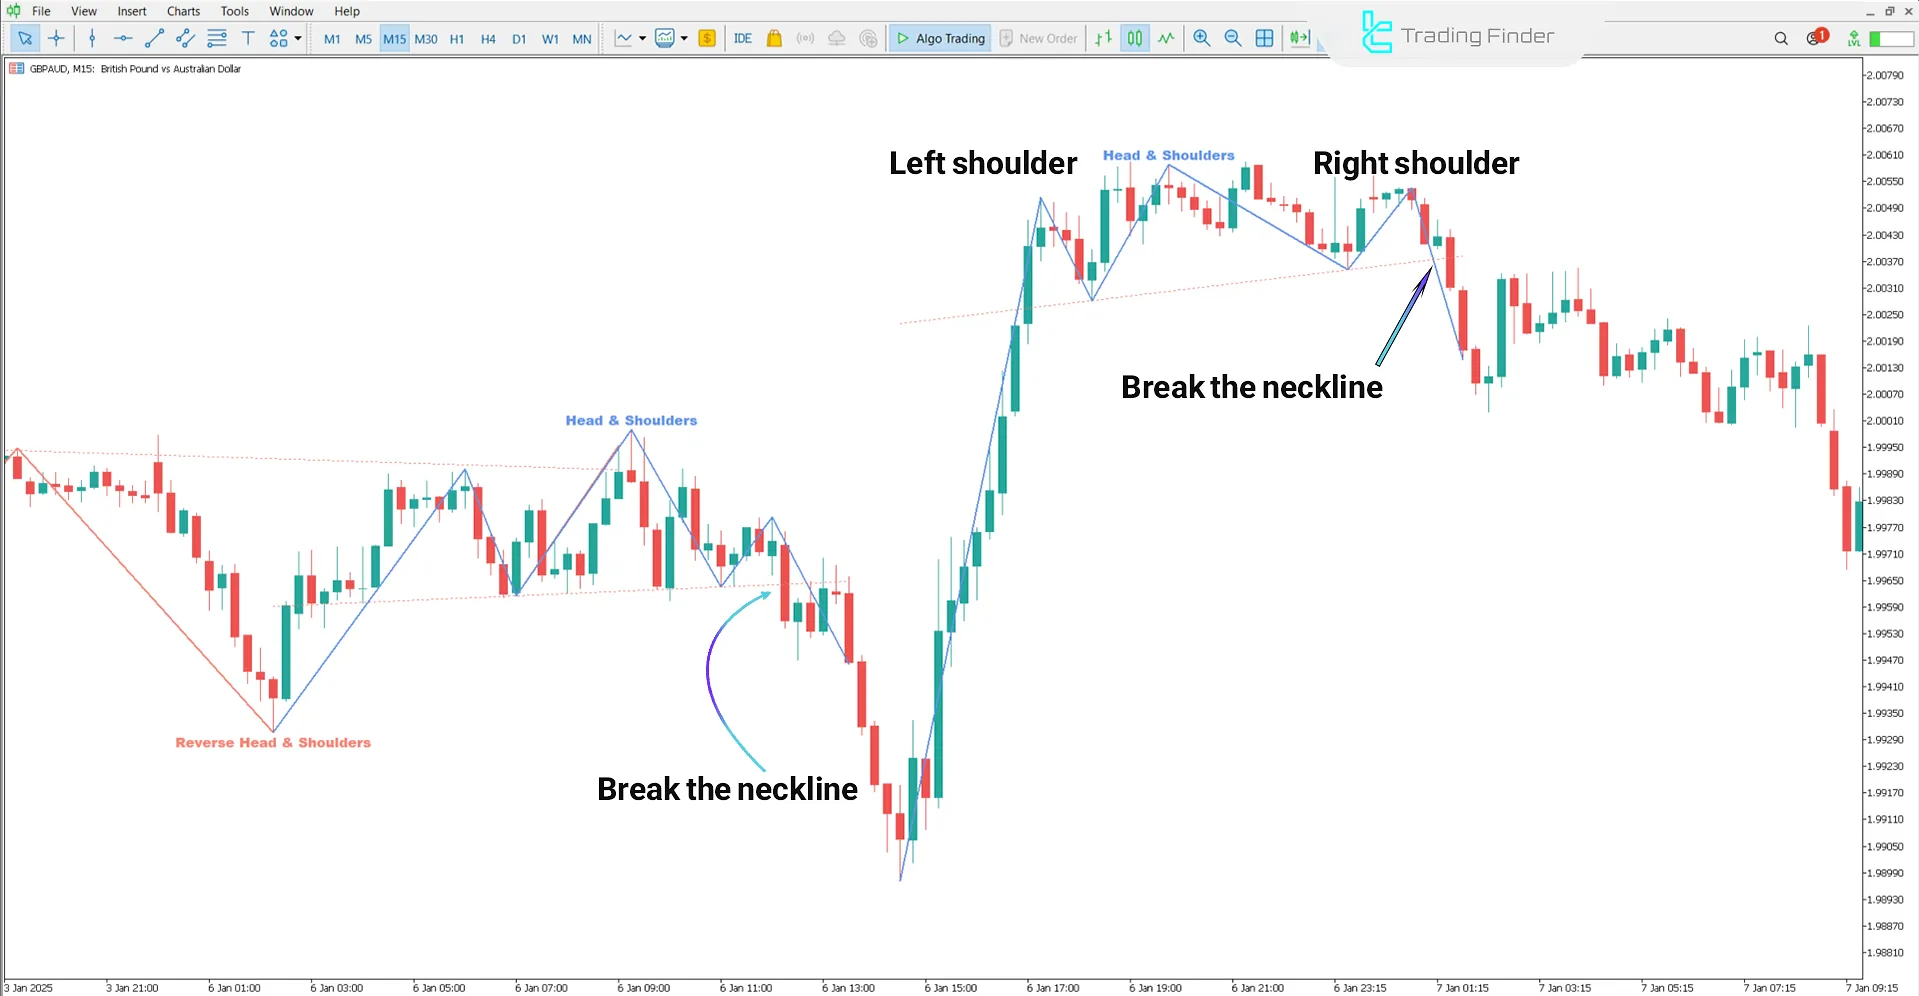
The chart below displays the GBP/AUD currency pair in a 15-minute timeframe.
A Head and Shoulders pattern usually forms after an uptrend, signaling a reversal to a downtrend. This Harmonic patterns is identifiable by the formation of the left, head, and right shoulder. When the neckline breaks downward, a Sell Signal is generated.

Indicator Settings
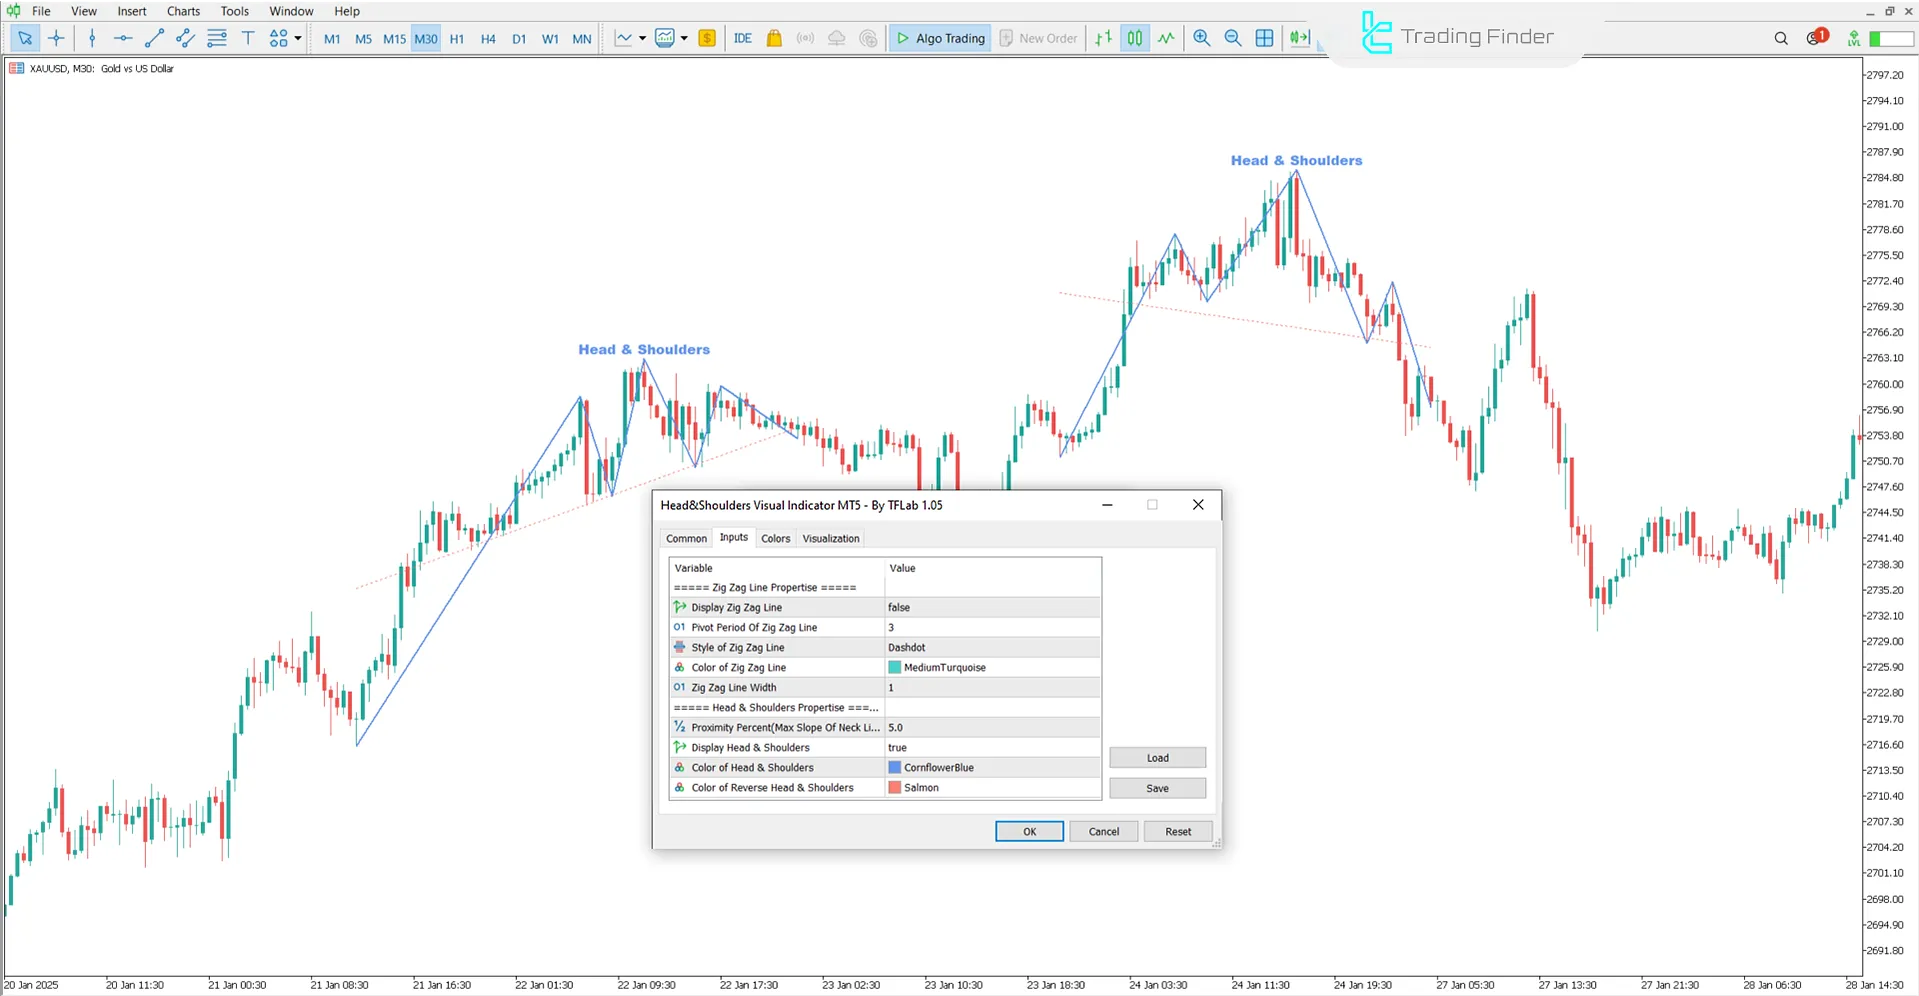
The settings panel of the Head and Shoulders Indicator in MetaTrader 5 is shown below:

- Display Zig Zag Line: Shows the zig zag line
- Pivot Period Of Zig Zag Line: Sets the pivot period for the zig zag line
- Style of Zig Zag Line: Defines the zig zag line style
- Color of Zig Zag Line: Sets the color of the zig zag line
- Zig Zag Line Width: Adjusts the thickness of the zig zag line
- Proximity Percent (Max Slope Of Neck Line %): Defines the proximity percentage (maximum slope of the neckline)
- Display Head & Shoulders: Enables the Head & Shoulders pattern display
- Color of Head & Shoulders: Sets the color of the Head & Shoulders pattern
- Color of Reverse Head & Shoulders: Sets the color of the inverse Head & Shoulders pattern
Conclusion
The Head and Shoulders Indicator automatically detects standard and inverse Head & Shoulders patterns. These patterns in MT5 indicator are key trend reversal indicators, providing entry and exit levels upon neckline breakout.
Head Shoulders Visual MT5 PDF
Head Shoulders Visual MT5 PDF
Click to download Head Shoulders Visual MT5 PDFDoes the Head and Shoulders Indicator work in all markets?
Yes, the head and shoulders pattern is applicable in various financial markets, including stocks, forex, and cryptocurrencies.
How does the Head and Shoulders Indicator function?
The Indicator automatically plots head and shoulder patterns at the end of trends and generates trade signals upon a neckline breakout.


