


The Heiken Ashi Oscillator (HAO) is an analytical tool among MetaTrader 5 Oscillator, built from a combination of Heiken Ashi charting techniques and moving averages. This indicator is used to identify market trends and potential reversal points.
The Heiken Ashi Indicator detects Heiken Ashi candlesticks by averaging price data and displays them as a histogram in a separate window below the main chart.
Heiken Ashi Oscillator Specifications
The table below summarizes the key features of the Heiken Ashi Oscillator.
Indicator Categories: | Price Action MT5 Indicators Oscillators MT5 Indicators Trading Assist MT5 Indicators |
Platforms: | MetaTrader 5 Indicators |
Trading Skills: | Elementary |
Indicator Types: | Breakout MT5 Indicators Reversal MT5 Indicators |
Timeframe: | Multi-Timeframe MT5 Indicators |
Trading Style: | Day Trading MT5 Indicators |
Trading Instruments: | Forex MT5 Indicators Crypto MT5 Indicators Stock MT5 Indicators Forward MT5 Indicators |
Indicator Overview
The Heiken Ashi Oscillator, a MetaTrader 5 indicator, applies proprietary formulas to eliminate price noise and filter out unnecessary fluctuations , offering a clear view of overall market trends .
Changes in histogram bar colors indicate trend direction shifts:
· Red to Blue: Buy Signal
· Blue to Red: Sell Signal
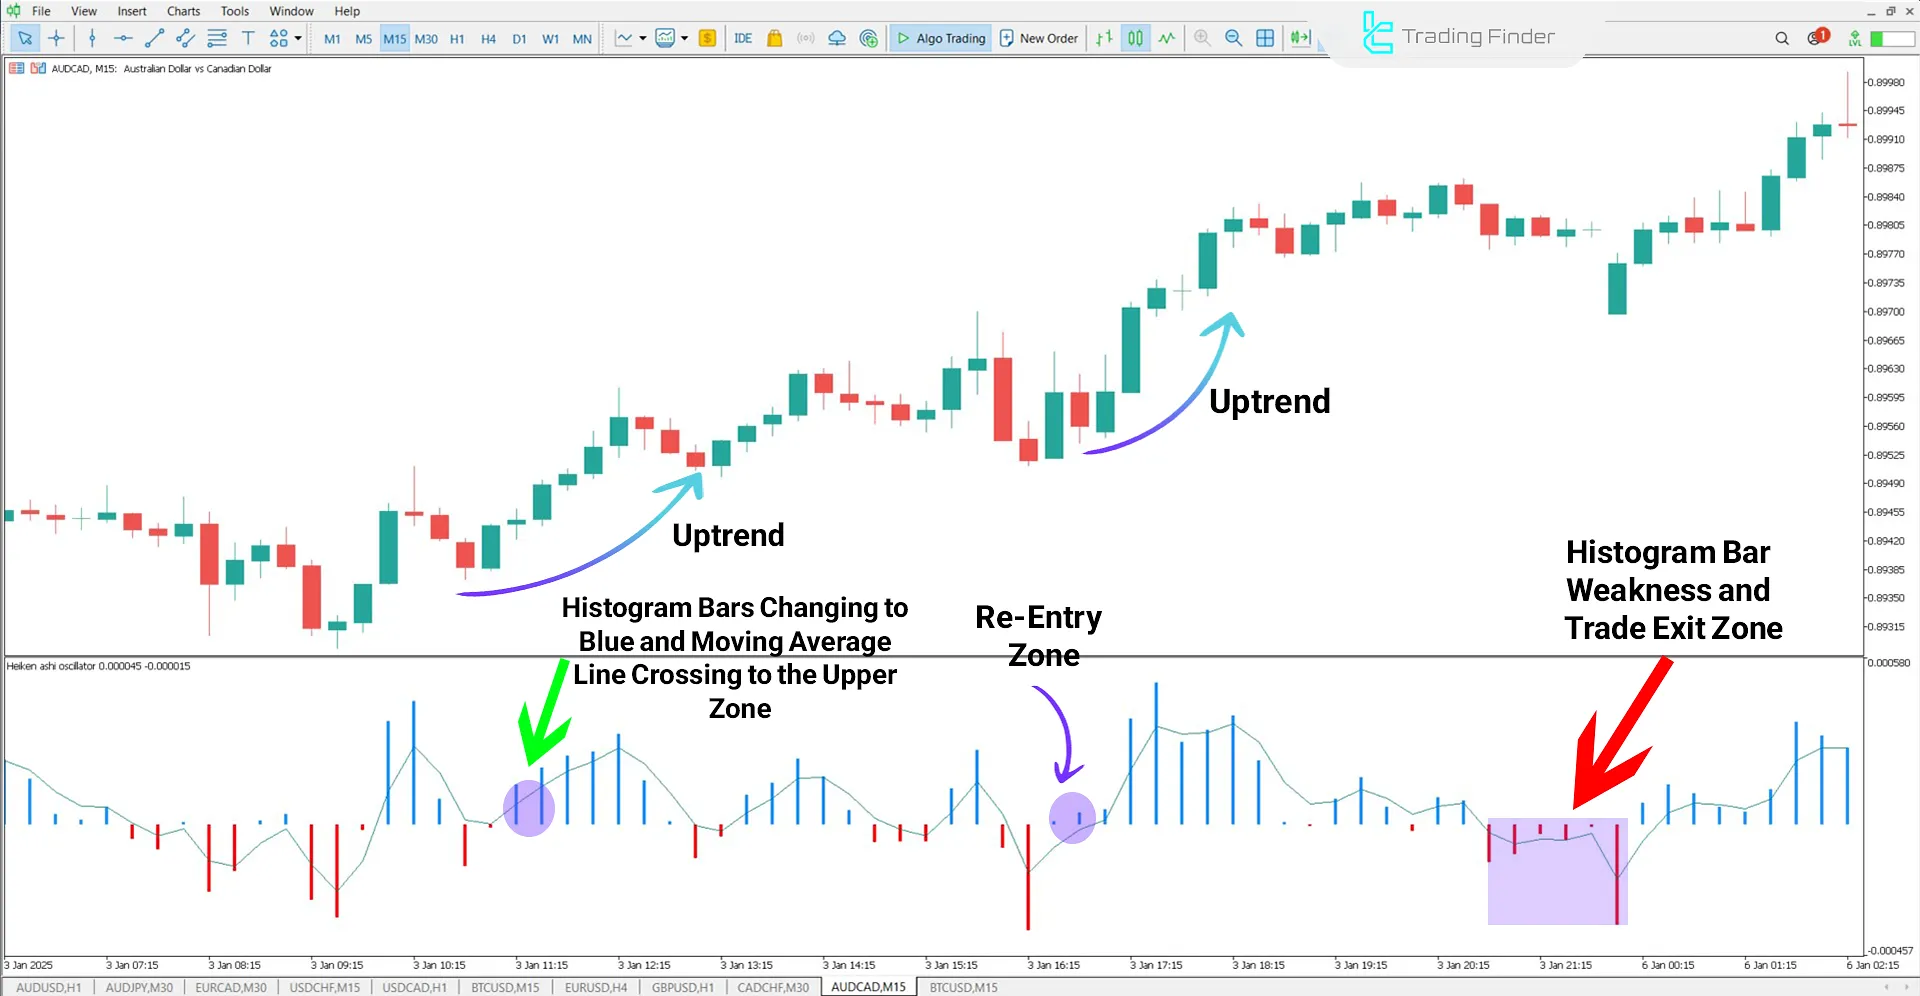
Indicator in an Uptrend
On the 15-minute AUD/CAD chart, a color change in the histogram bars from red to blue signals a buying opportunity.
Traders can exit their position when the histogram color changes back to red.
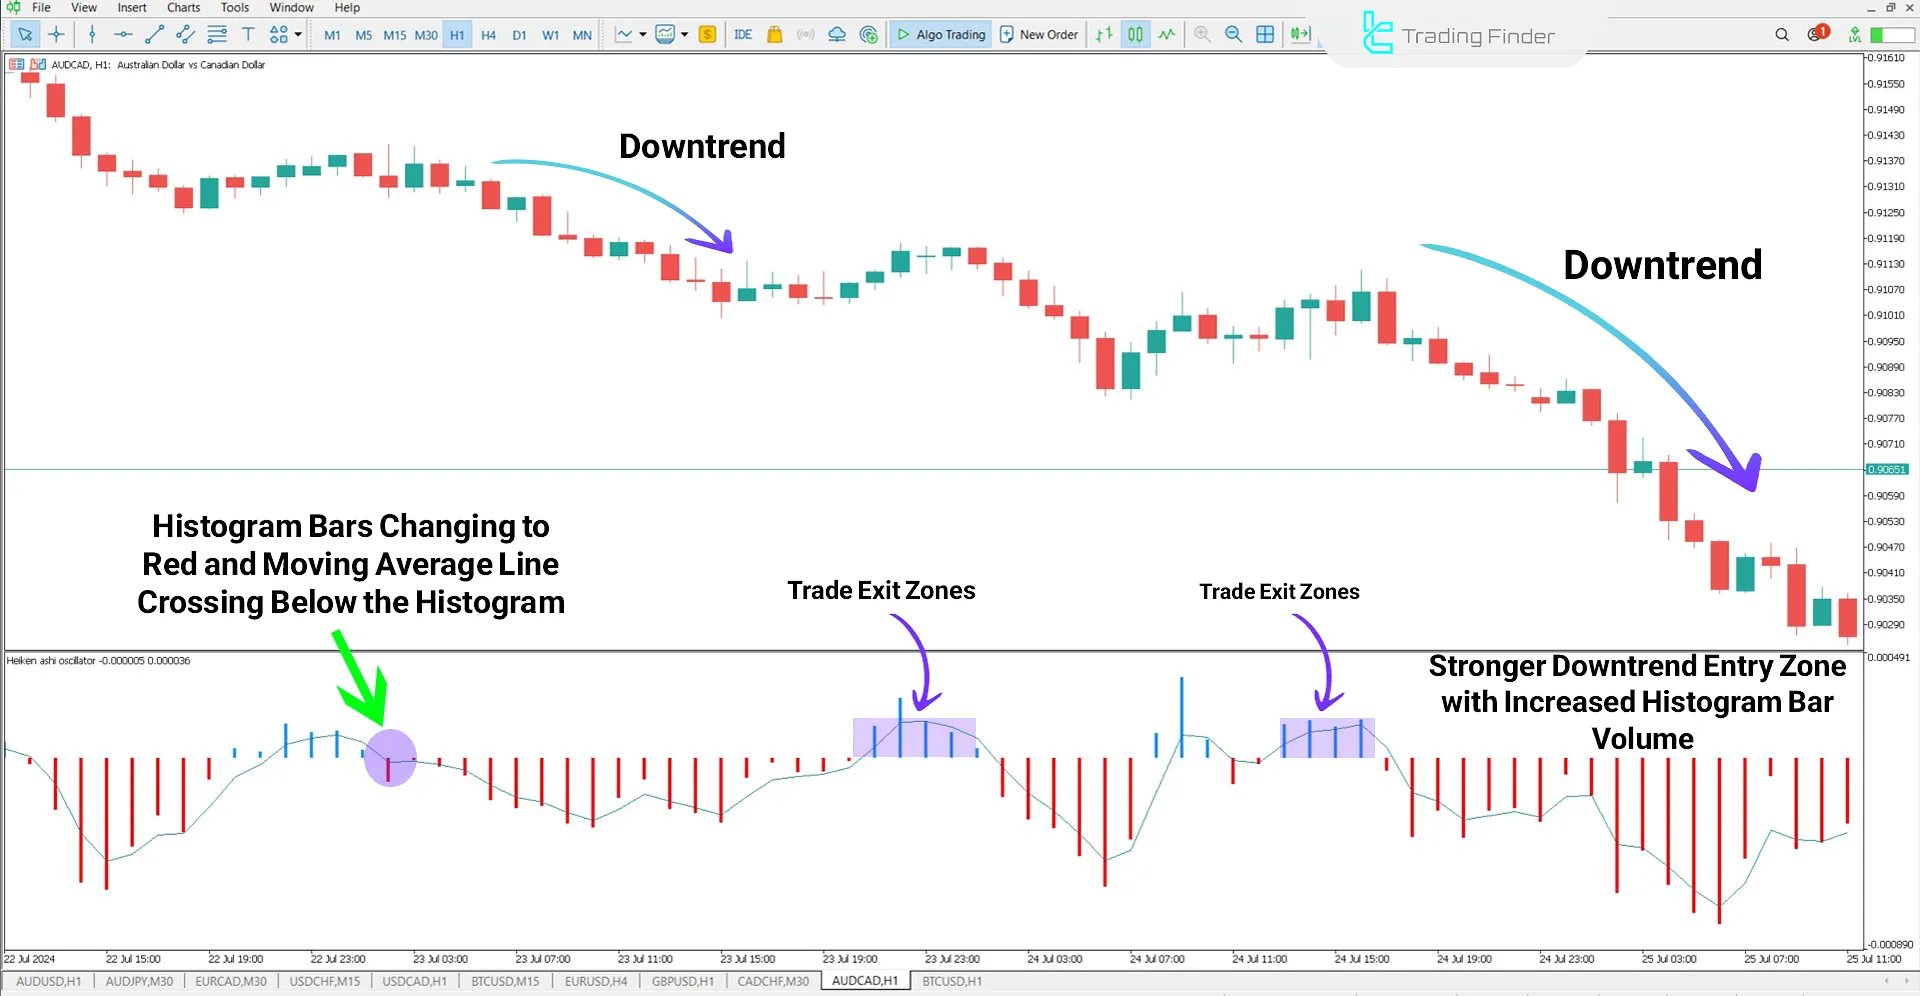
Indicator in a Downtrend
In the downtrend shown in the image below, a color change in the histogram bars from blue to red signals a sharp price drop and confirms the bearish trend.
If the oscillator bars weaken and the histogram color changes while the moving average crosses upward, it may indicate a weakening bearish trend.
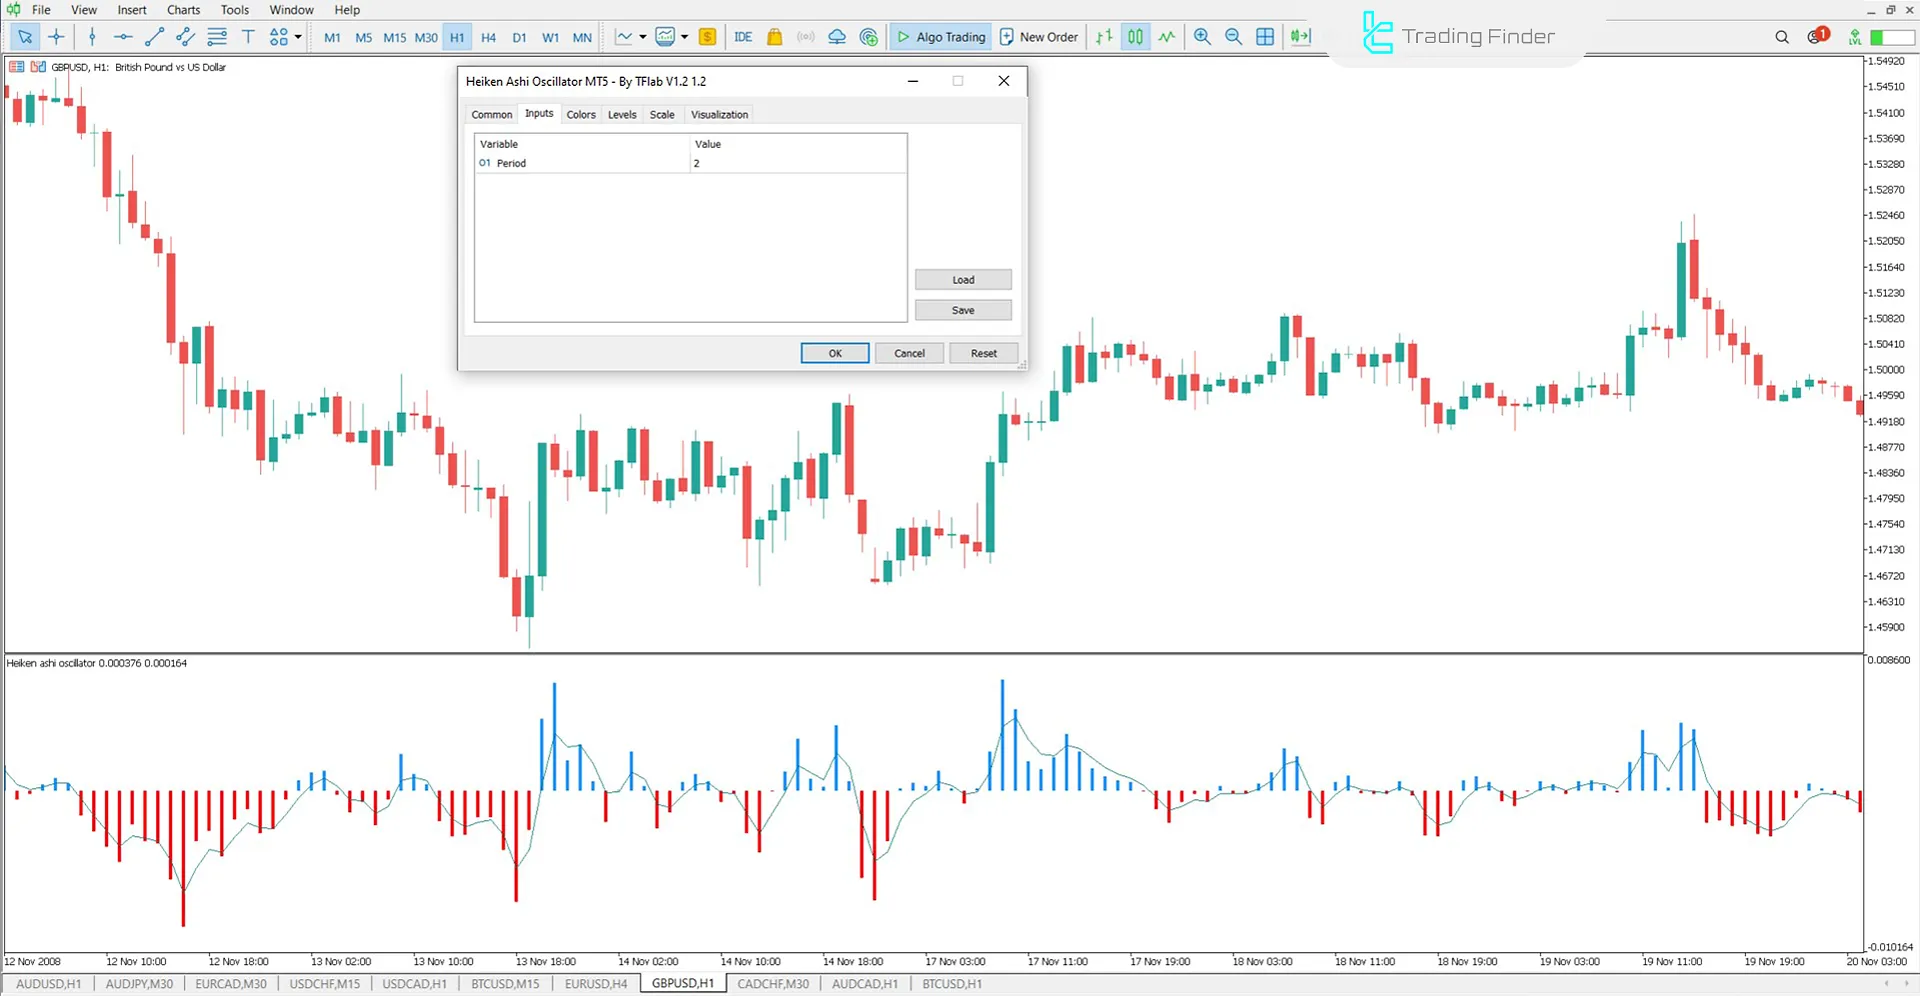
Heiken Ashi Oscillator Settings
The following image displays the complete settings panel of the Heiken Ashi Oscillator:
- Period: Calculation period for the moving average.
Conclusion
The Heiken Ashi Oscillator (HAO) is a practical tool for identifying trends and reversal points in financial markets.
By combining moving averages with Heiken Ashi techniques, this indicator filters out unnecessary fluctuations and provides a clearer view of price movement direction.
Heiken Ashi MT5 PDF
Heiken Ashi MT5 PDF
Click to download Heiken Ashi MT5 PDFWhat is the purpose of the Heiken Ashi Oscillator (HAO)?
The Heiken Ashi Oscillator is used to identify trends, detect reversal points, and reduce price noise in trading charts.
What is the difference between the Heiken Ashi Oscillator and Heiken Ashi Candlesticks?
The Heiken Ashi Oscillator is displayed as a histogram, smoothing out market trends. In contrast, Heiken Ashi candlesticks are plotted directly on the price chart, providing different visual data.


