


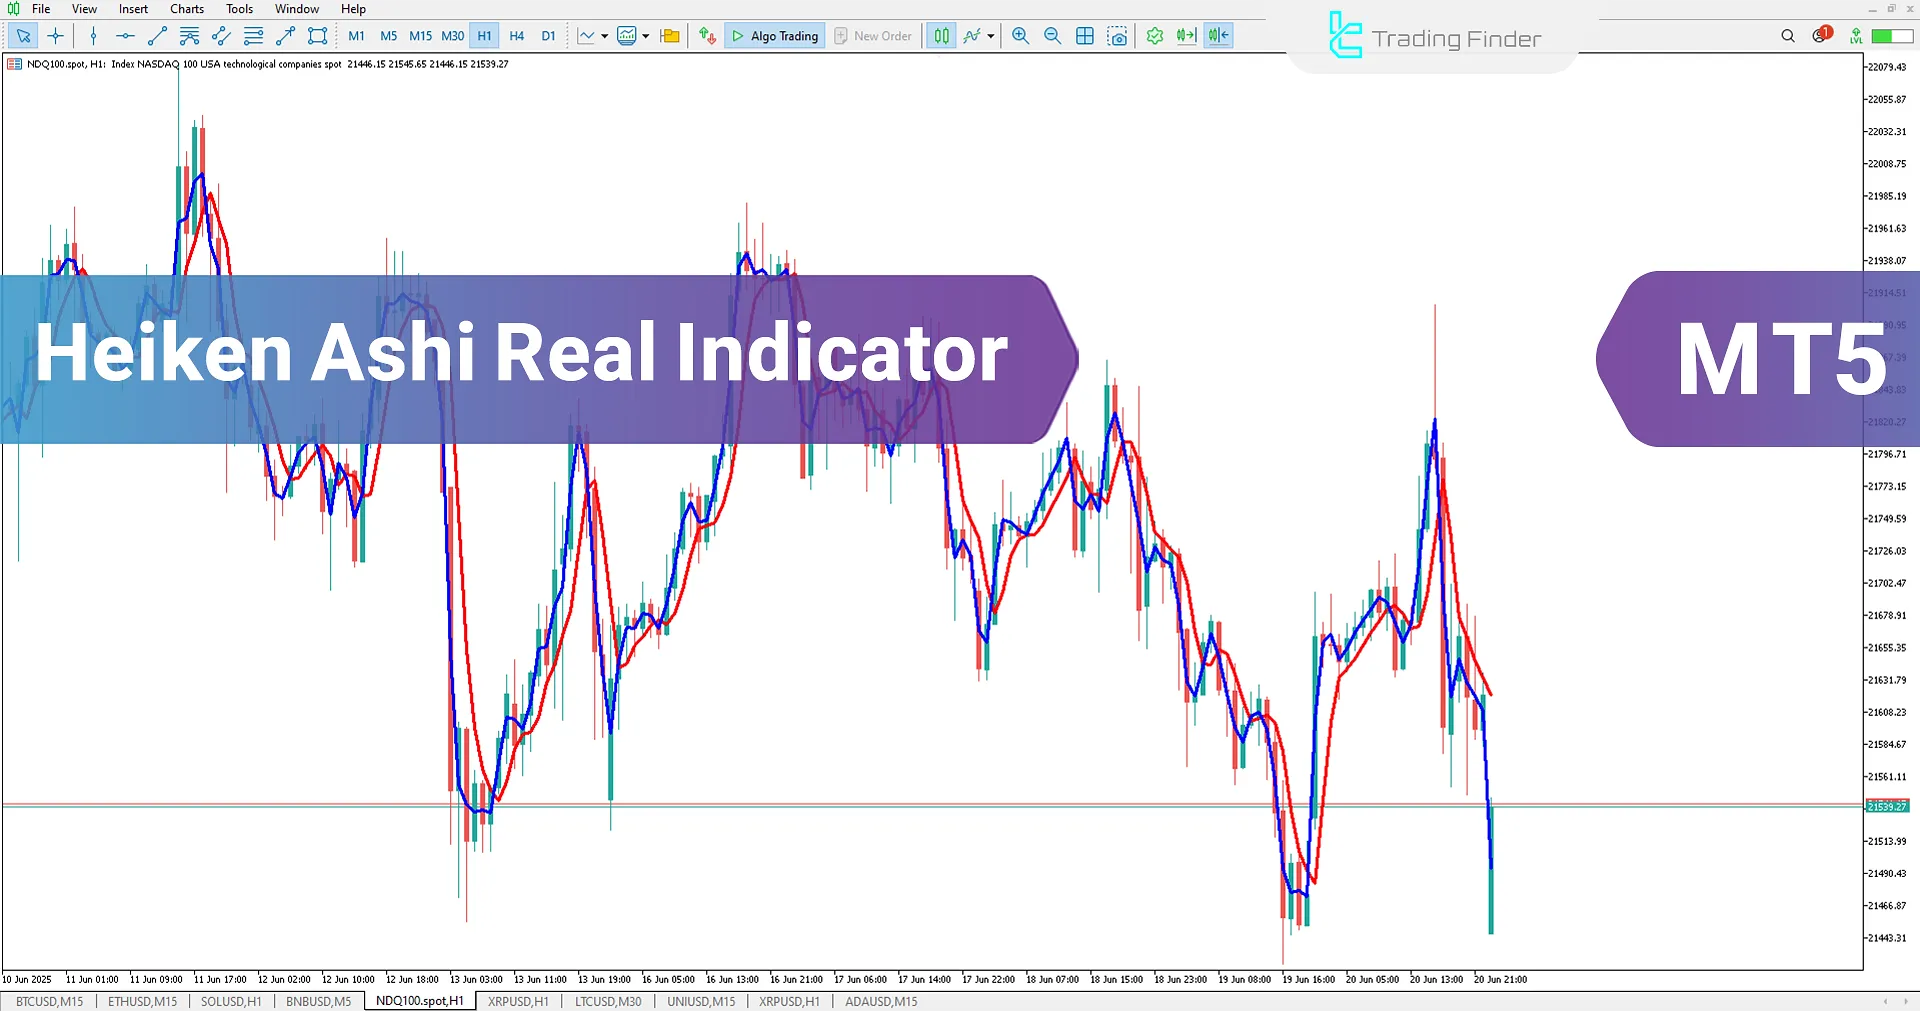
The Heiken Ashi Real indicator is a practical trading tool for traders seeking to identify market trends. It is an advanced version of the classic Heiken Ashi indicator, developed specifically for the MetaTrader 5 platform.
By observing the cross of two lines the Heiken Ashi candle open line (red) and the Heiken Ashi candle close line (blue) traders can identify suitable trading positions and enter buy or sell trades. This method enables traders to follow market trends with greater accuracy and confidence.
Heiken Ashi Real Indicator Table
The following section provides information about the Heiken Ashi Real indicator:
Indicator Categories: | Signal & Forecast MT5 Indicators Currency Strength MT5 Indicators Trading Assist MT5 Indicators Candle Sticks MT5 Indicators |
Platforms: | MetaTrader 5 Indicators |
Trading Skills: | Intermediate |
Indicator Types: | Lagging MT5 Indicators |
Timeframe: | M15-M30 Timeframe MT5 Indicators H1-H4 Timeframe MT5 Indicators |
Trading Style: | Intraday MT5 Indicators Scalper MT5 Indicators Day Trading MT5 Indicators |
Trading Instruments: | Forex MT5 Indicators Stock MT5 Indicators Indices MT5 Indicators Share Stock MT5 Indicators |
Indicator Overview
The Heiken Ashi Real indicator simplifies trend recognition by clearly showing bullish and bearish market movements. When the blue line moves upward, it indicates a buying opportunity.
Conversely, when the blue line moves downward and crosses the red line, it indicates a sell signal. These signals help traders identify entry points in the market more easily.
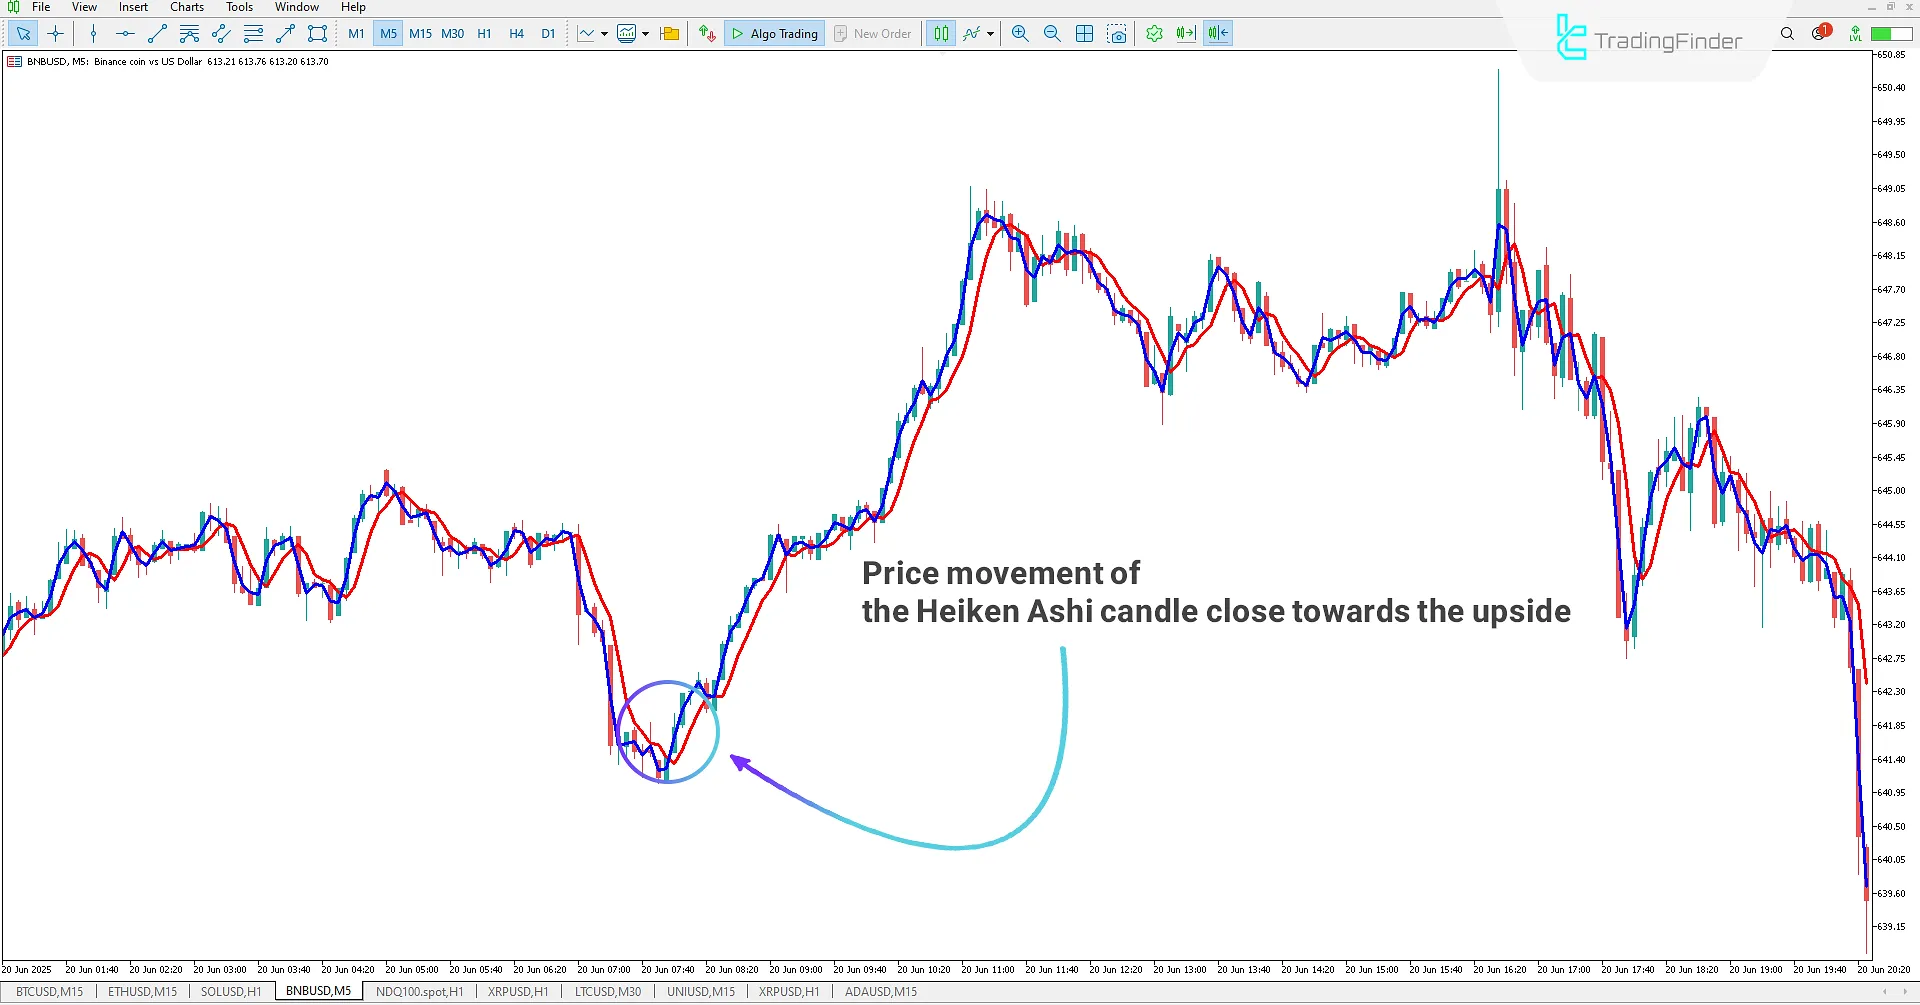
Bullish Trend
On the 5-minute chart of BNB/USD, traders can use the Heiken Ashi Real indicator to detect an uptrend.
A bullish signal is generated when the blue close-price line crosses above the red open-price line.
This signal allows traders to enter the market at the right moment and benefit from the upward price movement.
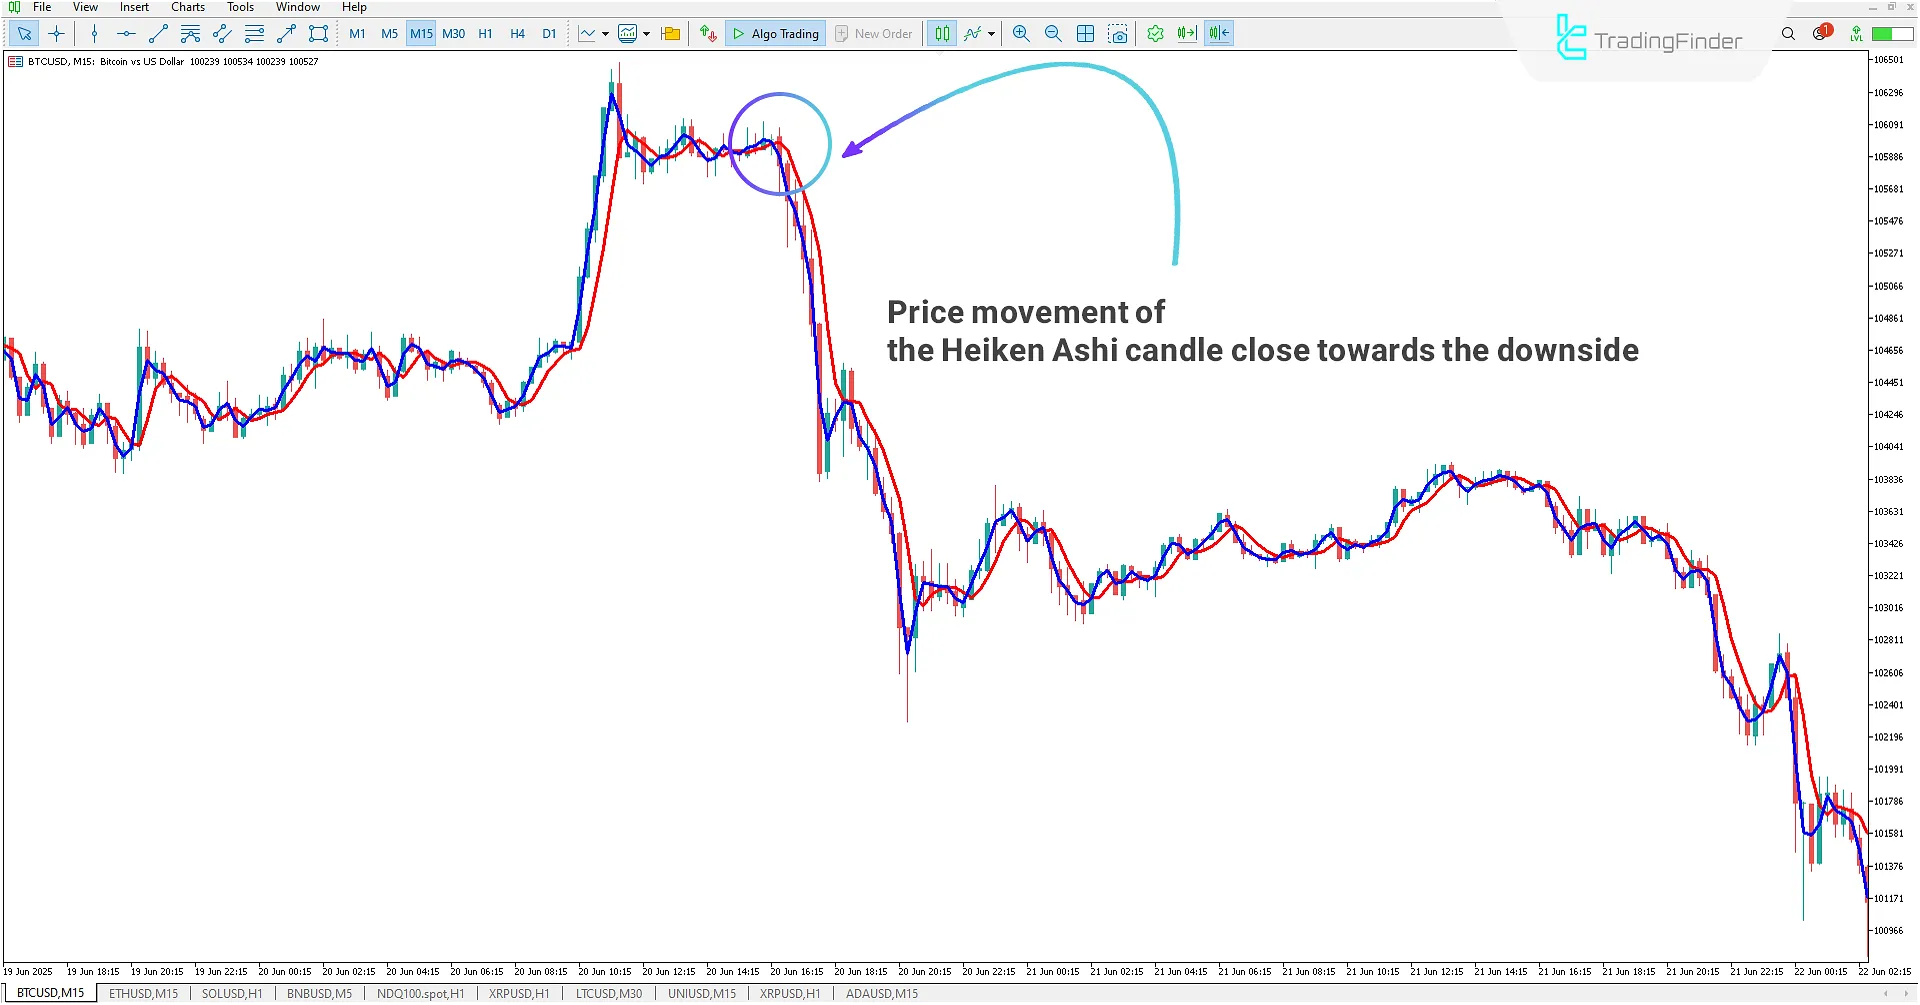
Bearish Trend
In the 15-minute chart of the cryptocurrency pairBTC/USD, when the blue line (the Heikin Ashi candle close line) moves downward and crosses below the red line (the Heikin Ashi candle open line), it indicates the beginning of a downtrend in the market.
The crossover of these two lines signals a sell trading opportunity, which traders can use to enter a short position and profit from the price decline.
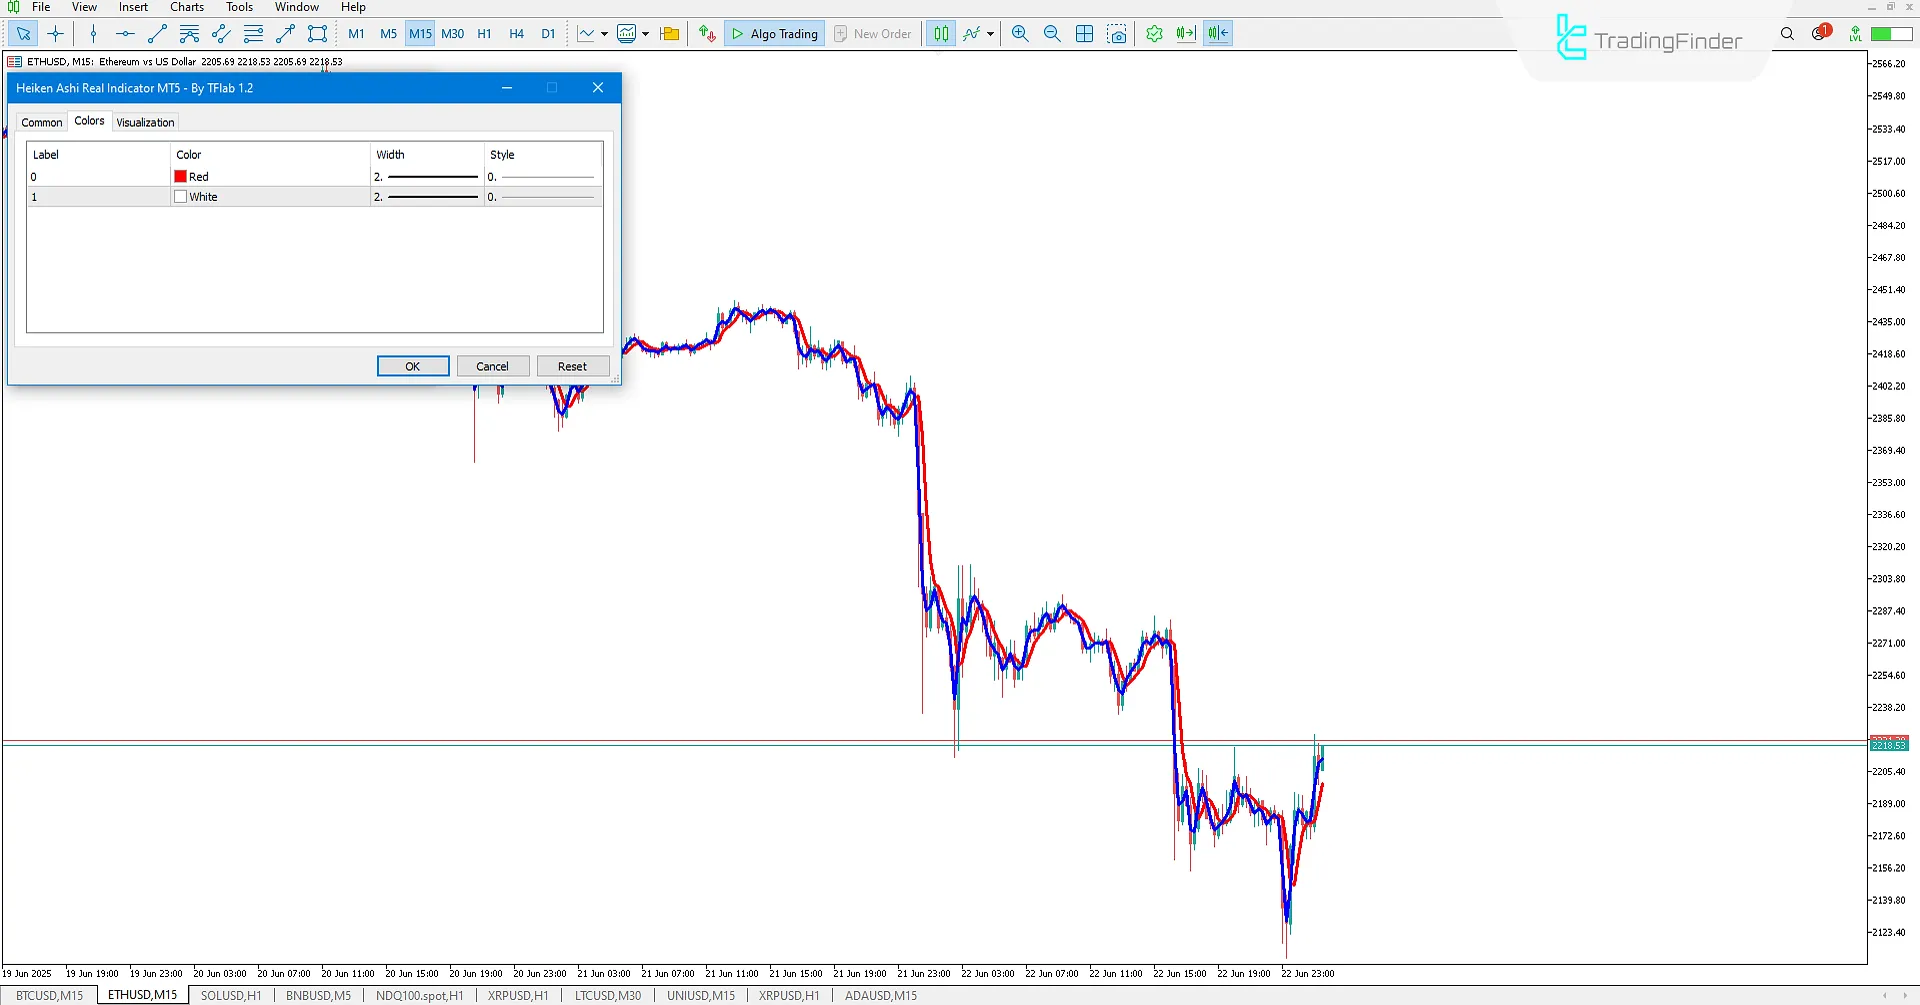
Indicator Settings
The section below outlines the settings available for the Heiken Ashi Real indicator:
This indicator only allows color customization of its lines.
- First line color setting: Set the color of the Heiken Ashi candle open line
- Second line color setting: Set the color of the Heiken Ashi candle close line
Conclusion
The Heiken Ashi Real indicator is a functional and enhanced version of the classic Heiken Ashi, designed to display market trends using two distinct lines.
By observing the red open line and the blue close line, traders can better analyze market conditions.
When these lines cross, they generate signals for entering buy or sell trades, helping traders act based on trend changes and improving decision-making with controlled risk.
Heiken Ashi Real MT5 PDF
Heiken Ashi Real MT5 PDF
Click to download Heiken Ashi Real MT5 PDFWhat is the Heiken Ashi Real indicator?
It is an advanced and upgraded version of the classic Heiken Ashi indicator, designed exclusively for MetaTrader 5. It displays market trends using the open and close lines of Heiken Ashi candles.
How does the Heiken Ashi Real indicator show market trends?
With two lines:
- Heiken Ashi candle open line (red)
- Heiken Ashi candle close line (blue)
The movement and crossover of these two lines reflect bullish or bearish trends in the market.


