![Heiken Ashi Smoothed Indicator for MT5 Download - Free - [Tradingfinder]](https://cdn.tradingfinder.com/image/157406/13-48-en-heiken-ashi-smoothed_mt5-1.webp)
![Heiken Ashi Smoothed Indicator for MT5 Download - Free - [Tradingfinder] 0](https://cdn.tradingfinder.com/image/157406/13-48-en-heiken-ashi-smoothed_mt5-1.webp)
![Heiken Ashi Smoothed Indicator for MT5 Download - Free - [Tradingfinder] 1](https://cdn.tradingfinder.com/image/157405/13-48-en-heiken-ashi-smoothed_mt5-2.webp)
![Heiken Ashi Smoothed Indicator for MT5 Download - Free - [Tradingfinder] 2](https://cdn.tradingfinder.com/image/157403/13-48-en-heiken-ashi-smoothed_mt5-3.webp)
![Heiken Ashi Smoothed Indicator for MT5 Download - Free - [Tradingfinder] 3](https://cdn.tradingfinder.com/image/157404/13-48-en-heiken-ashi-smoothed_mt5-4.webp)
The "Heiken Ashi Smoothed" indicator is an advanced and updated version of Heiken Ashi candlesticks.
This MT5 volatility indicator is specifically designed to analyze price trends and reduce chart noise.
The Heiken Ashi Smoothed indicator operates like a Moving Average (MA), forming above or below the price.
The trend's crossing with it indicates bullish or bearish market conditions.
Heiken Ashi Smoothed Indicator Table
Indicator Categories: | Volatility MT5 Indicators Trading Assist MT5 Indicators Candle Sticks MT5 Indicators |
Platforms: | MetaTrader 5 Indicators |
Trading Skills: | Elementary |
Indicator Types: | Trend MT5 Indicators Reversal MT5 Indicators |
Timeframe: | Daily-Weekly Timeframe MT5 Indicators |
Trading Style: | Day Trading MT5 Indicators |
Trading Instruments: | Forex MT5 Indicators Crypto MT5 Indicators Stock MT5 Indicators Commodity MT5 Indicators Indices MT5 Indicators Forward MT5 Indicators Share Stock MT5 Indicators |
Overview of the Indicator
The Heiken Ashi Smoothed indicator differs in calculations from its standard version. This MT5 trading assist indicatror, distinction enables it to present price changes more smoothly. It also employs exponential and simple moving average formulas, filtering out short term trend noise.
Bullish Trend Conditions
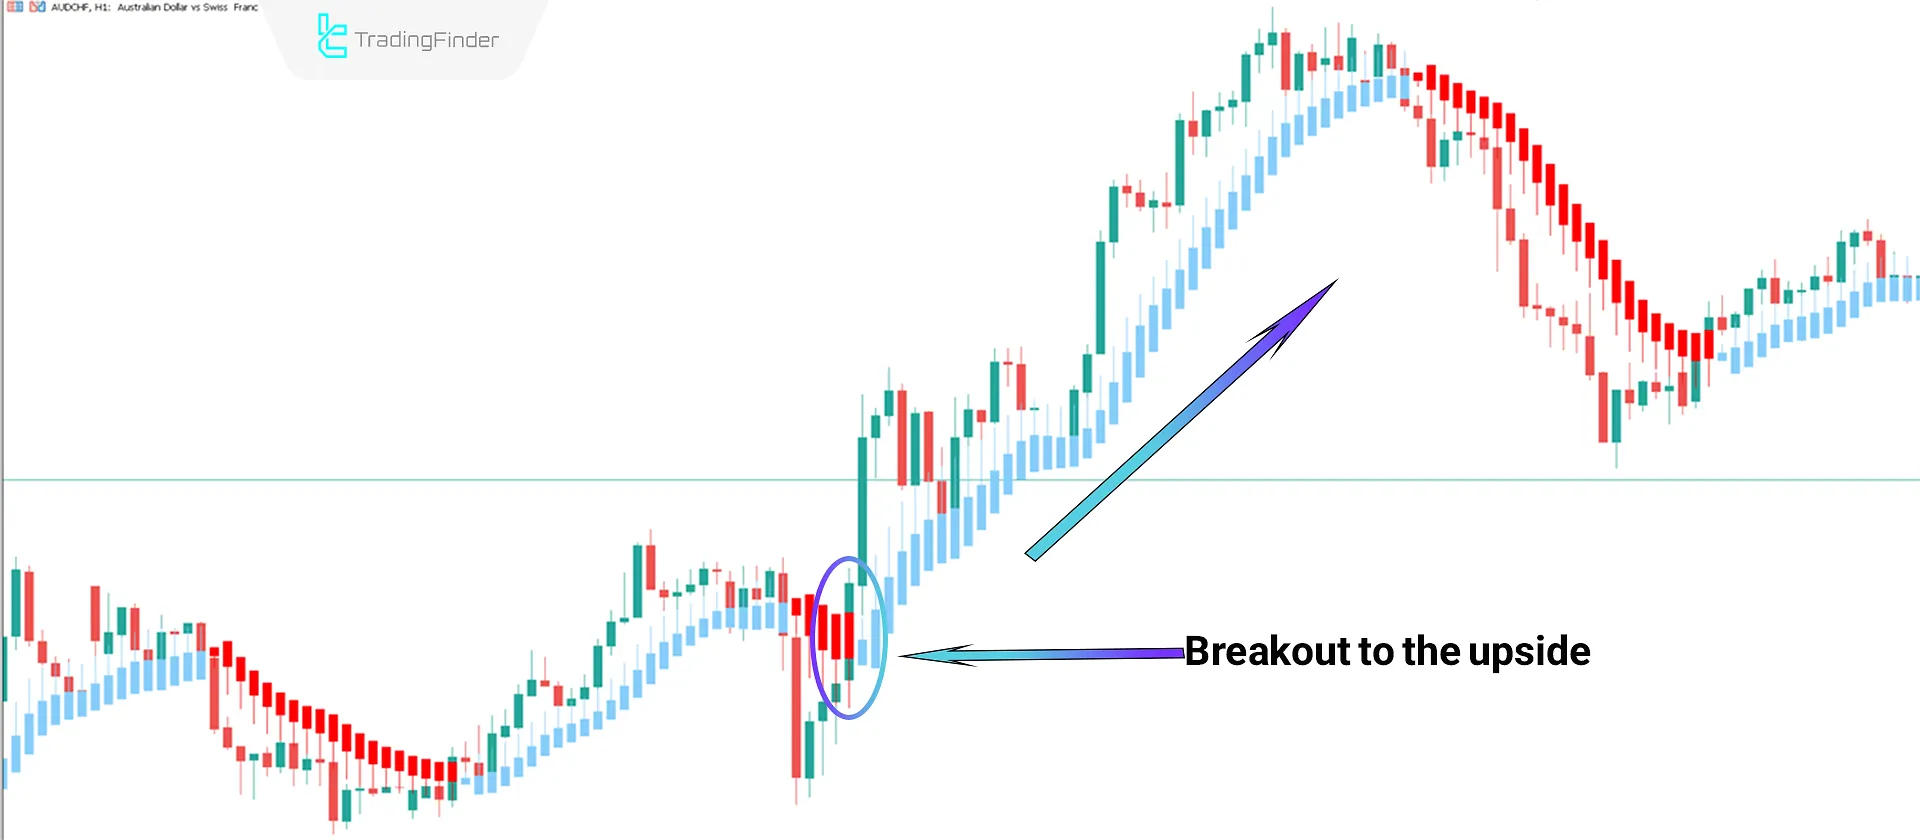
Based on the AUD/CHF price chart analysis on a 1-hour timeframe, the price has crossed above the Heiken Ashi (acting like a moving average) and is oscillating in higher regions.
As long as the price remains above the indicator and the Heiken Ashi candlesticks are blue, the trend is bullish, strengthening scenarios for entering Buy trades.

Bearish Trend Conditions
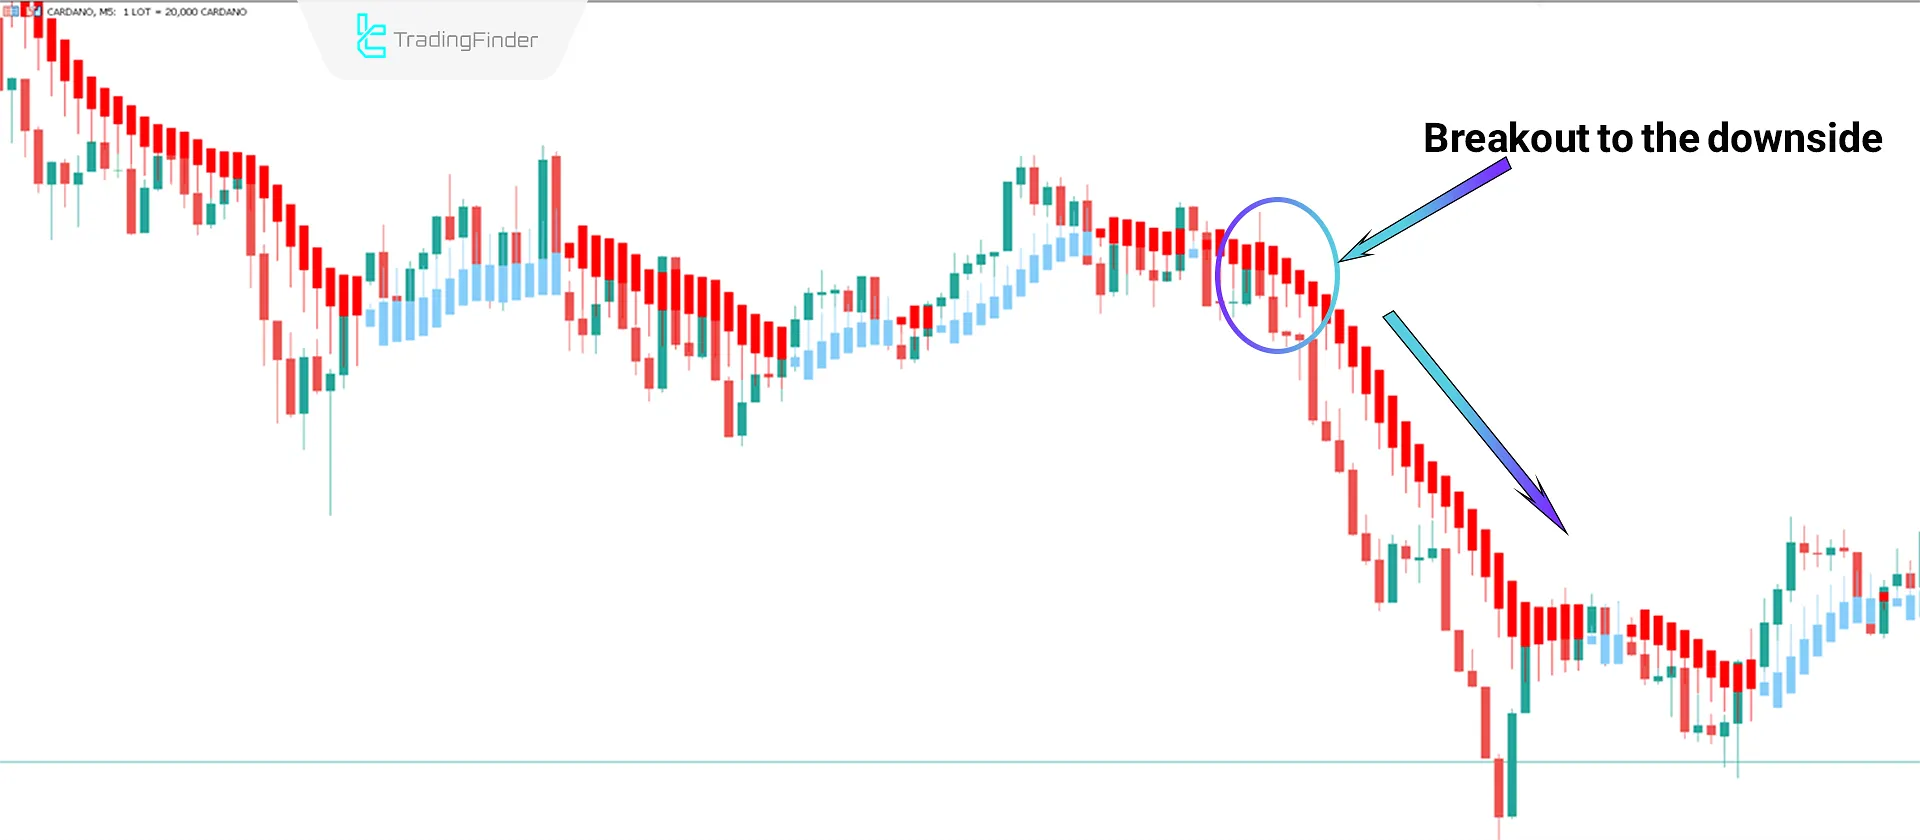
Based on the Cardano price chart analysis on a 5-minute timeframe, the price has crossed below the Heiken Ashi (acting like a moving average) and is oscillating in lower regions.
As long as the price remains below the indicator and the Heiken Ashi candlesticks are red, the trend is bearish, strengthening scenarios for entering Sell trades.

Indicator Settings

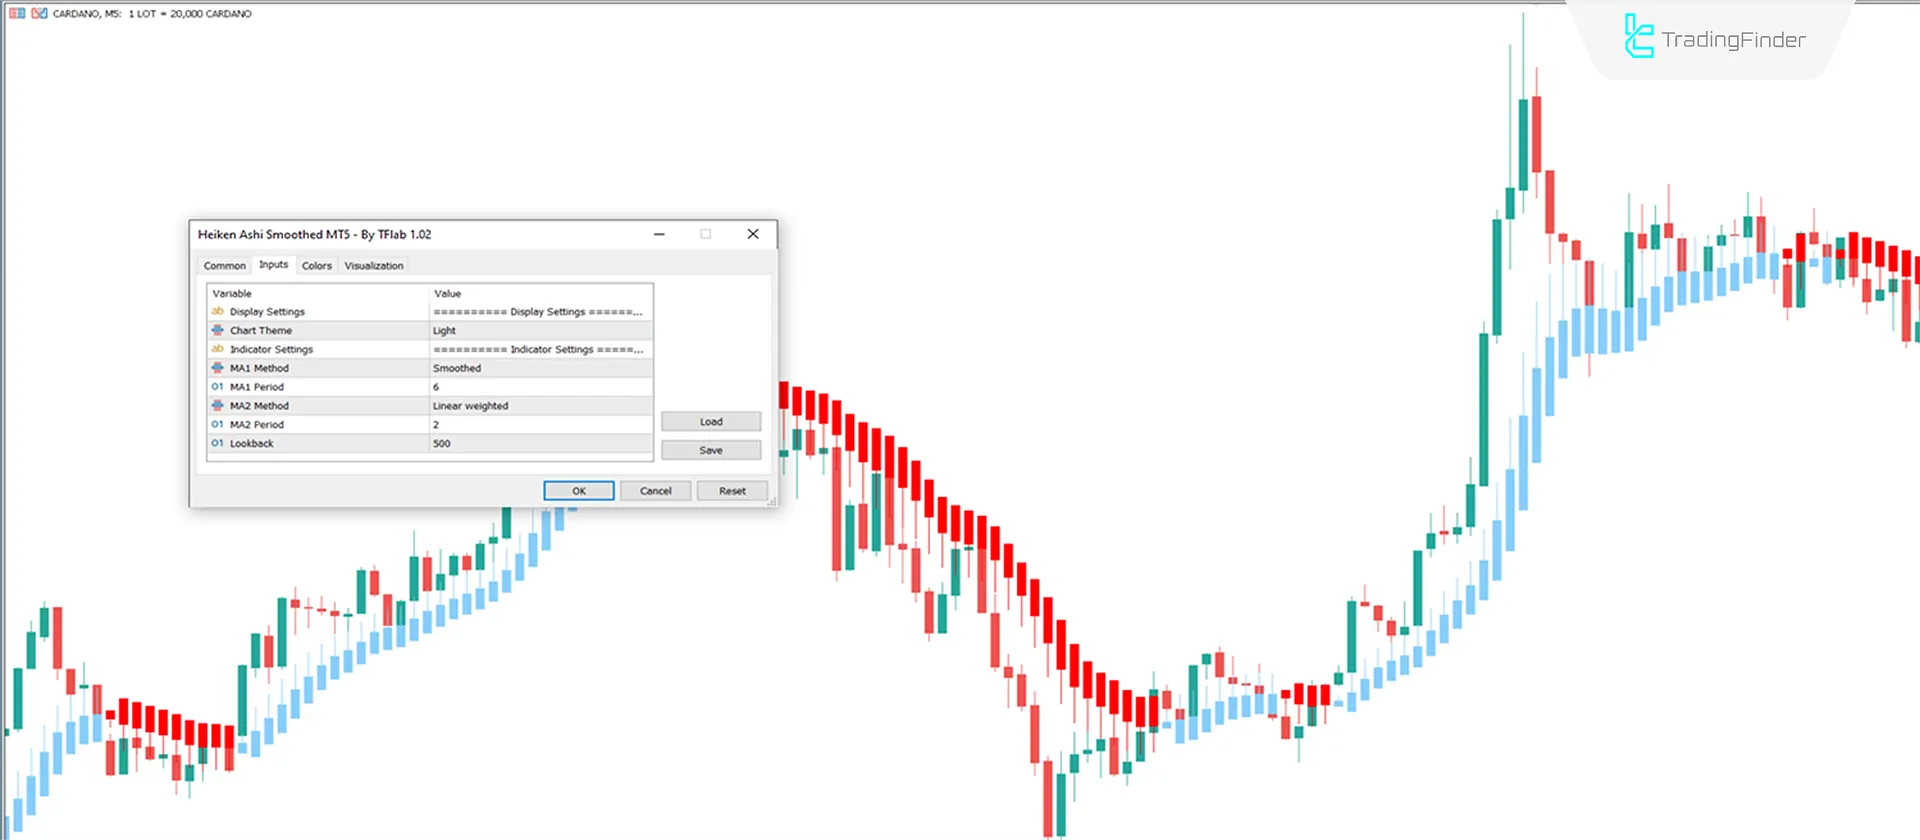
- Chart Theme Indicator theme;
- Ma Method 1 Calculation method of the first moving average;
- Ma Period 1 frame of the first moving average (6 periods);
- Ma Method 2 Calculation method of the second moving average;
- Ma Period 2 frame of the second moving average (2 periods);
- Look Back at the Number of candles for indicator calculation (500).
Conclusion
The Heiken Ashi Smoothed indicator is a valuable tool for analyzing price movements. It functions similarly to moving averages, and the price's crossing with it can be interpreted as a signal for trade entry.
Heiken Ashi candlesticks are displayed in blue during an uptrend, whereas in downtrends, their color changes to orange.Additionally, this trading tool is categorized under the candlestick indicators of MT5, making it a valuable resource for analyzing price trends effectively.
Heiken Ashi Smoothed MT5 PDF
Heiken Ashi Smoothed MT5 PDF
Click to download Heiken Ashi Smoothed MT5 PDFDoes this indicator directly issue trade entry signals?
No, but the price crossing with Heiken Ashi candlesticks can be considered a trade entry signal.
What is the difference between this indicator and its standard version?
The difference lies in their calculations. Furthermore, the standard Heiken Ashi indicator forms directly on the price, while the current indicator behaves like a moving average around the price.


