![Higher Highs and Lower Lows Stochastic Indicator MT5 Download - [TFlab]](https://cdn.tradingfinder.com/image/233332/13-67-en-higher-highs-lower-lows-stochastic-mt5-01.webp)
![Higher Highs and Lower Lows Stochastic Indicator MT5 Download - [TFlab] 0](https://cdn.tradingfinder.com/image/233332/13-67-en-higher-highs-lower-lows-stochastic-mt5-01.webp)
![Higher Highs and Lower Lows Stochastic Indicator MT5 Download - [TFlab] 1](https://cdn.tradingfinder.com/image/233334/13-67-en-higher-highs-lower-lows-stochastic-mt5-02.webp)
![Higher Highs and Lower Lows Stochastic Indicator MT5 Download - [TFlab] 2](https://cdn.tradingfinder.com/image/233323/13-67-en-higher-highs-lower-lows-stochastic-mt5-03.webp)
![Higher Highs and Lower Lows Stochastic Indicator MT5 Download - [TFlab] 3](https://cdn.tradingfinder.com/image/254643/13-67-en-higher-highs-lower-lows-stochastic-mt5-04.webp)
The HH & LL Stochastic Indicator uses two moving lines to depict price movements and potential trend reversal zones. It helps identify higher highs (HH) and lower lows (LL).
Additionally, this MT5 oscillator accurately determines overbought and oversold zones, enabling users to identify optimal trading entry points in the Forex market and other markets.
Indicator Specifications
The table below reviews the features and specifications of this indicator.
Indicator Categories: | Oscillators MT5 Indicators Volatility MT5 Indicators Trading Assist MT5 Indicators |
Platforms: | MetaTrader 5 Indicators |
Trading Skills: | Elementary |
Indicator Types: | Reversal MT5 Indicators |
Timeframe: | Multi-Timeframe MT5 Indicators |
Trading Style: | Intraday MT5 Indicators |
Trading Instruments: | Forex MT5 Indicators Crypto MT5 Indicators Stock MT5 Indicators |
Overview of the Indicator
The crossings and movements of the indicator's lines relative to each other determine the prevailing market trend. This tool's standout feature is its ability to identify overbought and oversold conditions.
When the blue line moves within the green zone, it indicates overbought conditions and presents a potential opportunity to consider sell trades. For buy signals, the reverse strategy is applicable.
Buy Signal
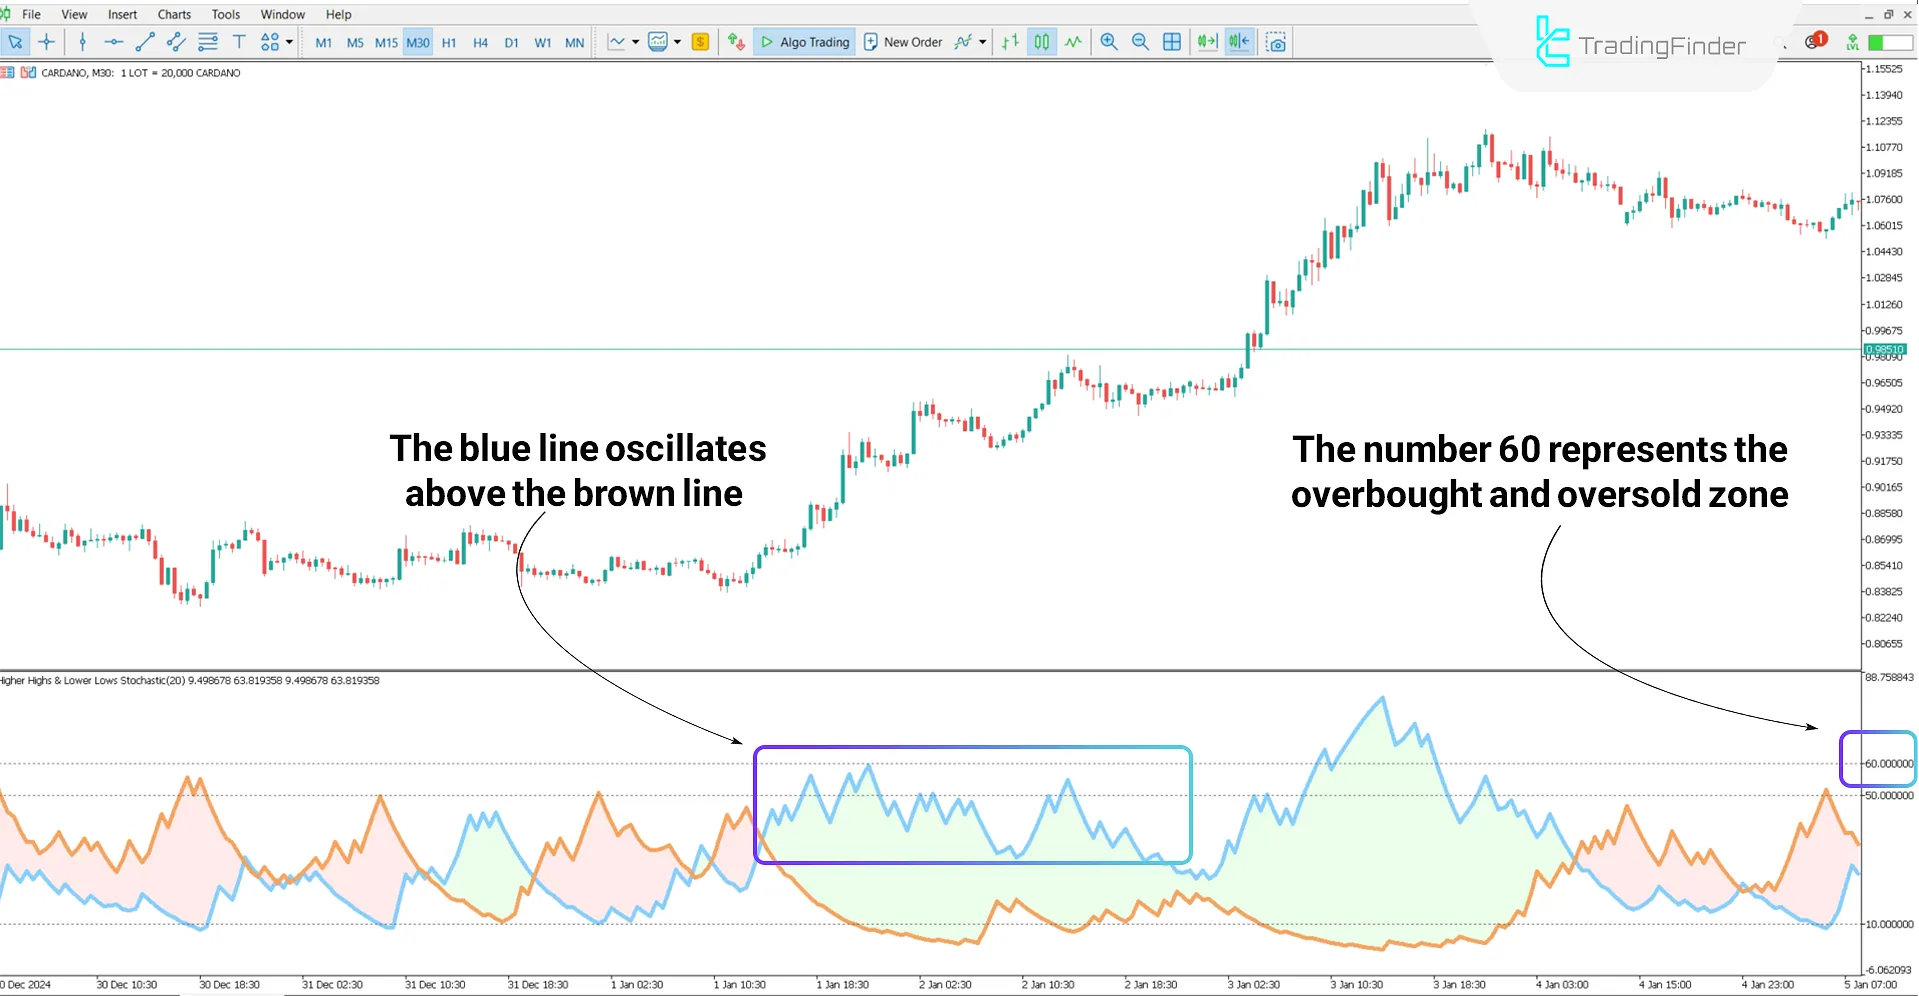
Analyzing the Cardano (ADA) cryptocurrency chart shows the brown line reaching the oversold zone, followed by a bullish trend.
Crossing the blue line with the brown line signals a potential buy entry, and the stable movement of the blue line above the brown line confirms the continuation of the bullish trend.

Sell Signal
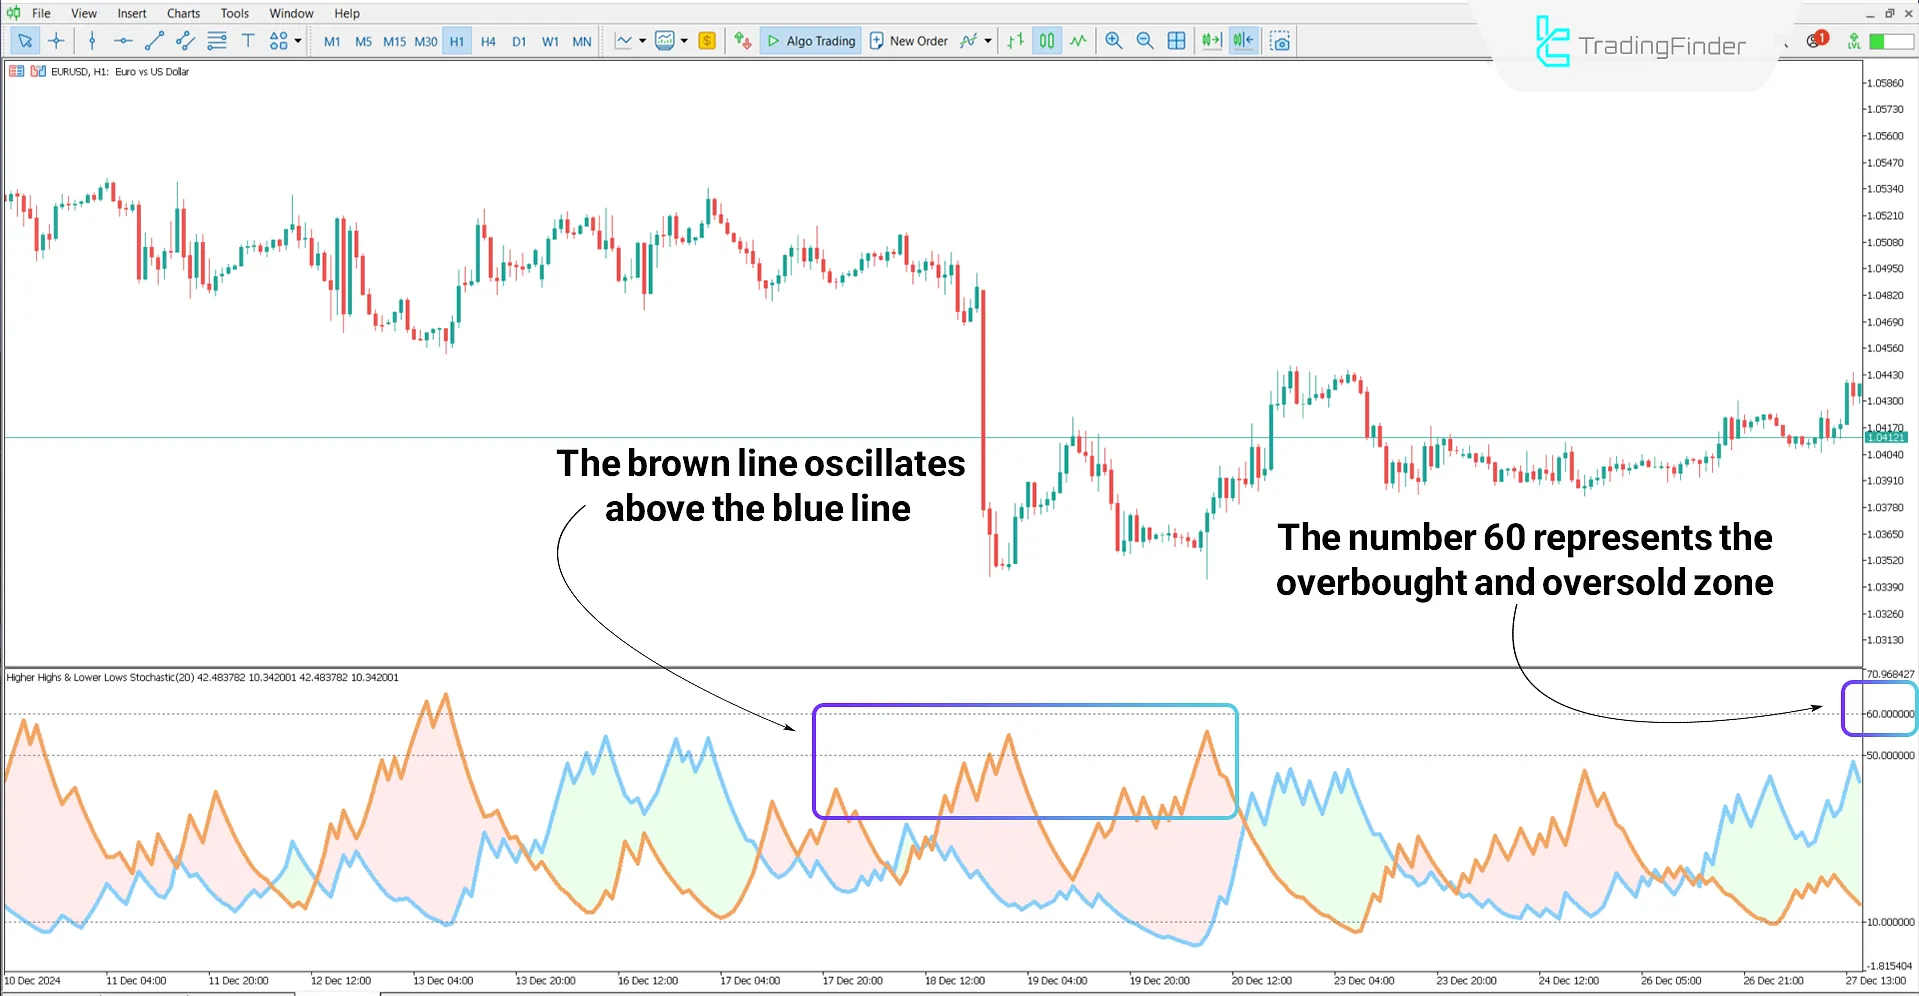
The 1-hour chart of the EUR/USD pair illustrates the performance of the Higher Highs and Lower Lows Indicator in generating sell signals.
In this scenario, the brown line oscillates more strongly above the blue line, and their crossing marks a notable entry point for sell trades.

Settings for the HH & LL Stochastic Indicator
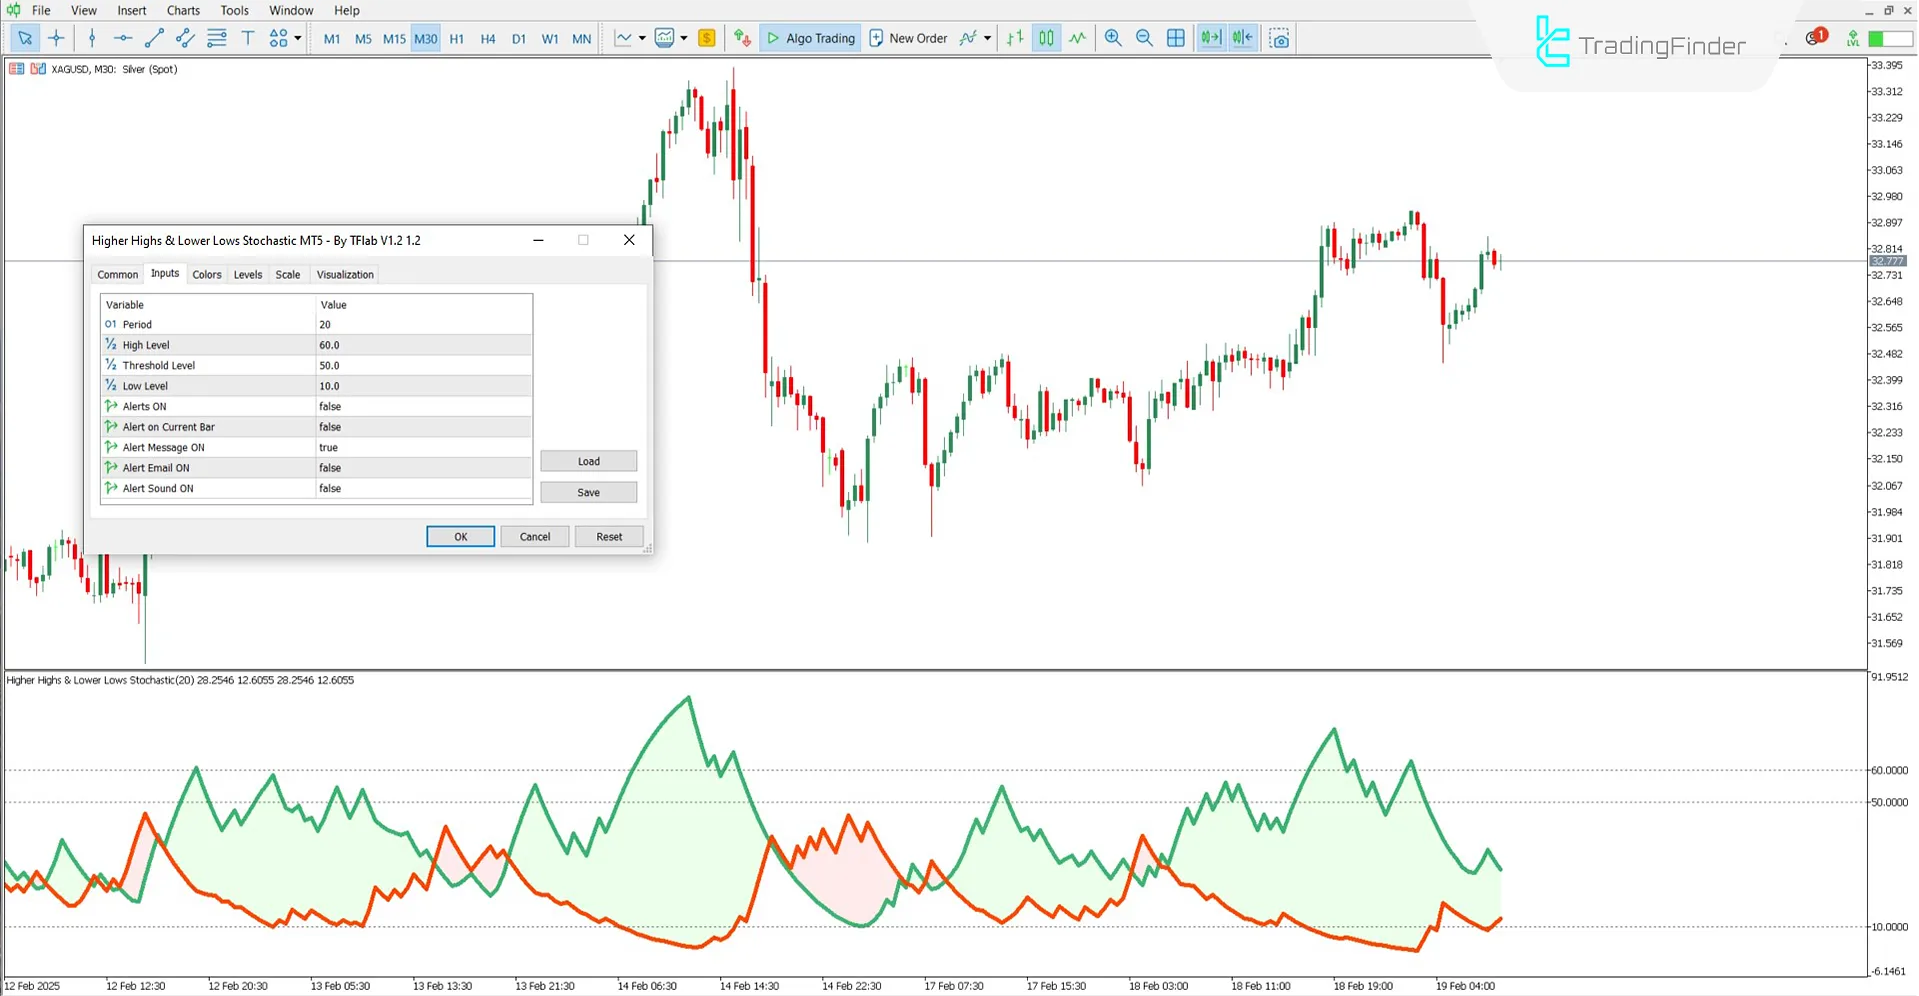
The technical specifications and customizable options for the HH & LL Stochastic Indicator are as follows:

- Period: Define the indicator time period
- High Level: Adjust the upper level of the indicator
- Threshold Level: Set the threshold level
- Low Level: Adjust the lower level of the indicator
- Alerts ON: Enable alerts
- Alert on Current Bar: Enable alerts for the current bar
- Alert Message ON: Enable message notifications
- Alert Sound ON: Enable sound notifications
- Alert Email ON: Enable email notifications
Note: In the new version of this indicator, the oscillator line colors have been changed from brown and blue to red and green, respectively.
Conclusion
The HH and LL Stochastic Indicator is used as an oscillator to identify overbought and oversold conditions on MT5.
This trading tool, analyzes the position and oscillation of its two primary lines to deliver effective signals for trade entries and exits.
Higher Highs Lower Lows MT5 PDF
Higher Highs Lower Lows MT5 PDF
Click to download Higher Highs Lower Lows MT5 PDFWhat is the HH & LL Stochastic Indicator?
It is an oscillator designed to identify price highs and lows and analyze overbought and oversold conditions.
Which markets is this indicator suitable for?
It suits all markets, including Forex, stocks, and cryptocurrencies.


