![Hidden Gap Volume Indicator for MetaTrader 5 Download - [TradingFinder]](https://cdn.tradingfinder.com/image/397328/2-72-en-hidden-gap-volume-mt5-1.webp)
![Hidden Gap Volume Indicator for MetaTrader 5 Download - [TradingFinder] 0](https://cdn.tradingfinder.com/image/397328/2-72-en-hidden-gap-volume-mt5-1.webp)
![Hidden Gap Volume Indicator for MetaTrader 5 Download - [TradingFinder] 1](https://cdn.tradingfinder.com/image/397320/2-72-en-hidden-gap-volume-mt5-2.webp)
![Hidden Gap Volume Indicator for MetaTrader 5 Download - [TradingFinder] 2](https://cdn.tradingfinder.com/image/397331/2-72-en-hidden-gap-volume-mt5-3.webp)
![Hidden Gap Volume Indicator for MetaTrader 5 Download - [TradingFinder] 3](https://cdn.tradingfinder.com/image/397332/2-72-en-hidden-gap-volume-mt5-4.webp)
The Hidden Gap Volume Indicator is a technical analysis tool for MetaTrader 5 that calculates the average volume of the last 20 pivots and draws a band around it based on two standard deviations.
Each volume bar in this oscillator is categorized based on comparison with previous volumes and the deviation band, and is displayed in one of six defined colors:
- Red: the lowest volume within the observed range
- Yellow: volume lower than the previous candle
- Purple: volume lower than the average of the two previous candles
- Blue: volume higher than the previous candle
- Brown: volume exceeding the upper deviation band
- Green: out of band, but volume lower than the previous candle
Hidden Gap Volume Specifications Table
The table below outlines the features and specifications of the Hidden Gap Volume Indicator:
Indicator Categories: | Volume MT5 Indicators Oscillators MT5 Indicators Candle Sticks MT5 Indicators |
Platforms: | MetaTrader 5 Indicators |
Trading Skills: | Intermediate |
Indicator Types: | Trend MT5 Indicators Reversal MT5 Indicators |
Timeframe: | Multi-Timeframe MT5 Indicators |
Trading Style: | Intraday MT5 Indicators |
Trading Instruments: | Forex MT5 Indicators Crypto MT5 Indicators Stock MT5 Indicators Commodity MT5 Indicators Indices MT5 Indicators Share Stock MT5 Indicators |
Indicator Overview
In the Hidden Gap Volume Indicator, yellow and purple bars signal volume weakening in continuation of price moves and are recognized as hidden gaps in the trend direction.
Additionally, brown bars, which exceed the volume deviation band, highlight overbought or oversold zones, suggesting a high likelihood of reversal or correction.
Uptrend Conditions
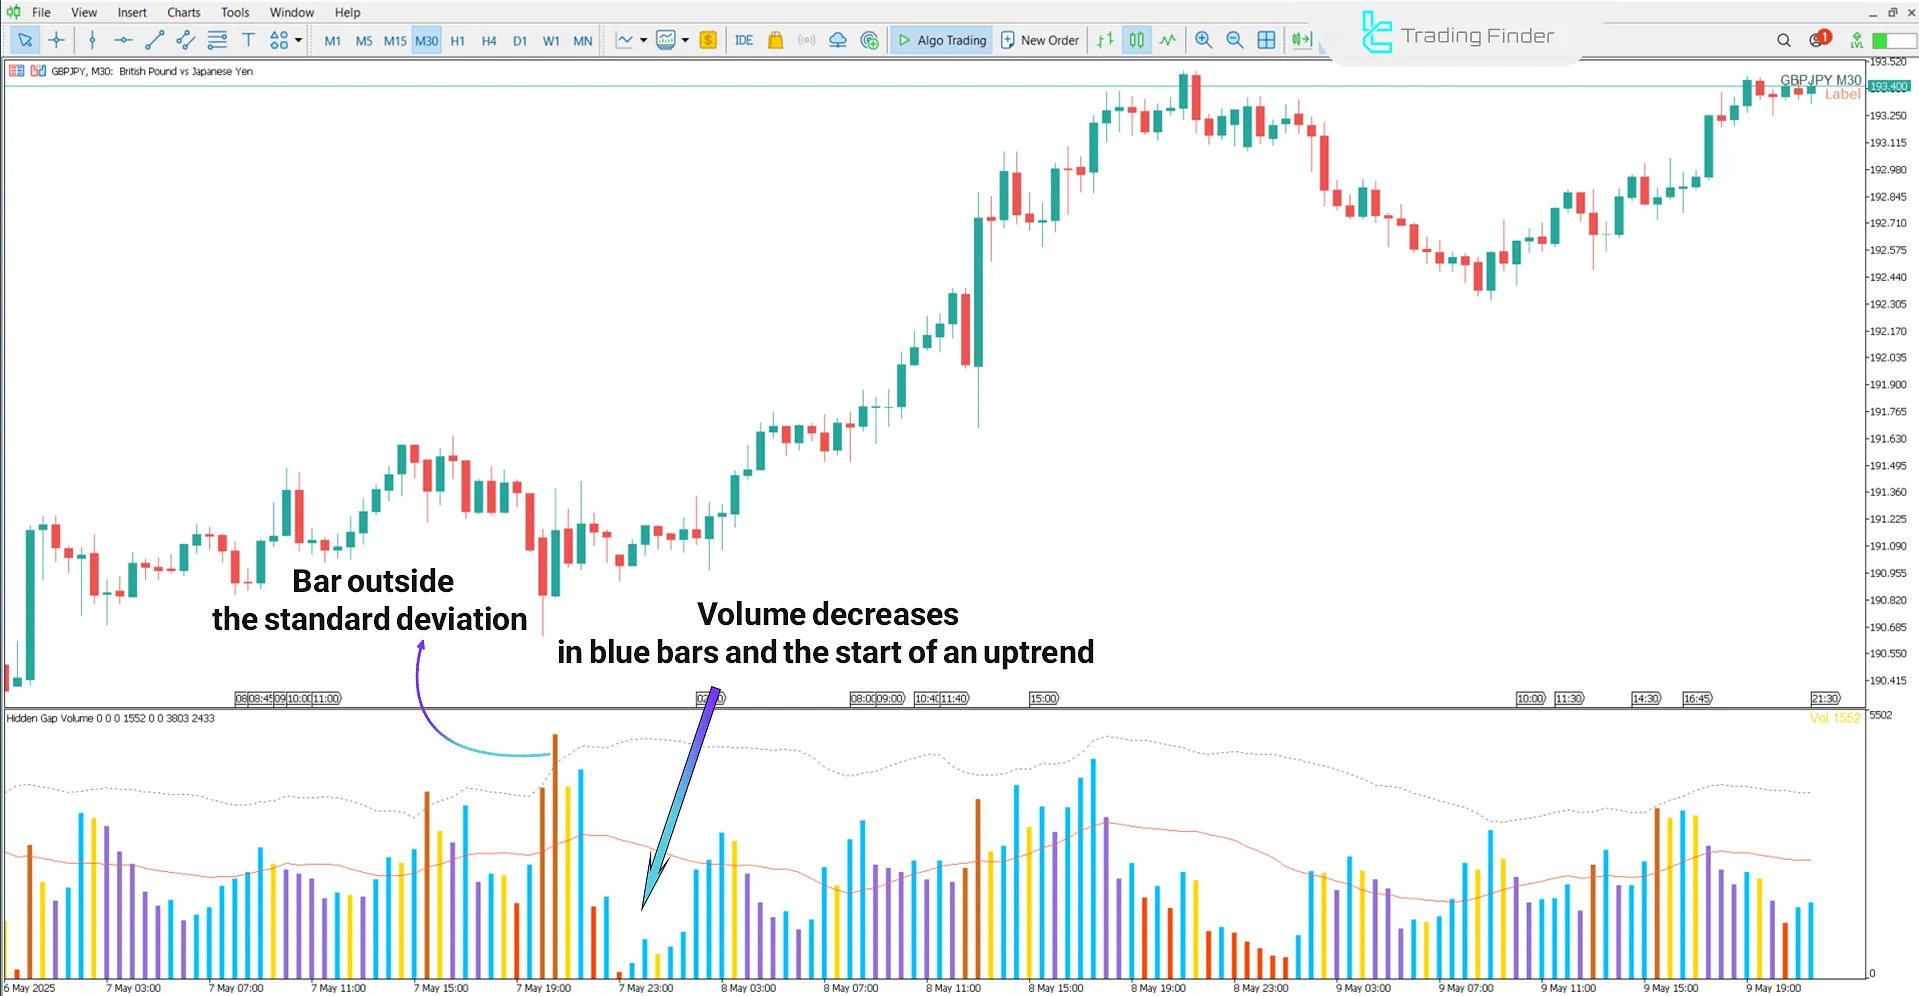
The image below shows the GBP/JPY currency pair on the 30-minute timeframe. In uptrends, blue bars indicate rising volume and buyer pressure.
If a new high forms without volume support and yellow or purple bars appear, this indicates a hidden volume gap, signaling a potential buy zone.

Downtrend Conditions
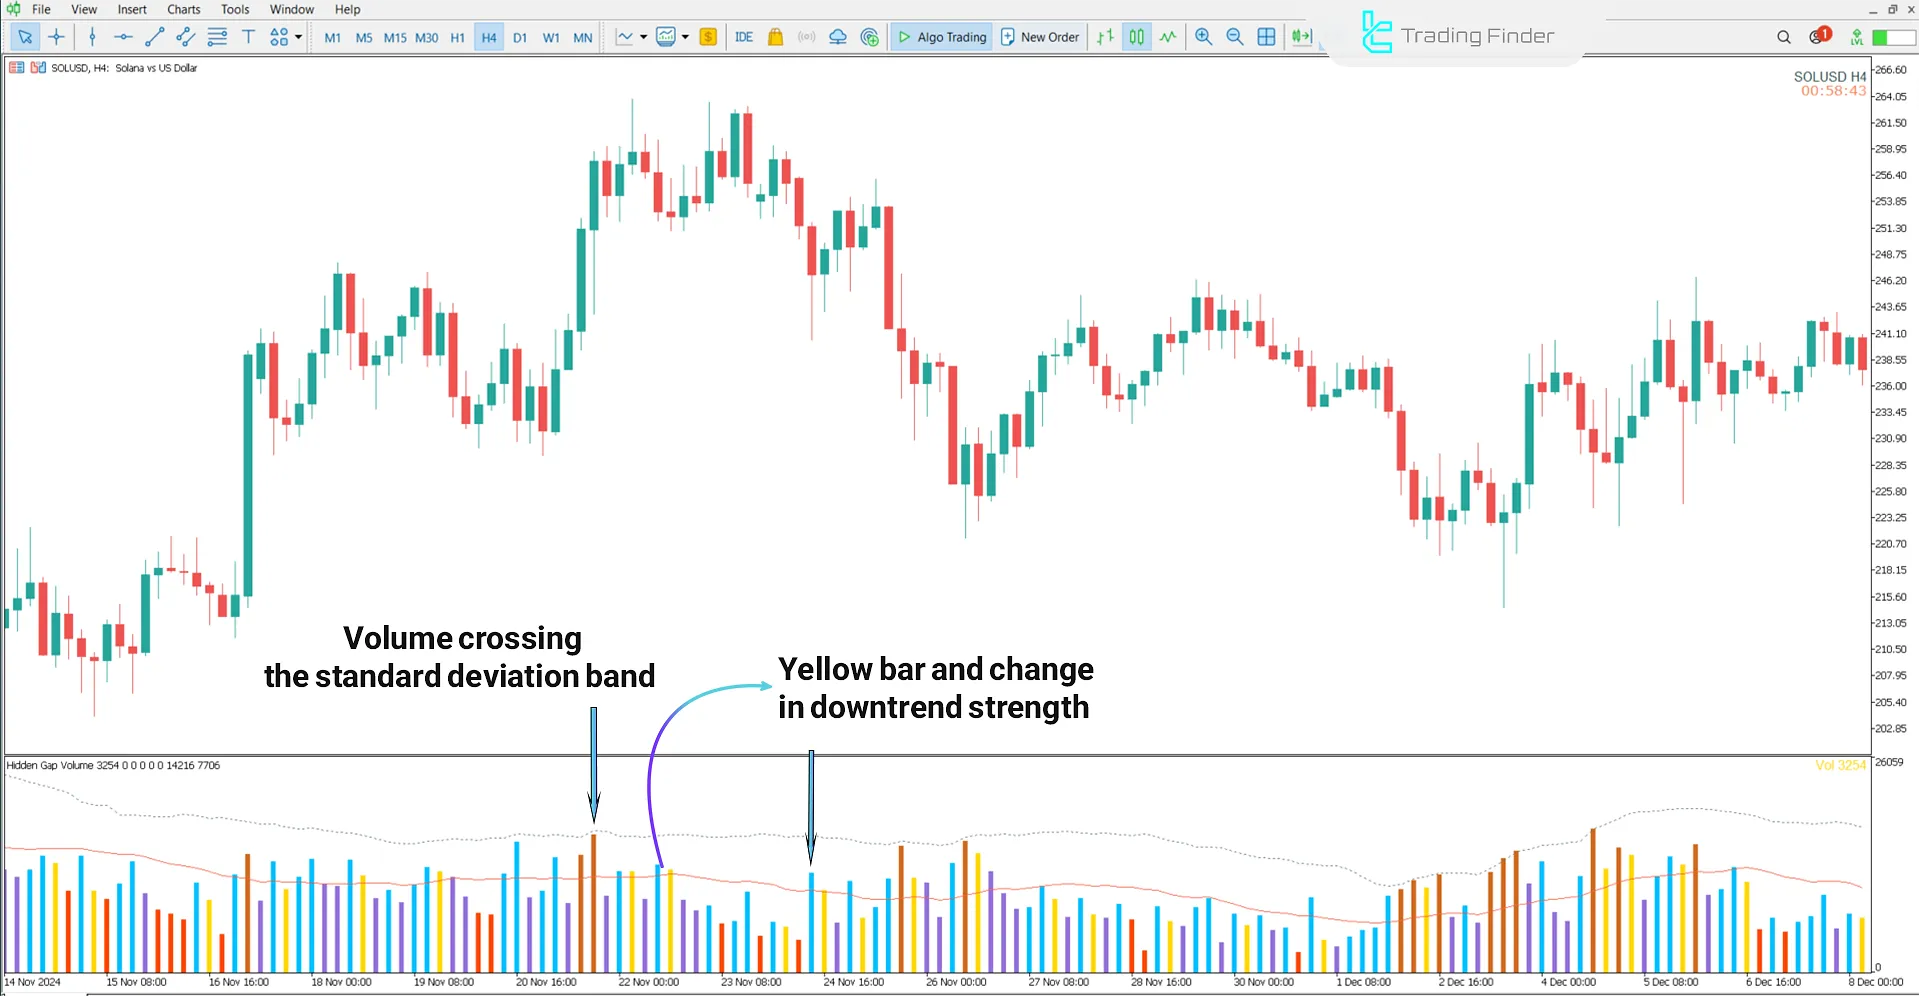
The following 4-hour Solana (SOL) chart illustrates volume behavior in a downtrend.
In this setup, blue bars represent increasing volume, selling pressure, and a favorable condition for entering short positions.

Hidden Gap Volume Indicator Settings
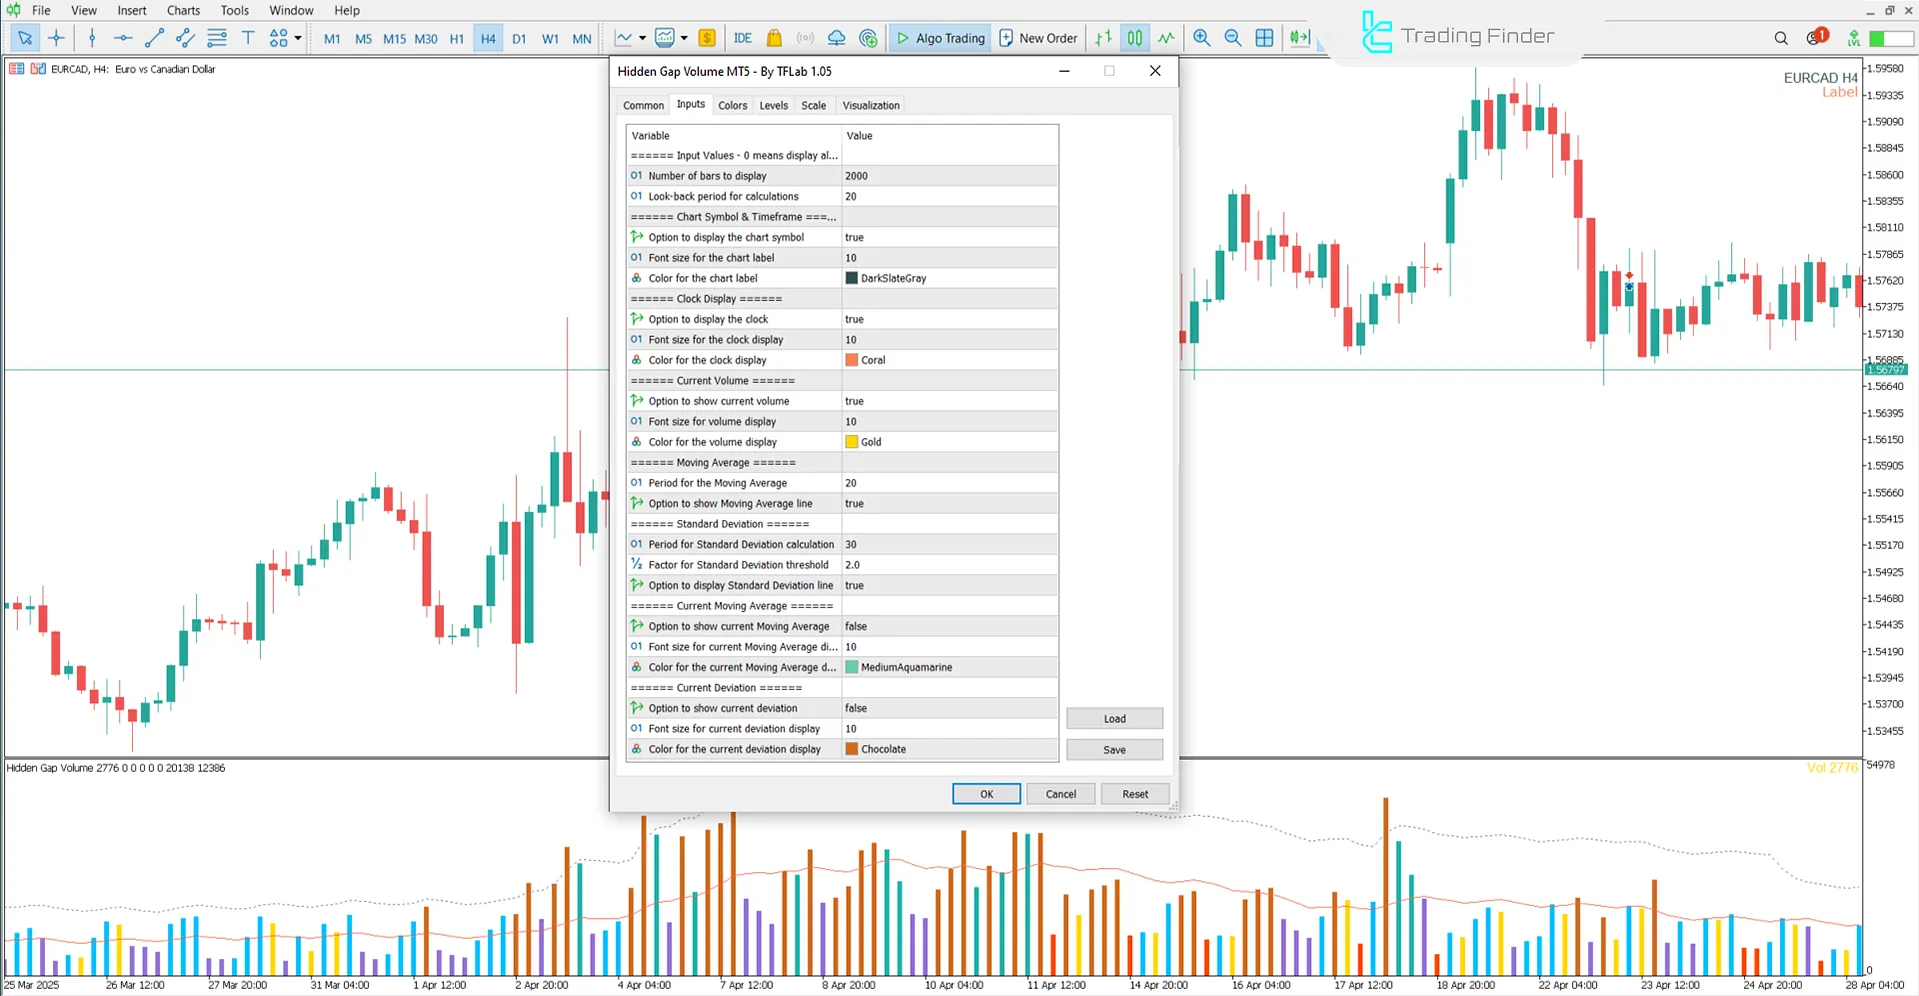
The image below displays the settings panel for the Hidden Gap Volume Indicator on the MetaTrader 5 platform:

- Number of bars to display: Display range
- Look back period for calculations: Calculation window length
- Option to display the chart symbol: Enable chart symbol overlay
- Font size for the chart label: Chart label text size
- Color for the chart label: Chart label color
- Option to display the clock: Show current time on chart:
- Font size for the clock display: Clock text size
- Color for the clock display: Clock text color
- Option to show current volume: Display real-time volume data
- Font size for volume display: Volume label font size
- Color for the volume display: Volume color
- Period for the Moving Average: Moving Average period length
- Option to show Moving Average line: Display MA line on chart
- Period for Std Dev calculation: Standard Deviation lookback period
- Factor for Std Dev threshold: Threshold multiplier for Std Dev
- Option to display Std Dev line: Show deviation boundaries
- Option to show current MA: Show current MA value
- Font size for current MA display: Text size for MA value display
- Color for current MA display: MA value color
- Option to show current deviation: Display live deviation value
- Font size for current deviation: Font size for deviation label
- Color for current deviation: Deviation label color
Conclusion
The Hidden Gap Volume Indicator analyzes volume reduction near tops and bottoms and detects volume saturation zones via brown bars, helping determine entry and exit zones with high accuracy.
Hidden Gap Volume MT5 PDF
Hidden Gap Volume MT5 PDF
Click to download Hidden Gap Volume MT5 PDFDoes the Hidden Gap Volume Indicator help identify trend reversals?
Yes. When a new high or low is formed but volume declines (yellow or purple bars), the chance of a trend reversal increases.
What is the best timeframe for using the Hidden Gap Volume Indicator?
This indicator works on all timeframes but is more accurate on mid-term timeframes (15 minutes to 4 hours).


