![HMA Megatrend Indicator for MT5 Download – Free – [TradingFinder]](https://cdn.tradingfinder.com/image/430177/13-143-en-hma-megatrend-mt5-01.webp)
![HMA Megatrend Indicator for MT5 Download – Free – [TradingFinder] 0](https://cdn.tradingfinder.com/image/430177/13-143-en-hma-megatrend-mt5-01.webp)
![HMA Megatrend Indicator for MT5 Download – Free – [TradingFinder] 1](https://cdn.tradingfinder.com/image/430147/13-143-en-hma-megatrend-mt5-02.webp)
![HMA Megatrend Indicator for MT5 Download – Free – [TradingFinder] 2](https://cdn.tradingfinder.com/image/430149/13-143-en-hma-megatrend-mt5-03.webp)
![HMA Megatrend Indicator for MT5 Download – Free – [TradingFinder] 3](https://cdn.tradingfinder.com/image/430148/13-143-en-hma-megatrend-mt5-04.webp)
On July 6, 2025, in version 2, alert/notification and signal functionality was added to this indicator
The HMA Megatrend Indicator, based on the Hull Moving Average, is designed to provide more precise trend detection compared to classic moving averages.
While traditional averages often lag, this indicator uses a smoothing algorithm to filter out false market fluctuations and more accurately identify the real direction of price movement.
It features a dynamic color changing line, which appears green during uptrends and red during downtrends.
HMA Megatrend Oscillator Specifications
The table below outlines the specifications of the HMA Megatrend Indicator:
Indicator Categories: | Oscillators MT5 Indicators Signal & Forecast MT5 Indicators Trading Assist MT5 Indicators |
Platforms: | MetaTrader 5 Indicators |
Trading Skills: | Elementary |
Indicator Types: | Reversal MT5 Indicators |
Timeframe: | Multi-Timeframe MT5 Indicators |
Trading Style: | Swing Trading MT5 Indicators Scalper MT5 Indicators Day Trading MT5 Indicators |
Trading Instruments: | Forex MT5 Indicators Crypto MT5 Indicators Stock MT5 Indicators Commodity MT5 Indicators Indices MT5 Indicators Share Stock MT5 Indicators |
HMA Megatrend at a Glance
One of the main features of the HMA Megatrend Oscillator is its ability to generate buy and sell signals.
A transition from downtrend to uptrend is marked with a gray arrow, while a shift from uptrend to downtrend is indicated by a pink arrow, offering timely alerts for entering or exiting trades.
Buy Signal
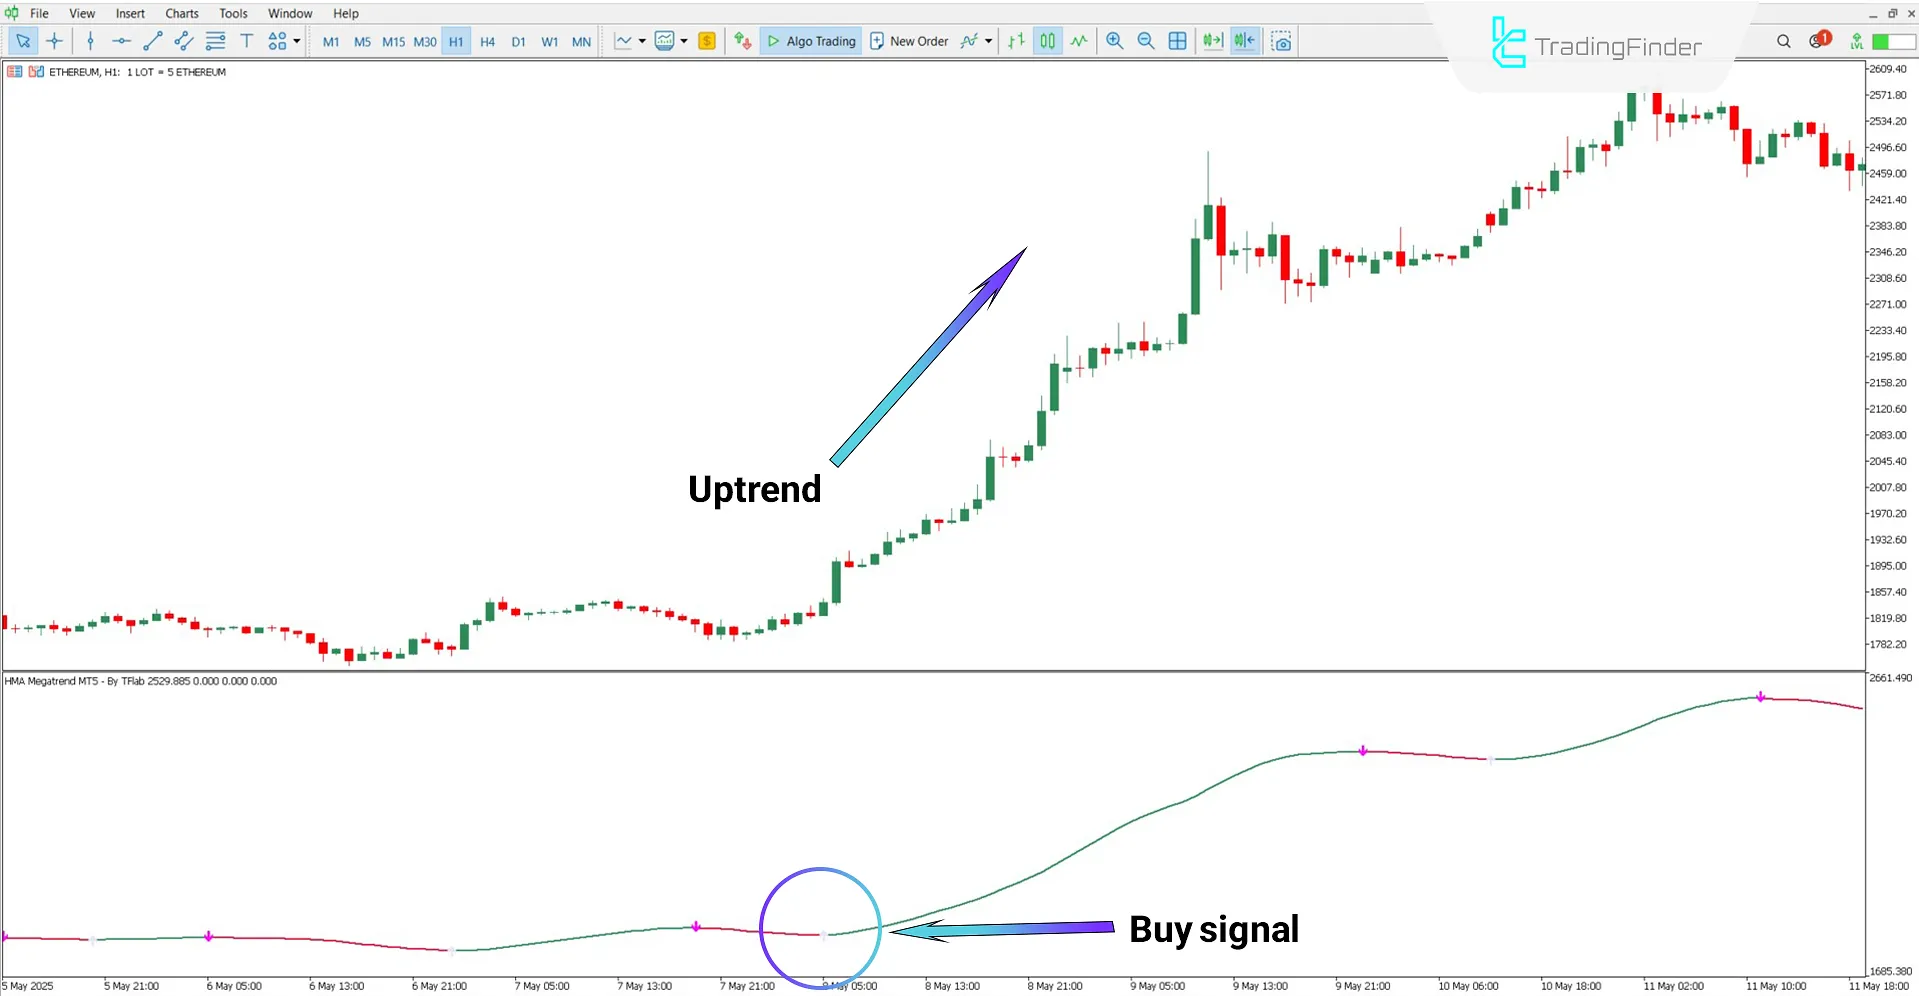
On the 1-hour chart of Ethereum (ETH), a color change from red to green in the indicator line indicates the start of a bullish trend.
This trend reversal is marked with a gray arrow, signaling a potential buy entry.

Sell Signal
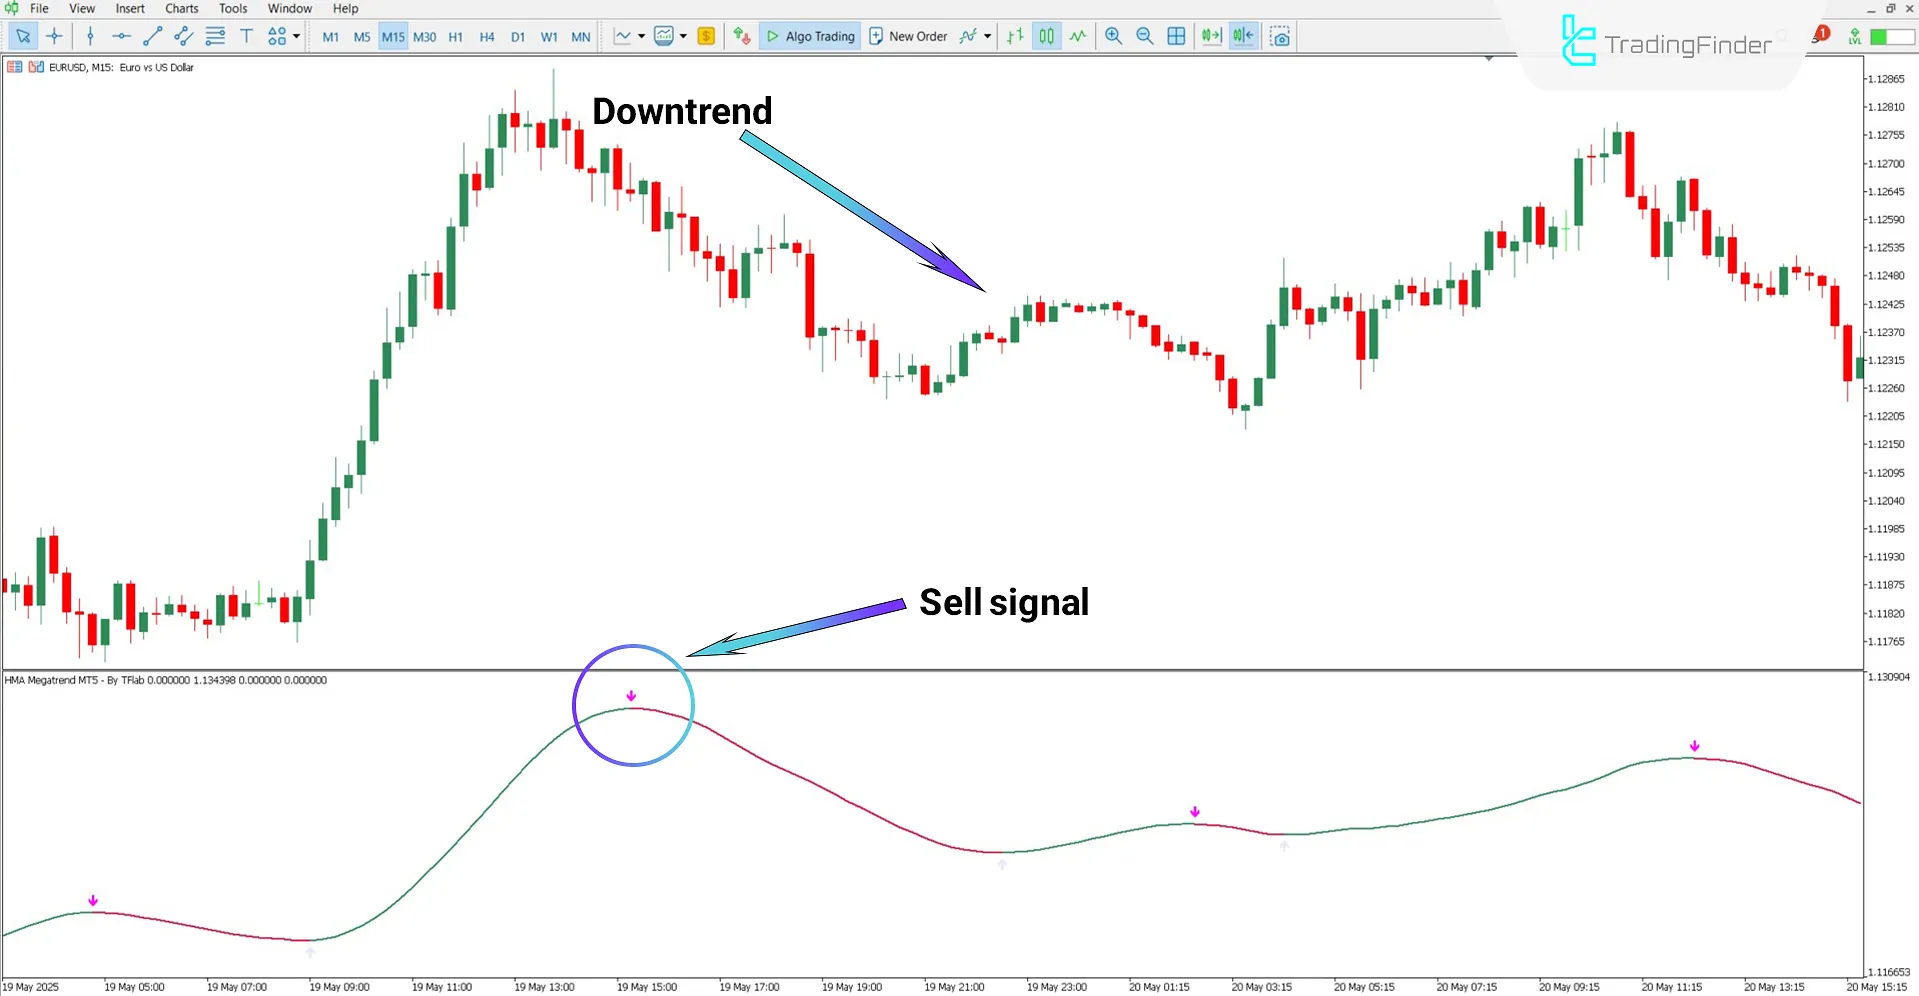
In the 1-hour chart of EUR/USD, a color shift from green to red in the indicator line indicates the beginning of a bearish trend.
The indicator marks this turning point with an arrow, providing a sell signal.

HMA Megatrend Oscillator Settings
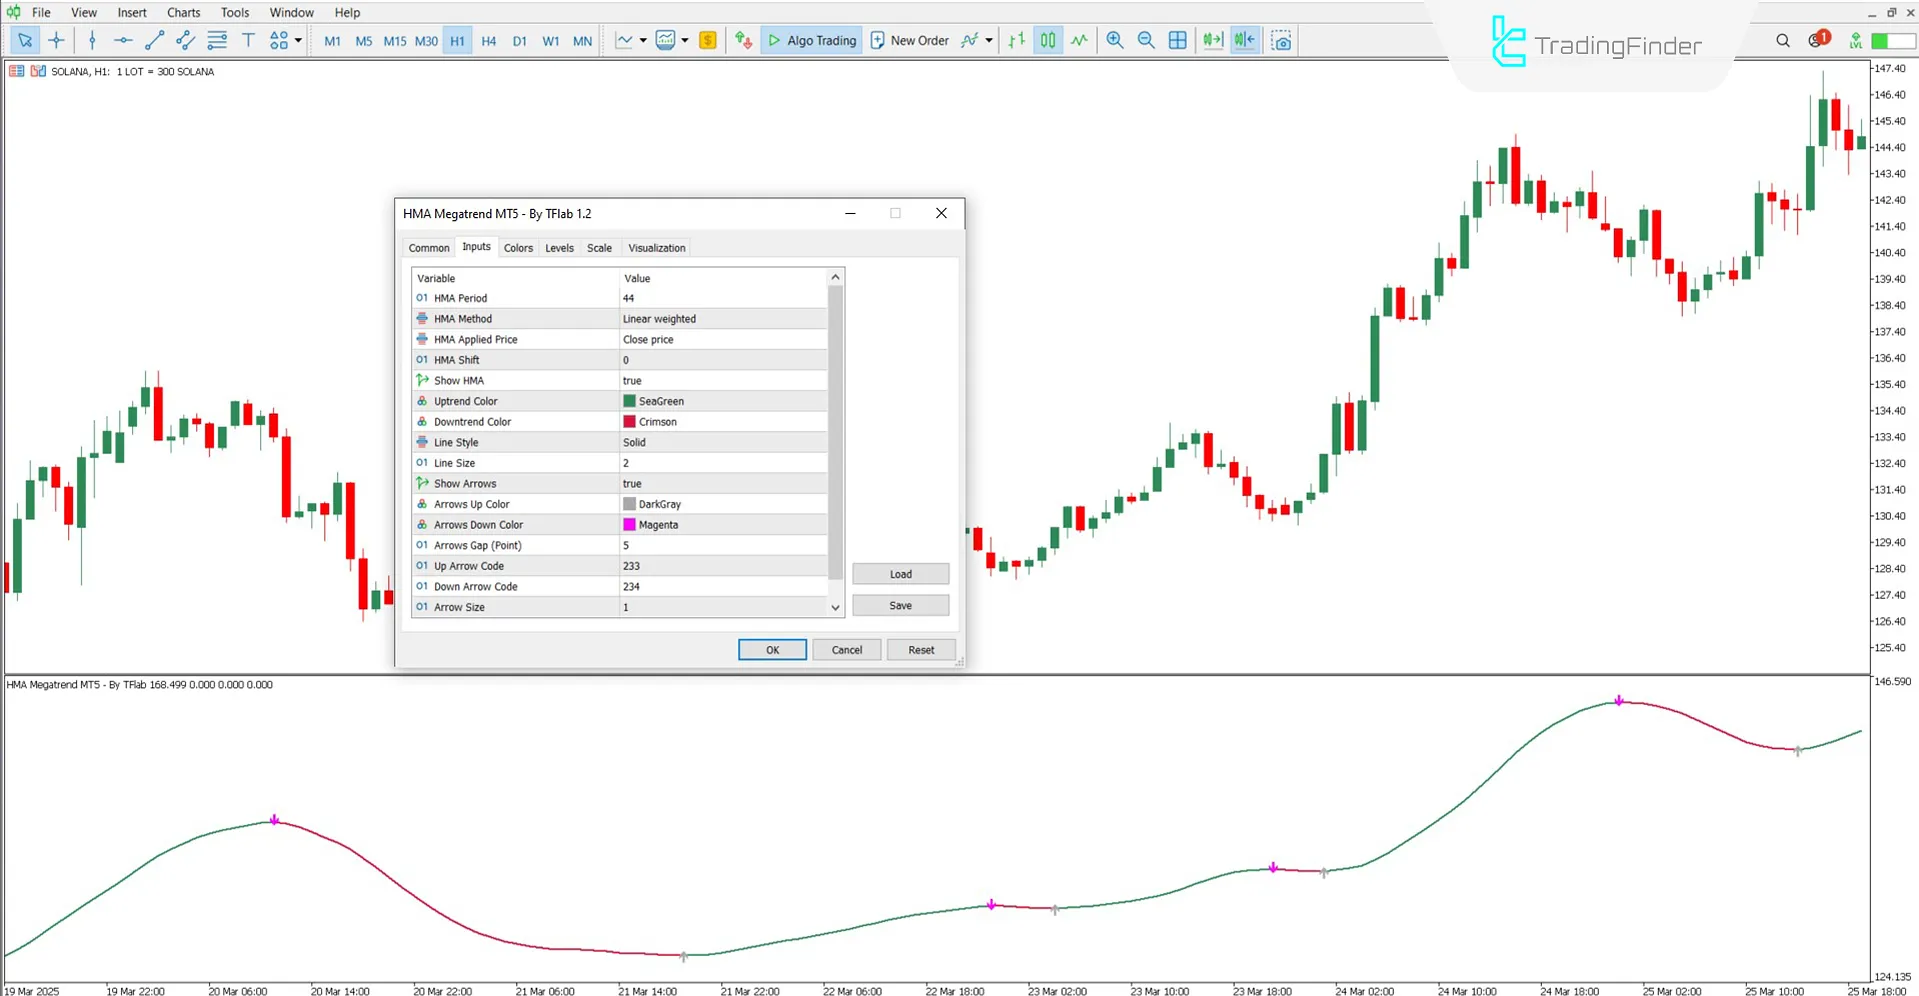
The settings of the HMA Megatrend Indicator are as follows:

- HMAPeriod: Hull Moving Average period
- HMAmethod: Type of moving average used
- HMAPrice: Price type used for the calculation
- HMAshift: Shift value of the HMA line
- ShowHMA: Toggle to show or hide the HMA line
- TrendUP: Color of the HMA line during an uptrend
- TrendDN: Color of the HMA line during a downtrend
- Style: Display the style of the line
- Size: Thickness of the HMA line on the chart
- ShowArrows: Enable or disable buy/sell signal arrows on the chart
- ColorUP: Color of the buy signal arrow
- ColorDN: Color of the sell signal arrow
- ArrowsGap: Vertical distance of the arrow from the line
- CodeUP: Code of the upward arrow
- CodeDN: Code of the downward arrow
- ArrSize: Size of the signal arrows
Conclusion
The HMA Megatrend Indicator, powered by a smoothing algorithm, filters out random price noise and presents the main market trend with greater clarity.
What sets this trading tool apart is its combination of a color changing dynamic line and buy/sell arrows, offering traders a clear and visual representation of trend direction and entry opportunities.
HMA Megatrend MT5 PDF
HMA Megatrend MT5 PDF
Click to download HMA Megatrend MT5 PDFWhich timeframes is the HMA Megatrend Oscillator suitable for?
This indicator is multi-timeframe and can be used across all time intervals.
Is the HMA Megatrend Indicator usable across all markets?
Yes, it can be used in Forex, cryptocurrencies, stocks, and other financial markets.


