![HRLR & LRLR ICT Indicator for MetaTrader 5 Download - Free - [TFlab]](https://cdn.tradingfinder.com/image/194996/4-37-en-hrlr-lrlr-ict-mt5-1.webp)
![HRLR & LRLR ICT Indicator for MetaTrader 5 Download - Free - [TFlab] 0](https://cdn.tradingfinder.com/image/194996/4-37-en-hrlr-lrlr-ict-mt5-1.webp)
![HRLR & LRLR ICT Indicator for MetaTrader 5 Download - Free - [TFlab] 1](https://cdn.tradingfinder.com/image/194979/4-37-en-hrlr-lrlr-ict-mt5-2.webp)
![HRLR & LRLR ICT Indicator for MetaTrader 5 Download - Free - [TFlab] 2](https://cdn.tradingfinder.com/image/194988/4-37-en-hrlr-lrlr-ict-mt5-3.webp)
![HRLR & LRLR ICT Indicator for MetaTrader 5 Download - Free - [TFlab] 3](https://cdn.tradingfinder.com/image/194978/4-37-en-hrlr-lrlr-ict-mt5-4.webp)
The HRLR (High Resistance Liquidity Run) and LRLR (Low Resistance Liquidity Run) indicators in MetaTrader 5 indicators are designed to analyze price behavior in liquidity zones based on the ICT methodology.
The HRLR emerges after forming the lowest low and gathering liquidity; at this point, the price initiates a new upward movement. With the successive formation of higher lows and higher highs, this movement ultimately establishes an efficient upward trend.
Conversely, the LRLR represents the movement of short-term highs toward liquidity zones with lower resistance. In this scenario, the price advances in a structured manner by forming higher lows, eventually reaching new peaks.
Specifications of the HRLR & LRLR Indicator
The table below provides details of the HRLR & LRLR ICT indicator:
Indicator Categories: | Support & Resistance MT5 Indicators Levels MT5 Indicators ICT MT5 Indicators |
Platforms: | MetaTrader 5 Indicators |
Trading Skills: | Advanced |
Indicator Types: | Breakout MT5 Indicators Reversal MT5 Indicators |
Timeframe: | Multi-Timeframe MT5 Indicators |
Trading Style: | Day Trading MT5 Indicators |
Trading Instruments: | Forex MT5 Indicators Crypto MT5 Indicators Stock MT5 Indicators Forward MT5 Indicators Share Stock MT5 Indicators |
Indicator at a Glance
This indicator identifies HRLR (High-Resistance Liquidity Movement) and tracks the targeted area as long as the price consistently creates higher short-term lows and highs. However, as soon as one of the short-term lows is broken, the indicator quickly identifies a new low and evaluates the trend continuation based on this new low.
Indicator in an Uptrend
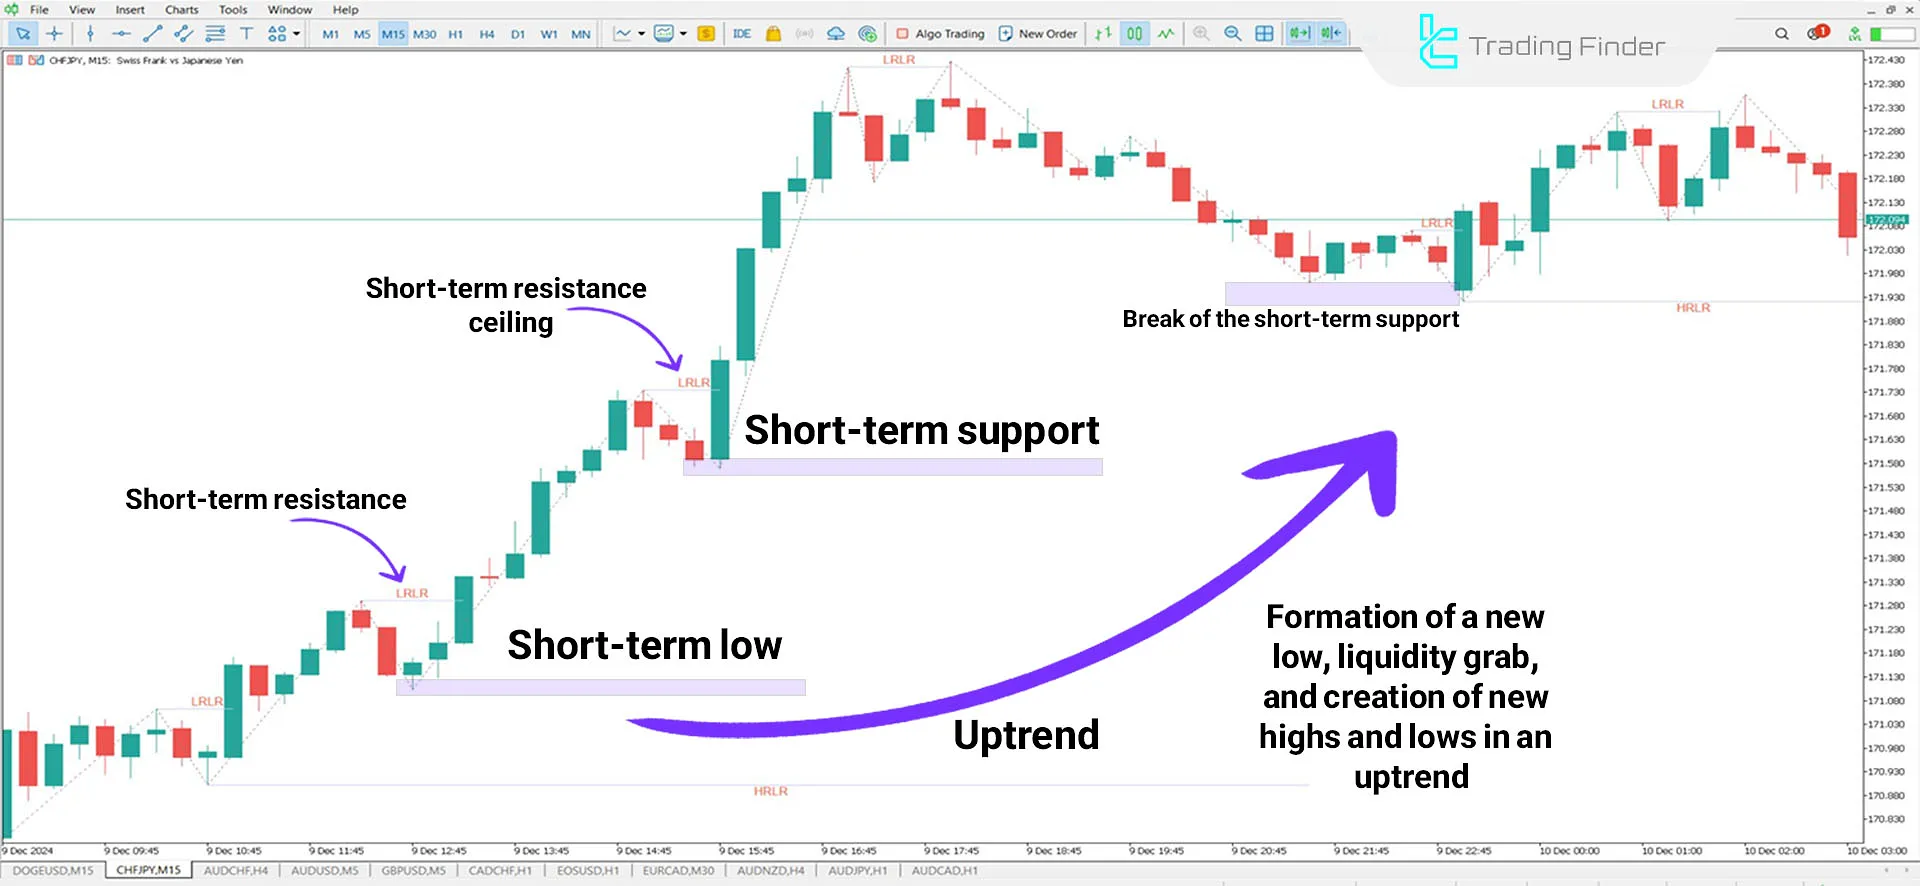
The CHF/JPY currency pair chart demonstrates that after forming HRLR (High-Resistance Liquidity Movement), the price entered an uptrend, consistently creating new lows and highs.
Under these conditions, traders can focus on this key area and enter buy positions based on strong candlestick patterns, such as pin bars or powerful bullish candles.

Indicator in a Downtrend
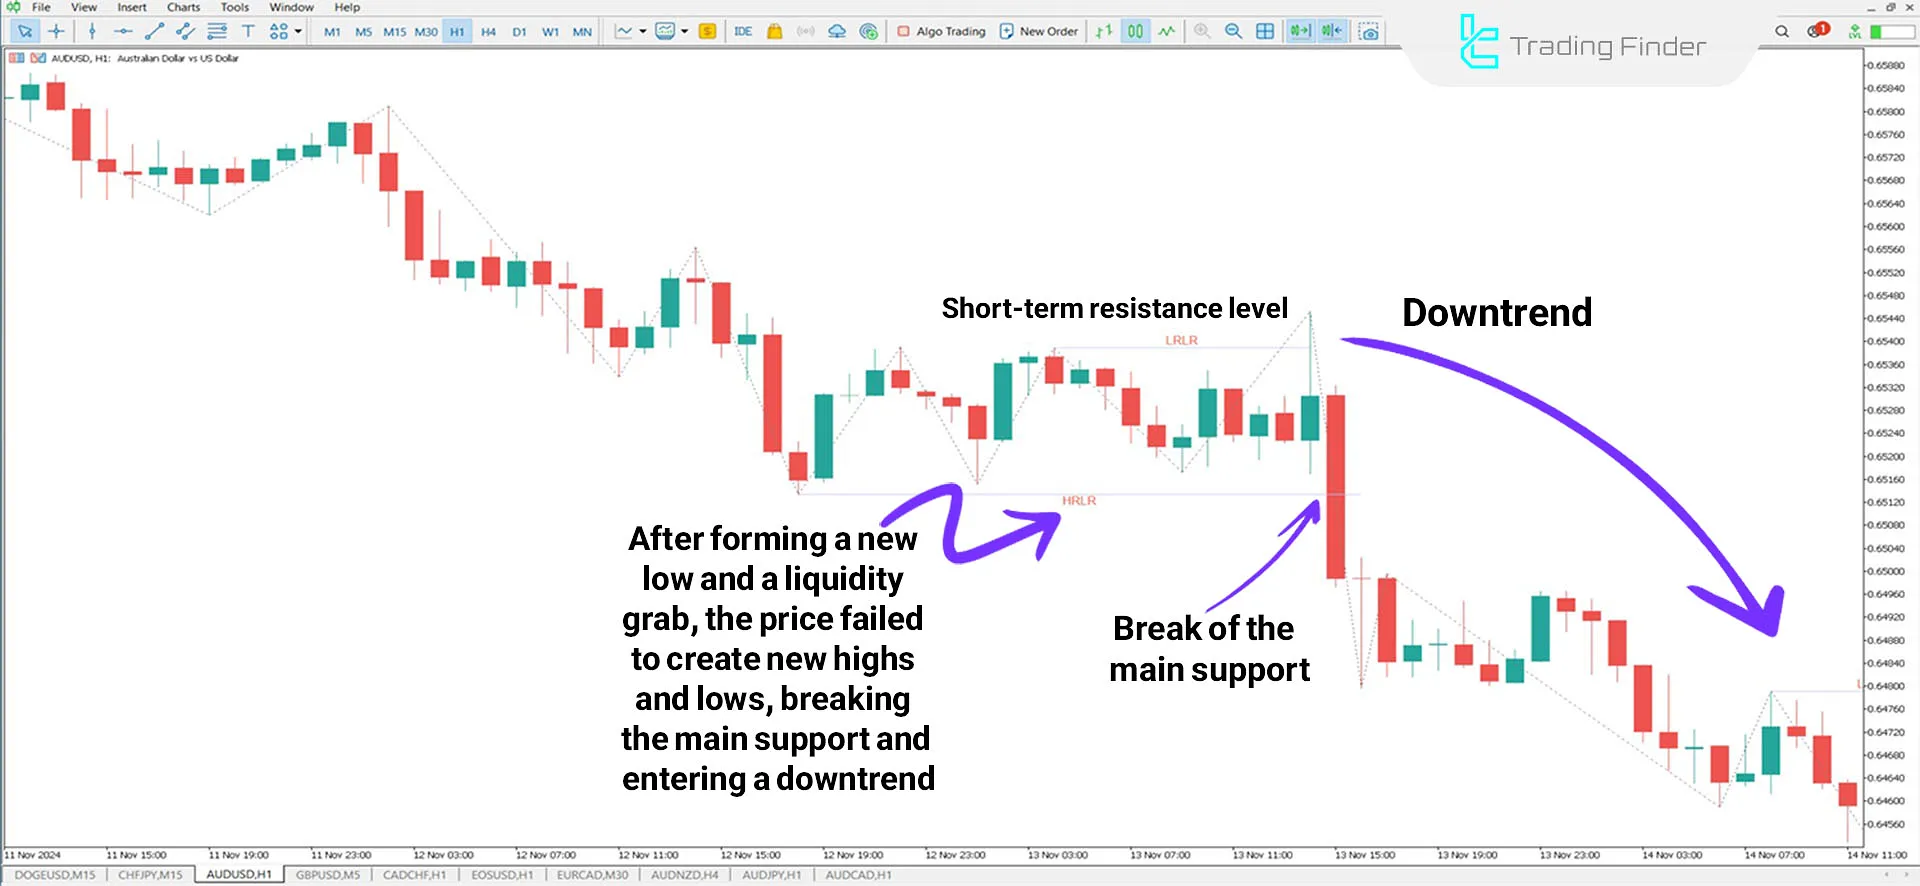
After liquidity absorption, the price moved upward in a limited manner, but after creating two temporary support levels and failing to form higher highs and lows, it shifted into a downtrend following the break of the last support level.

Settings for the HRLR & LRLR Indicator
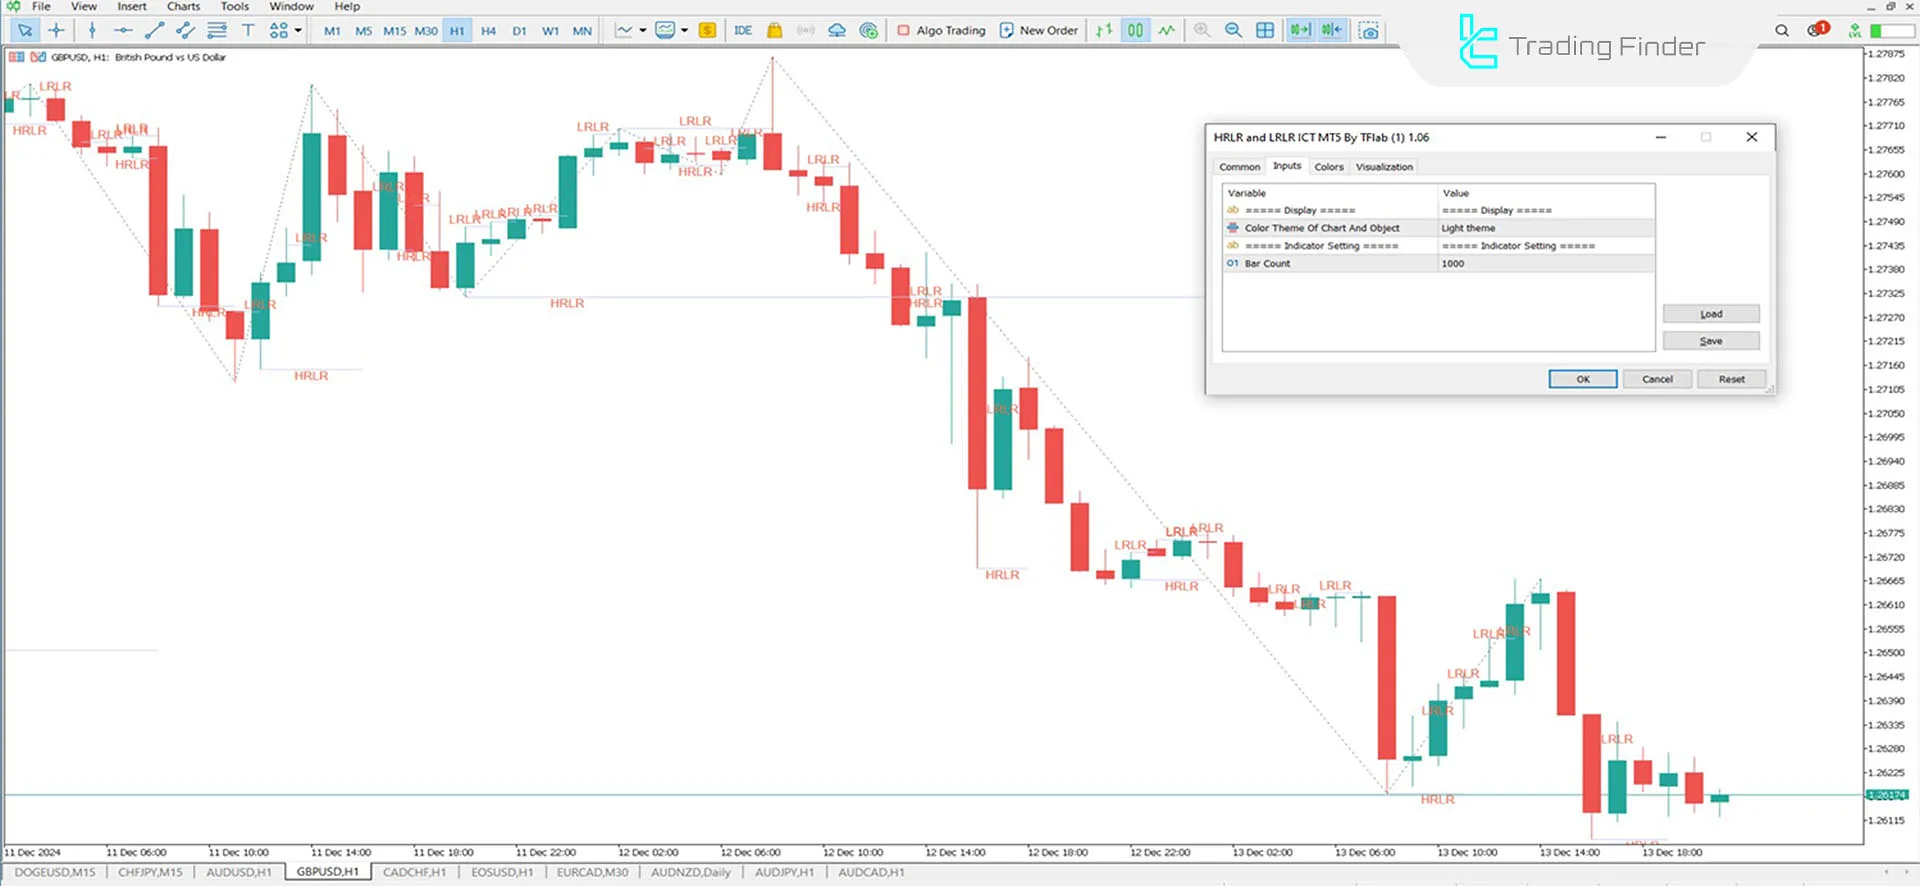
The image below shows a complete description of the indicator settings, which includes [Display and Indicator Setting]:

- Color Theme Of Chart And Object: Indicator background theme.
- Bar Count: Calculation of reversal candlesticks for displaying the indicator.
Conclusion
The HRLR and LRLR indicators are used to determine profit targets in trades, as the price reaches these zones with less effort, increasing the likelihood of success in such trades. However, in HRLR zones, such as old lows or highs, achieving the target often requires more time and may depend on fundamental events like NFP or FOMC announcements.
HRLR LRLR ICT MT5 PDF
HRLR LRLR ICT MT5 PDF
Click to download HRLR LRLR ICT MT5 PDFWhat are the HRLR and LRLR indicators?
The HRLR (High-Resistance Liquidity Movement) and LRLR (Low-Resistance Liquidity Movement) indicators are designed based on the ICT style and are used to analyze price behavior in liquidity areas.
What is the application of HRLR?
HRLR is used in upward movements after forming a long-term low, and the trend continues by forming higher highs and lows.


