![I-Sadukey Indicator for MT5 Download – Free – [TradingFinder]](https://cdn.tradingfinder.com/image/451166/13-144-en-i-sadukey-mt5-01.webp)
![I-Sadukey Indicator for MT5 Download – Free – [TradingFinder] 0](https://cdn.tradingfinder.com/image/451166/13-144-en-i-sadukey-mt5-01.webp)
![I-Sadukey Indicator for MT5 Download – Free – [TradingFinder] 1](https://cdn.tradingfinder.com/image/451165/13-144-en-i-sadukey-mt5-02.webp)
![I-Sadukey Indicator for MT5 Download – Free – [TradingFinder] 2](https://cdn.tradingfinder.com/image/451186/13-144-en-i-sadukey-mt5-03.webp)
The I-Sadukey Indicator uses colored bars of varying lengths to identify price momentum and direction directly on the chart. This trading tool applies to various markets, including forex, cryptocurrencies, stocks, and commodities.
I-Sadukey Indicator Specifications Table
The technical specifications of the I-Sadukey Indicator are outlined in the table below.
Indicator Categories: | Signal & Forecast MT5 Indicators Currency Strength MT5 Indicators Trading Assist MT5 Indicators |
Platforms: | MetaTrader 5 Indicators |
Trading Skills: | Elementary |
Indicator Types: | Reversal MT5 Indicators |
Timeframe: | Multi-Timeframe MT5 Indicators |
Trading Style: | Swing Trading MT5 Indicators Scalper MT5 Indicators Day Trading MT5 Indicators |
Trading Instruments: | Forex MT5 Indicators Crypto MT5 Indicators Stock MT5 Indicators |
I-Sadukey Indicator at a Glance
This indicator highlights market trend direction and suitable entry zones for buy or sell trades based on changes in the histogram bar colors. Typically, red bars indicate upward movement, while blue bars reflect a downtrend. The height of the bars indicates the strength and momentum of the current market trend.
Uptrend
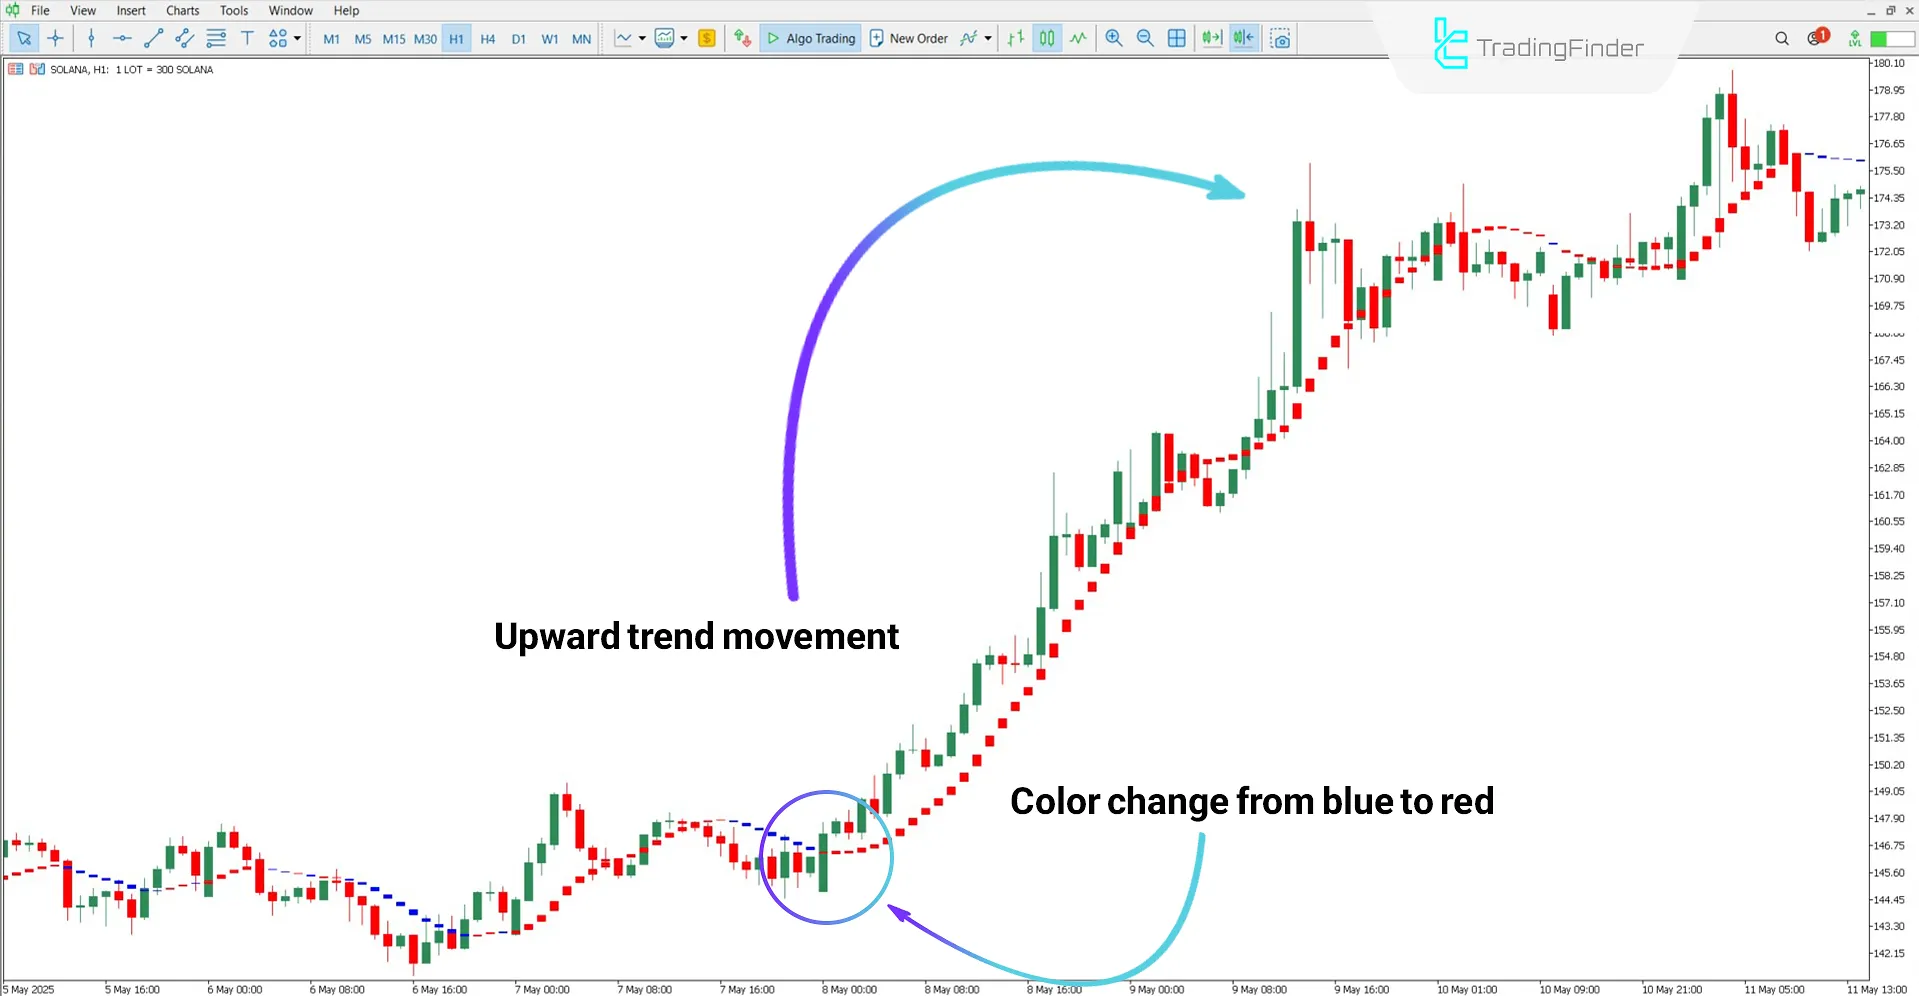
Based on the Solana cryptocurrency chart on the 1-hour timeframe, the histogram color shift displays the beginning of an uptrend after a downward move. The color transition from blue to red can be interpreted as an initial signal for entering a buy position.

Downtrend
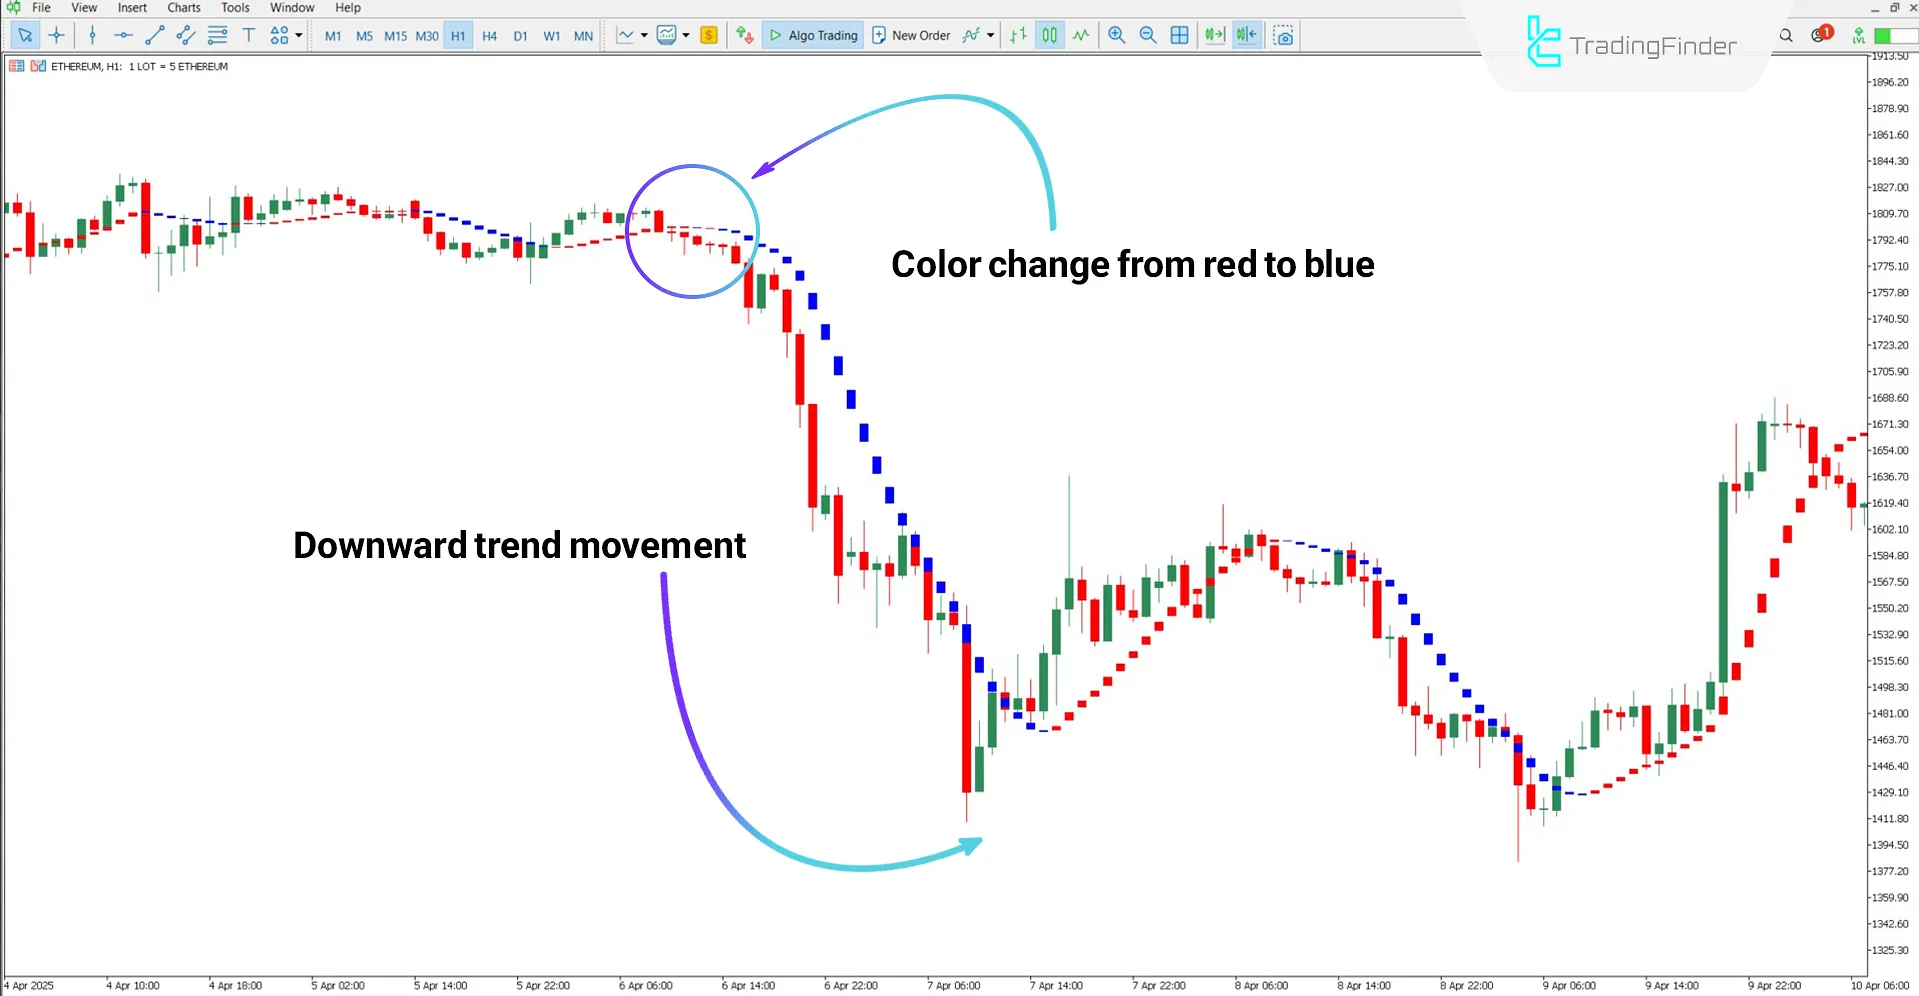
According to the Ethereum (ETH) chart, the shift in histogram color from red to blue in the I-Sadukey Indicator is considered a sign of an emerging downtrend. This color change point is a potential opportunity to enter a sell position.

Conclusion
The I-Sadukey Indicator, by displaying bars with different colors and lengths, provides traders with visual cues to identify optimal entry points for buy or sell positions.
Red bars represent upward trends, while blue bars indicate downward movement. This trading tool operates fully automatically, analyzing chart data without requiring any manual input.
I Sadukey MT5 PDF
I Sadukey MT5 PDF
Click to download I Sadukey MT5 PDFWhat is the I-Sadukey Indicator?
A tool used to detect the direction and strength of market trends.
What do the blue bars indicate?
Blue bars indicate a downtrend in market price.


