


![Ichimoku PourSamadi Signal Indicator MT5 Download – Free – [TradingFinder]](https://cdn.tradingfinder.com/image/614335/13-254-en-ichimoku-poursamadi-signal-mt5-01.webp)
![Ichimoku PourSamadi Signal Indicator MT5 Download – Free – [TradingFinder] 1](https://cdn.tradingfinder.com/image/614341/13-254-en-ichimoku-poursamadi-signal-mt5-02.webp)
![Ichimoku PourSamadi Signal Indicator MT5 Download – Free – [TradingFinder] 2](https://cdn.tradingfinder.com/image/614345/13-254-en-ichimoku-poursamadi-signal-mt5-03.webp)
![Ichimoku PourSamadi Signal Indicator MT5 Download – Free – [TradingFinder] 3](https://cdn.tradingfinder.com/image/614346/13-254-en-ichimoku-poursamadi-signal-mt5-07.webp)
The Ichimoku PourSamadi Signal Indicator is designed according to the time structure of the Ichimoku system and the proprietary “PourSamadi” algorithm.
This indicator tracks the changes in the Kijun-sen line and identifies the points where it shifts from a flat to a sloped state as the moment when the market exits equilibrium.
Compared to conventional price-based indicators, the focus of this tool is on time, and by using a specific numerical sequence (5, 9, 13, 17, 26, 35, 43, 52, 63, 72, 81, 90), it detects market time cycles.
Ichimoku PourSamadi Signal Indicator Specification Table
The table below includes the specifications of the Ichimoku PourSamadi Signal Indicator.
Indicator Categories: | Signal & Forecast MT5 Indicators Trading Assist MT5 Indicators Ichimoku Indicators for MetaTrader 5 |
Platforms: | MetaTrader 5 Indicators |
Trading Skills: | Elementary |
Indicator Types: | Reversal MT5 Indicators |
Timeframe: | Multi-Timeframe MT5 Indicators |
Trading Style: | Swing Trading MT5 Indicators Scalper MT5 Indicators Day Trading MT5 Indicators |
Trading Instruments: | Forex MT5 Indicators Crypto MT5 Indicators Stock MT5 Indicators |
Ichimoku PourSamadi Signal Indicator at a Glance
In the structure of the Ichimoku PourSamadi Signal Indicator, when the Kijun-sen line remains flat for several consecutive candles, the first change in its angle is recorded as the Anchor Time.
After this stage, the indicator draws a series of colored vertical lines to represent Time Nodes.Price behavior within these lines is usually accompanied by temporary fluctuations or changes in the rhythm of market movement.
Steps to Set Up the Ichimoku PourSamadi Signal Indicator
To activate the indicator in MetaTrader 5, the user must first complete the installation and initial setup process.
#1 Enabling the "DLL" Option
The "DLL" option must be enabled in the MetaTrader 5 settings to allow the indicator to run without restrictions. The activation steps are as follows:
- Go to the "Tools" menu;
- Select the "Options" tab;
- Navigate to the "Expert Advisors" section;
- Then enable the following options:
"Allow automated trading" and "Allow DLL imports"
#2 How to Obtain the License Code
Users can request their license code through the support section of the “TradingFinder” website.
Additionally, requests can also be submitted via Telegram or WhatsApp.
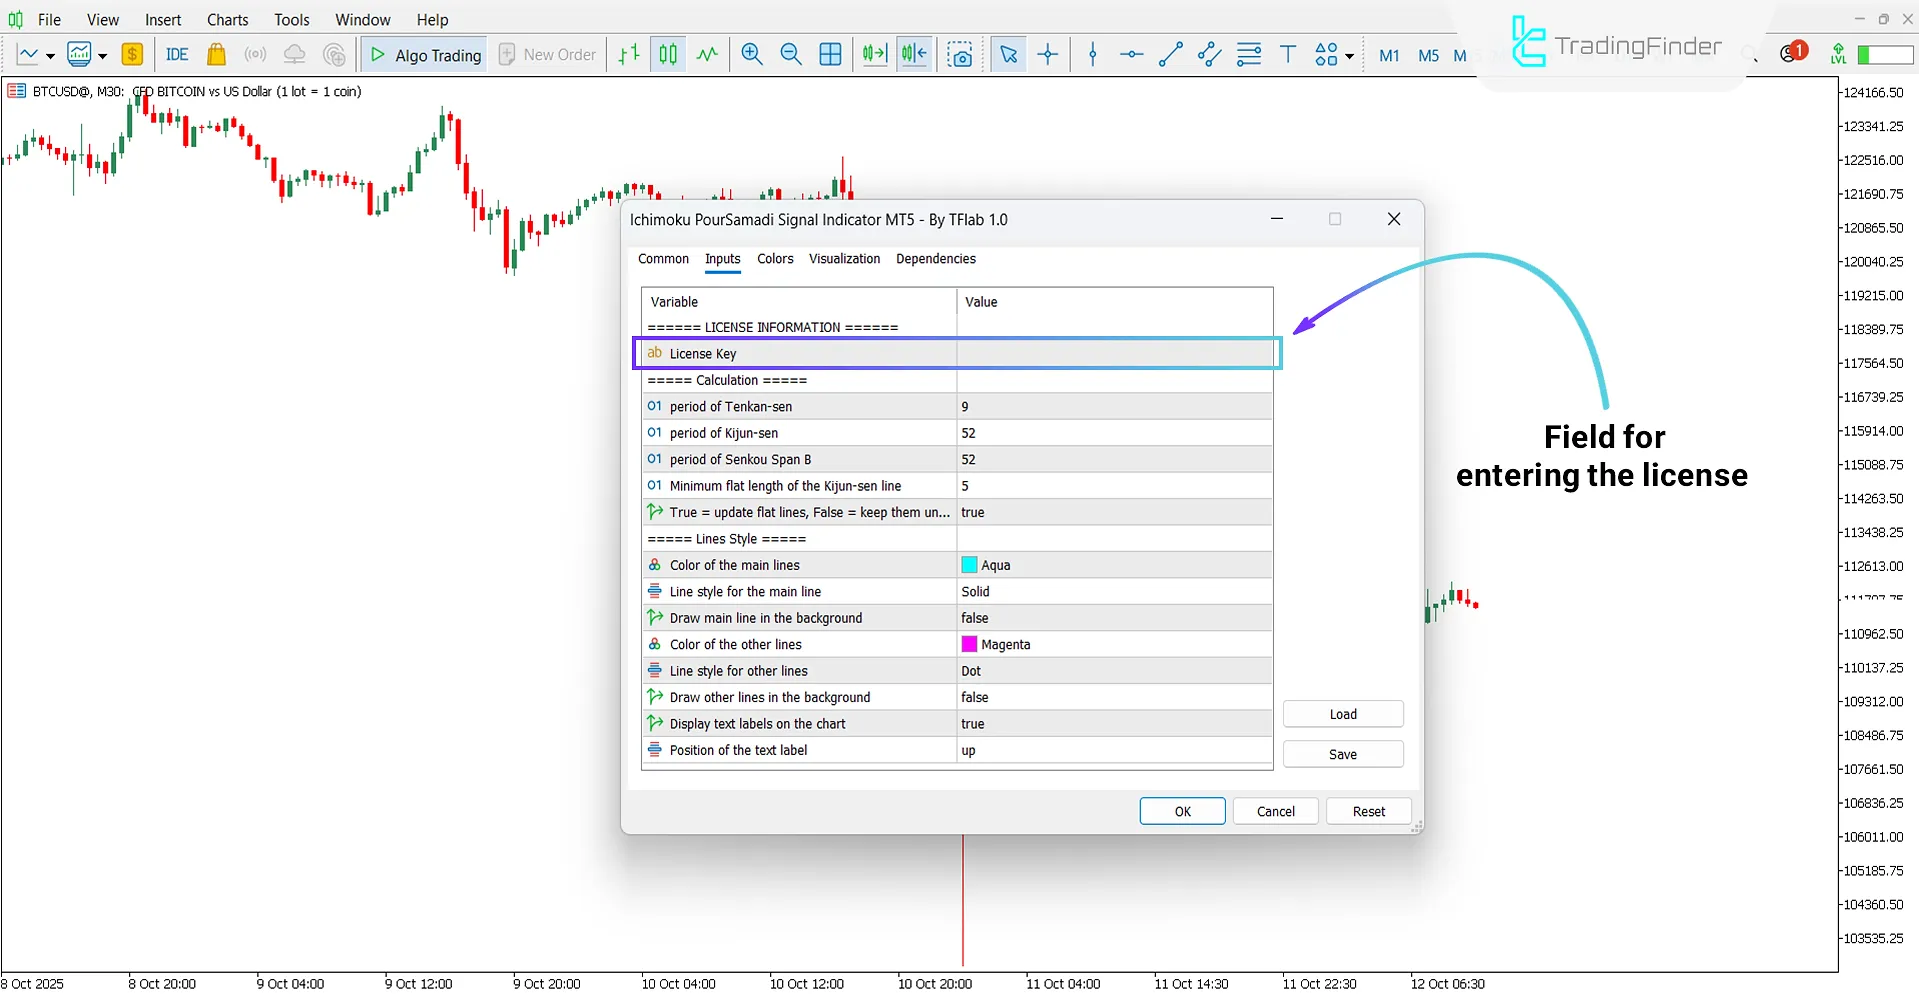
#3 Entering the License Code in the Indicator Settings Panel
After receiving the license, it must be entered exactly as received in the indicator settings field labeled "Licensekey".
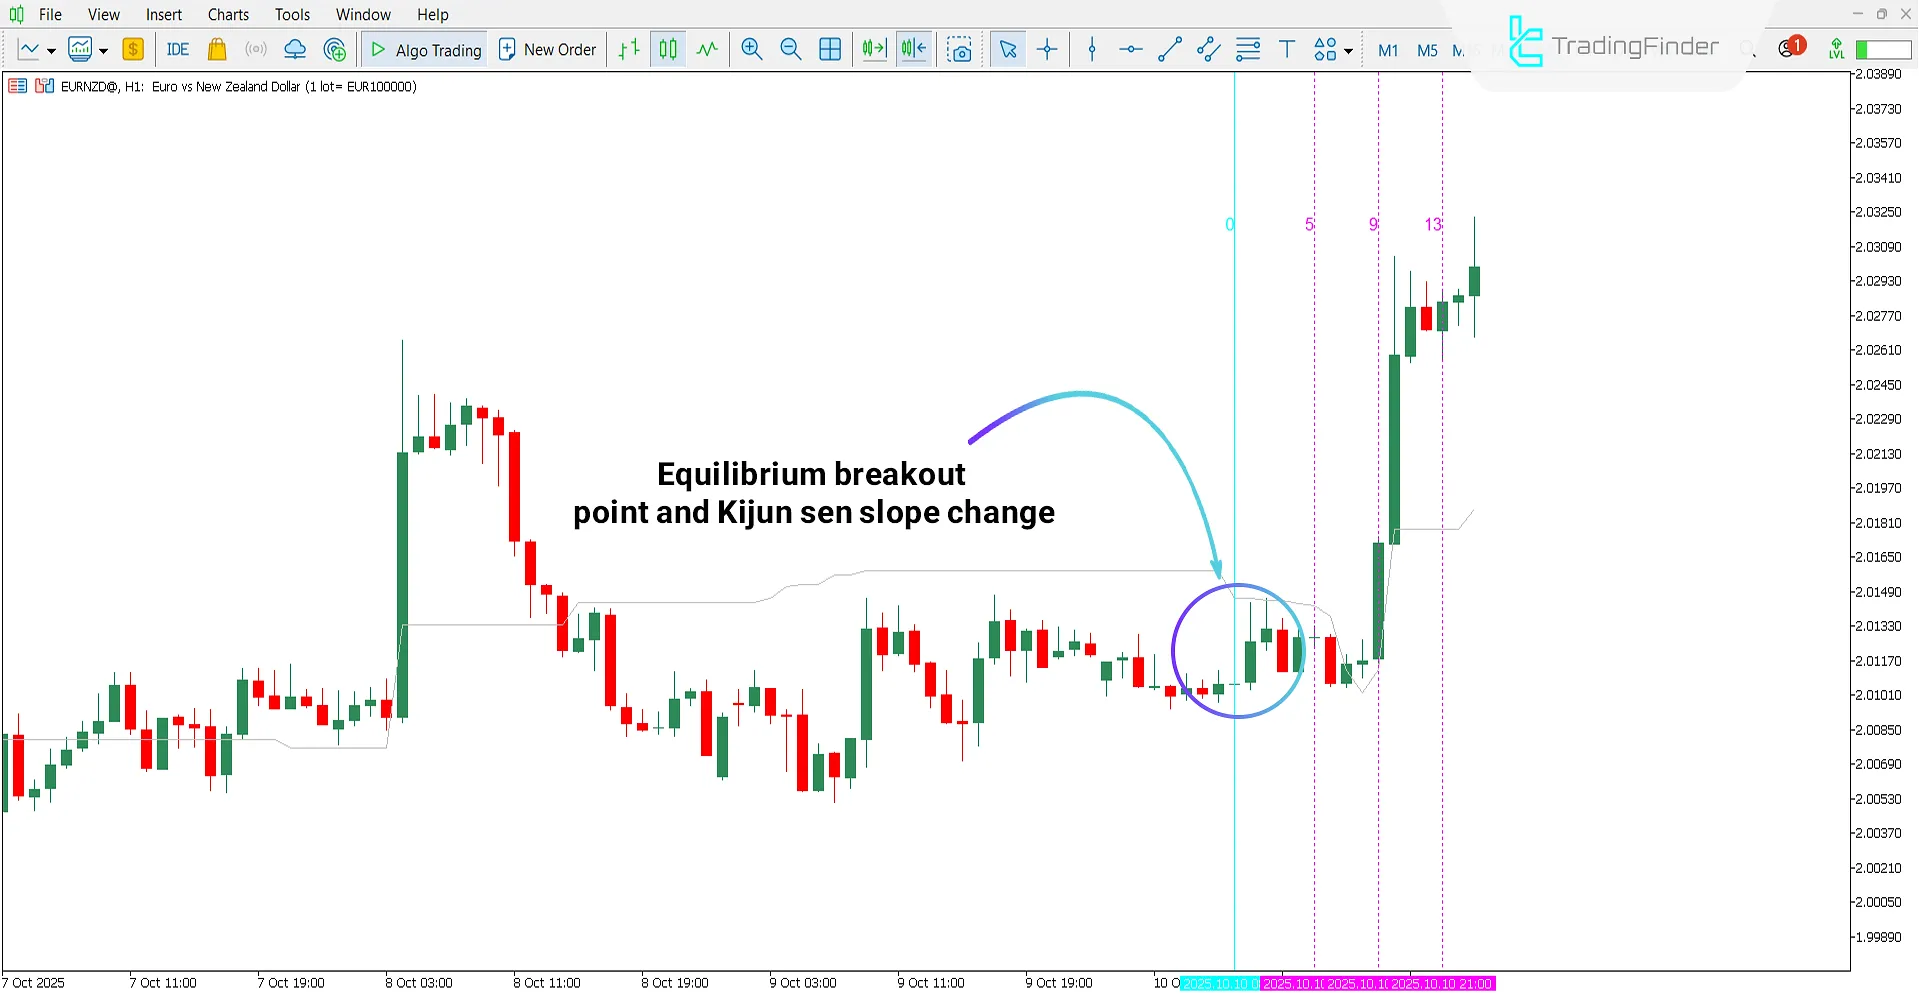
Bullish Trend Conditions
According to the EUR/NZD chart, the market exits equilibrium at the specified point, and the slope direction of the line changes.
From this point, the time cycle count begins, and at nodes 5 to 13, significant bullish reactions appear along with strong candles.
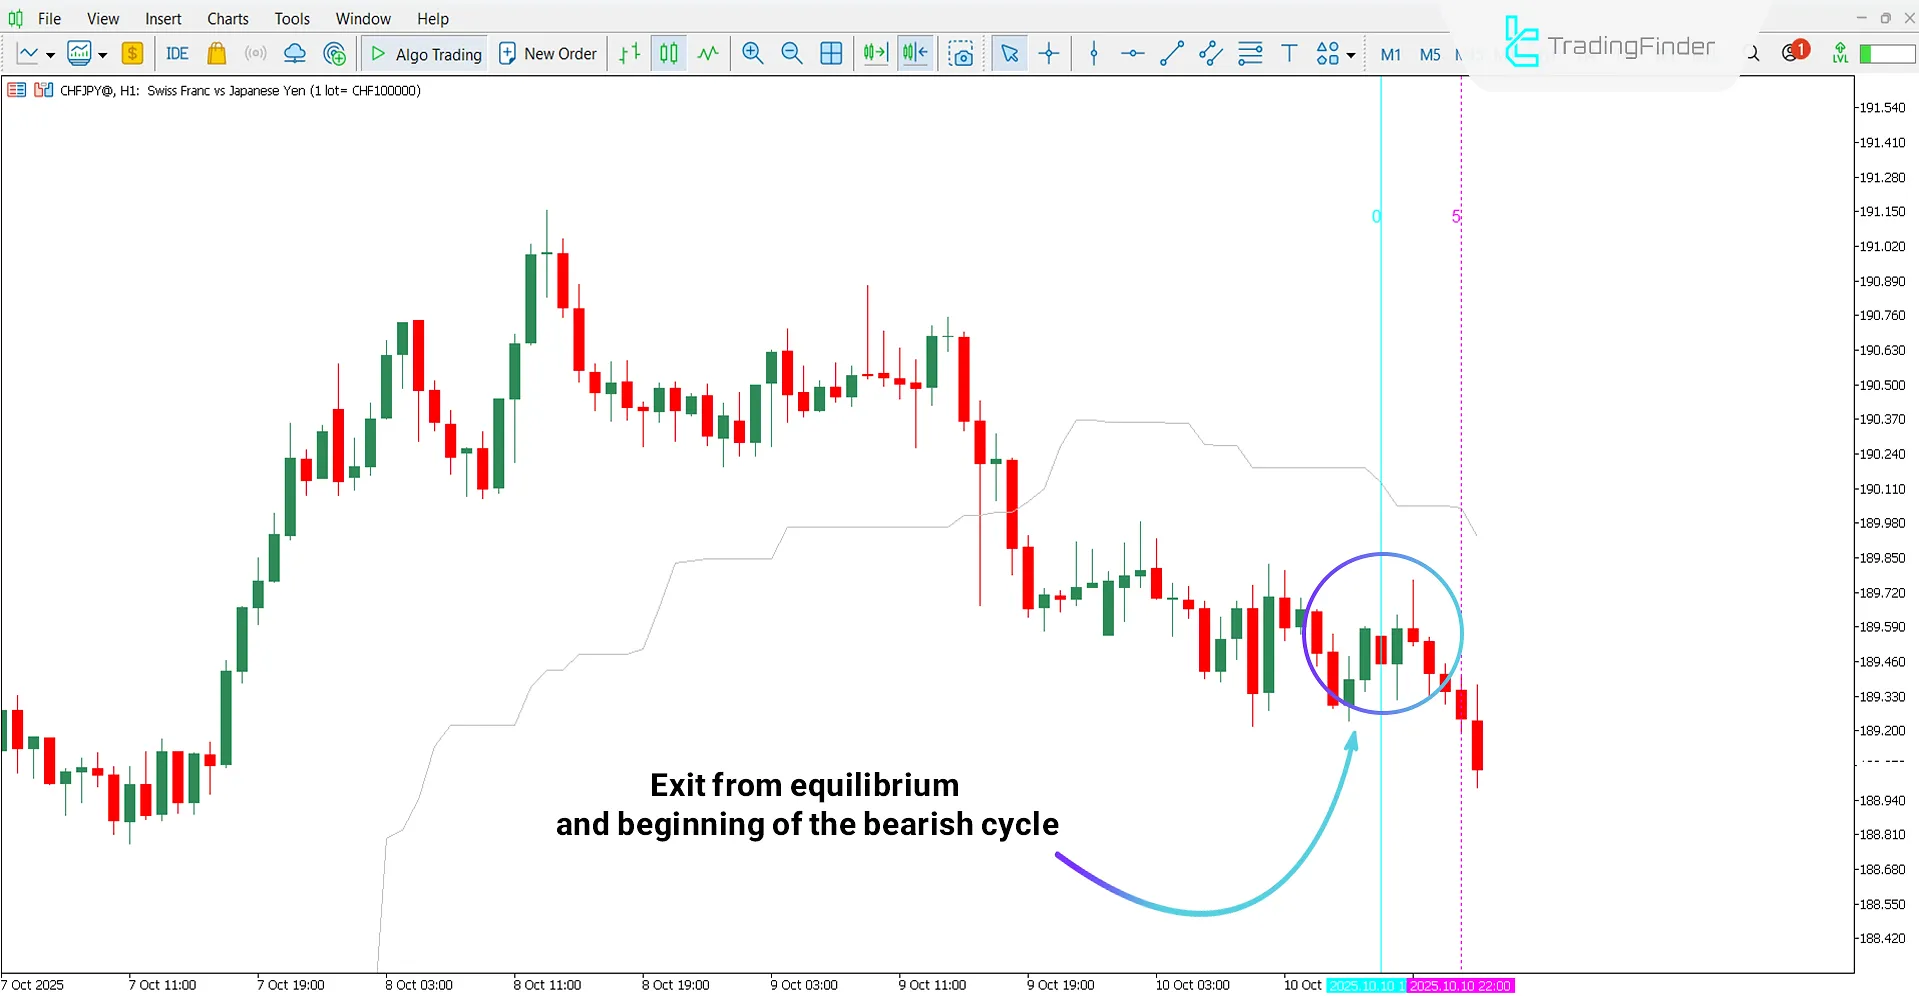
Bearish Trend Conditions
According to the 1-hour chart of CHF/JPY, after a period of Kijun-sen flatness, a change in the slope of the line indicates the market’s exit from equilibrium, forming a new bearish cycle.
At the initial nodes, strong bearish candles appear, showing a shift in market rhythm and the beginning of a momentum decline phase.
Ichimoku PourSamadi Signal Indicator Settings
The settings of the Ichimoku PourSamadi Signal Indicator are shown below:
- LicenseKey: Activation code and license of the indicator
- period of Tenkan-sen: Calculation period of Tenkan-sen line
- period of Kijun-sen: Calculation period of Kijun-sen line
- period of Senkou Span B: Calculation period of Senkou Span B
- Minimum flat length of the Kijun-sen line: Minimum flat length for Kijun-sen flat identification
- True = update flat lines, False = keep them unchanged: Status of flat line updates
- Color of the main lines: Color of main indicator lines
- Line style for the main line: Display style of main lines
- Draw main line in the background: Visibility setting of main line in background
- Color of the other lines: Color of secondary or time-counting lines
- Line style for other lines: Display style of secondary lines
- Draw other lines in the background: Position of secondary lines relative to candles
- Display text labels on the chart: Display setting of time node numbers on chart
- Position of the text label: Location of text labels on chart
Conclusion
The Ichimoku PourSamadi Signal Indicator is an advanced analytical tool for examining the market’s time rhythm. By combining the Ichimoku structure and the concept of equilibrium, it offers a different perspective on price behavior.
This indicator identifies flat zones in the Kijun-sen line and draws time nodes on the chart to highlight potential areas of phase change in price movement.
Ichimoku PourSamadi Signal Indicator MT5 PDF
Ichimoku PourSamadi Signal Indicator MT5 PDF
Click to download Ichimoku PourSamadi Signal Indicator MT5 PDFWhat is the main purpose of this indicator?
The primary purpose of the Ichimoku PourSamadi Signal Indicator is to analyze the market’s time equilibrium and predict potential areas where price cycles may start or end.
Is this tool limited to the Forex market only?
No, the Ichimoku PourSamadi Signal Indicator can be used across all financial markets.


