![Ichimoku Senkou A Channel Indicator MT5 Download – Free – [TFlab]](https://cdn.tradingfinder.com/image/601443/13-235-en-ichimoku-senkou-a-envelope-mt5-01.webp)
![Ichimoku Senkou A Channel Indicator MT5 Download – Free – [TFlab] 0](https://cdn.tradingfinder.com/image/601443/13-235-en-ichimoku-senkou-a-envelope-mt5-01.webp)
![Ichimoku Senkou A Channel Indicator MT5 Download – Free – [TFlab] 1](https://cdn.tradingfinder.com/image/601439/13-235-en-ichimoku-senkou-a-envelope-mt5-02.webp)
![Ichimoku Senkou A Channel Indicator MT5 Download – Free – [TFlab] 2](https://cdn.tradingfinder.com/image/601445/13-235-en-ichimoku-senkou-a-envelope-mt5-03.webp)
![Ichimoku Senkou A Channel Indicator MT5 Download – Free – [TFlab] 3](https://cdn.tradingfinder.com/image/601441/13-235-en-ichimoku-senkou-a-envelope-mt5-04.webp)
The Ichimoku Senkou A Envelope Indicator is recognized as a powerful tool in technical analysis, capable of identifying the main market movement and also showing price reversal points.
This indicator is designed based on Ichimoku concepts, and by drawing dynamic bands, it clearly provides traders with the range of price fluctuations.
Specification Table of Ichimoku Senkou A Envelope Indicator
The table below shows the specifications of the Ichimoku Senkou A Envelope Indicator:
Indicator Categories: | Signal & Forecast MT5 Indicators Bands & Channels MT5 Indicators Ichimoku Indicators for MetaTrader 5 |
Platforms: | MetaTrader 5 Indicators |
Trading Skills: | Intermediate |
Indicator Types: | Reversal MT5 Indicators |
Timeframe: | Multi-Timeframe MT5 Indicators |
Trading Style: | Swing Trading MT5 Indicators Scalper MT5 Indicators Day Trading MT5 Indicators |
Trading Instruments: | Forex MT5 Indicators Crypto MT5 Indicators Stock MT5 Indicators Commodity MT5 Indicators Indices MT5 Indicators Share Stock MT5 Indicators |
Ichimoku Senkou A Envelope Indicator at a Glance
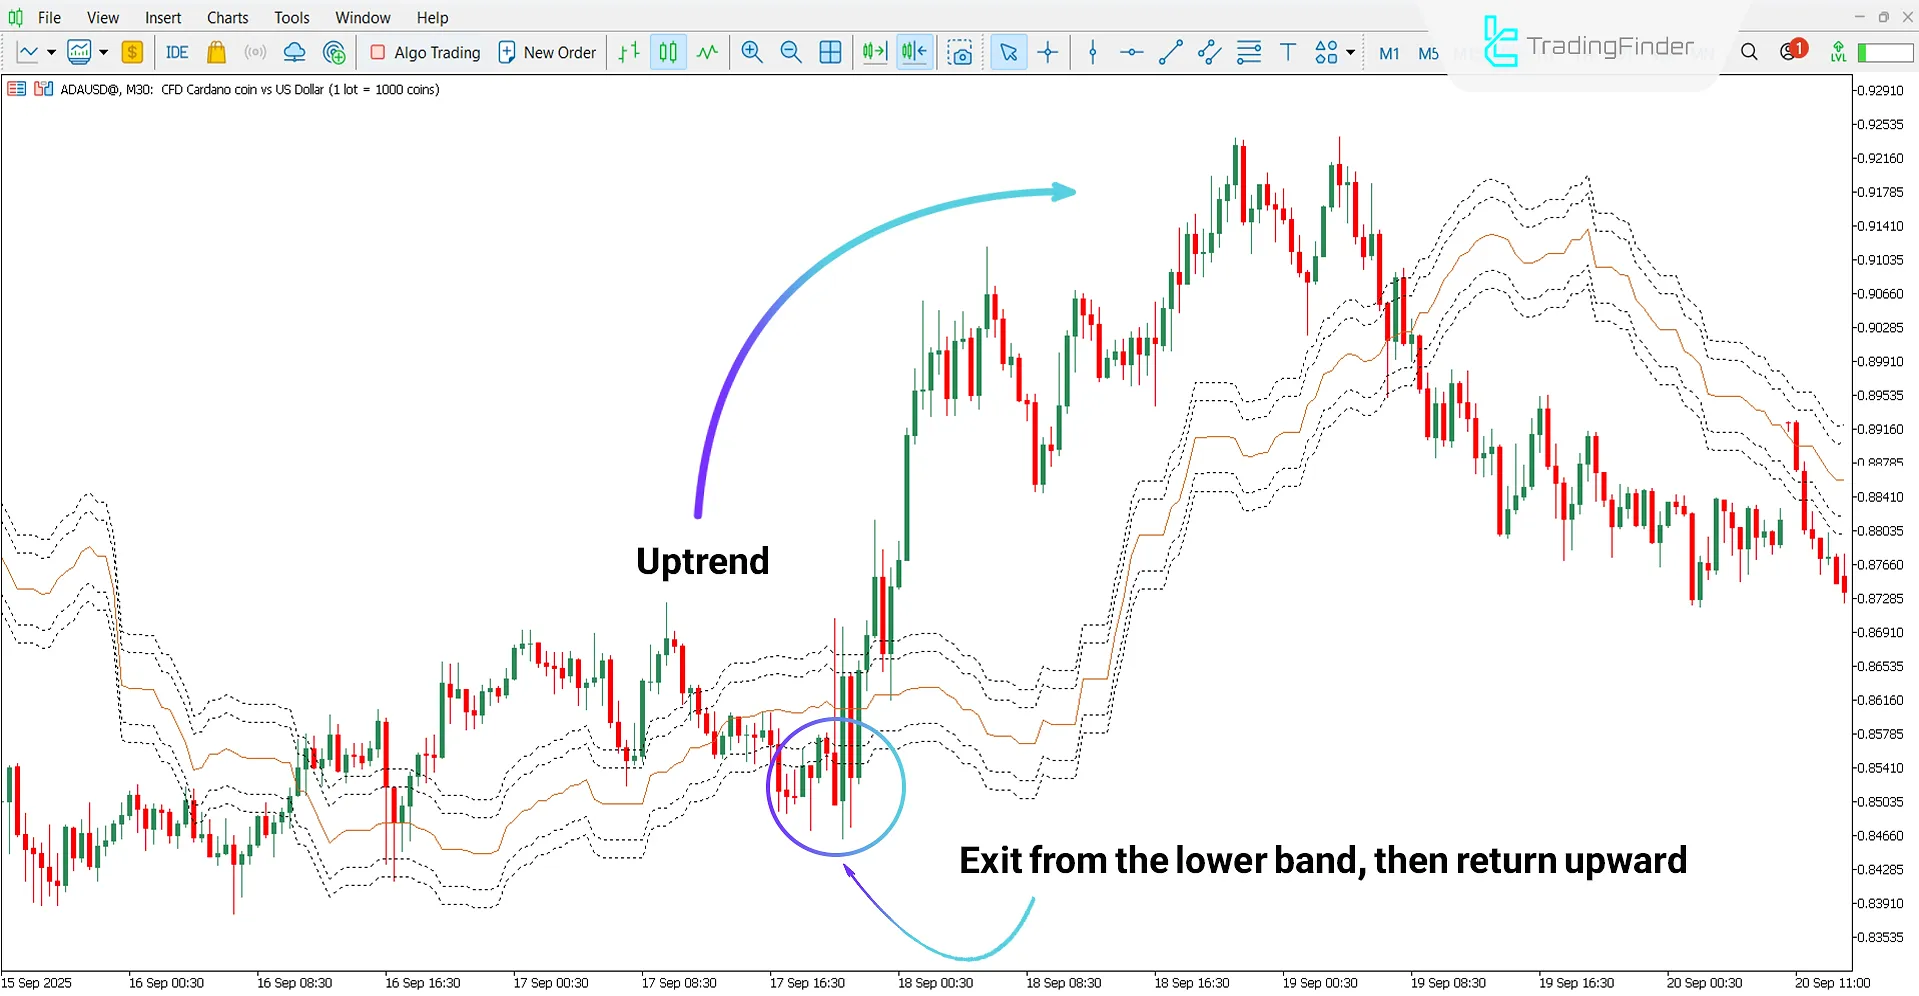
The Ichimoku Senkou A Channel Indicator creates two dynamic bands to display price reversal areas. In this way, when the price crosses the lower band and returns upward, the start of an uptrend is confirmed.
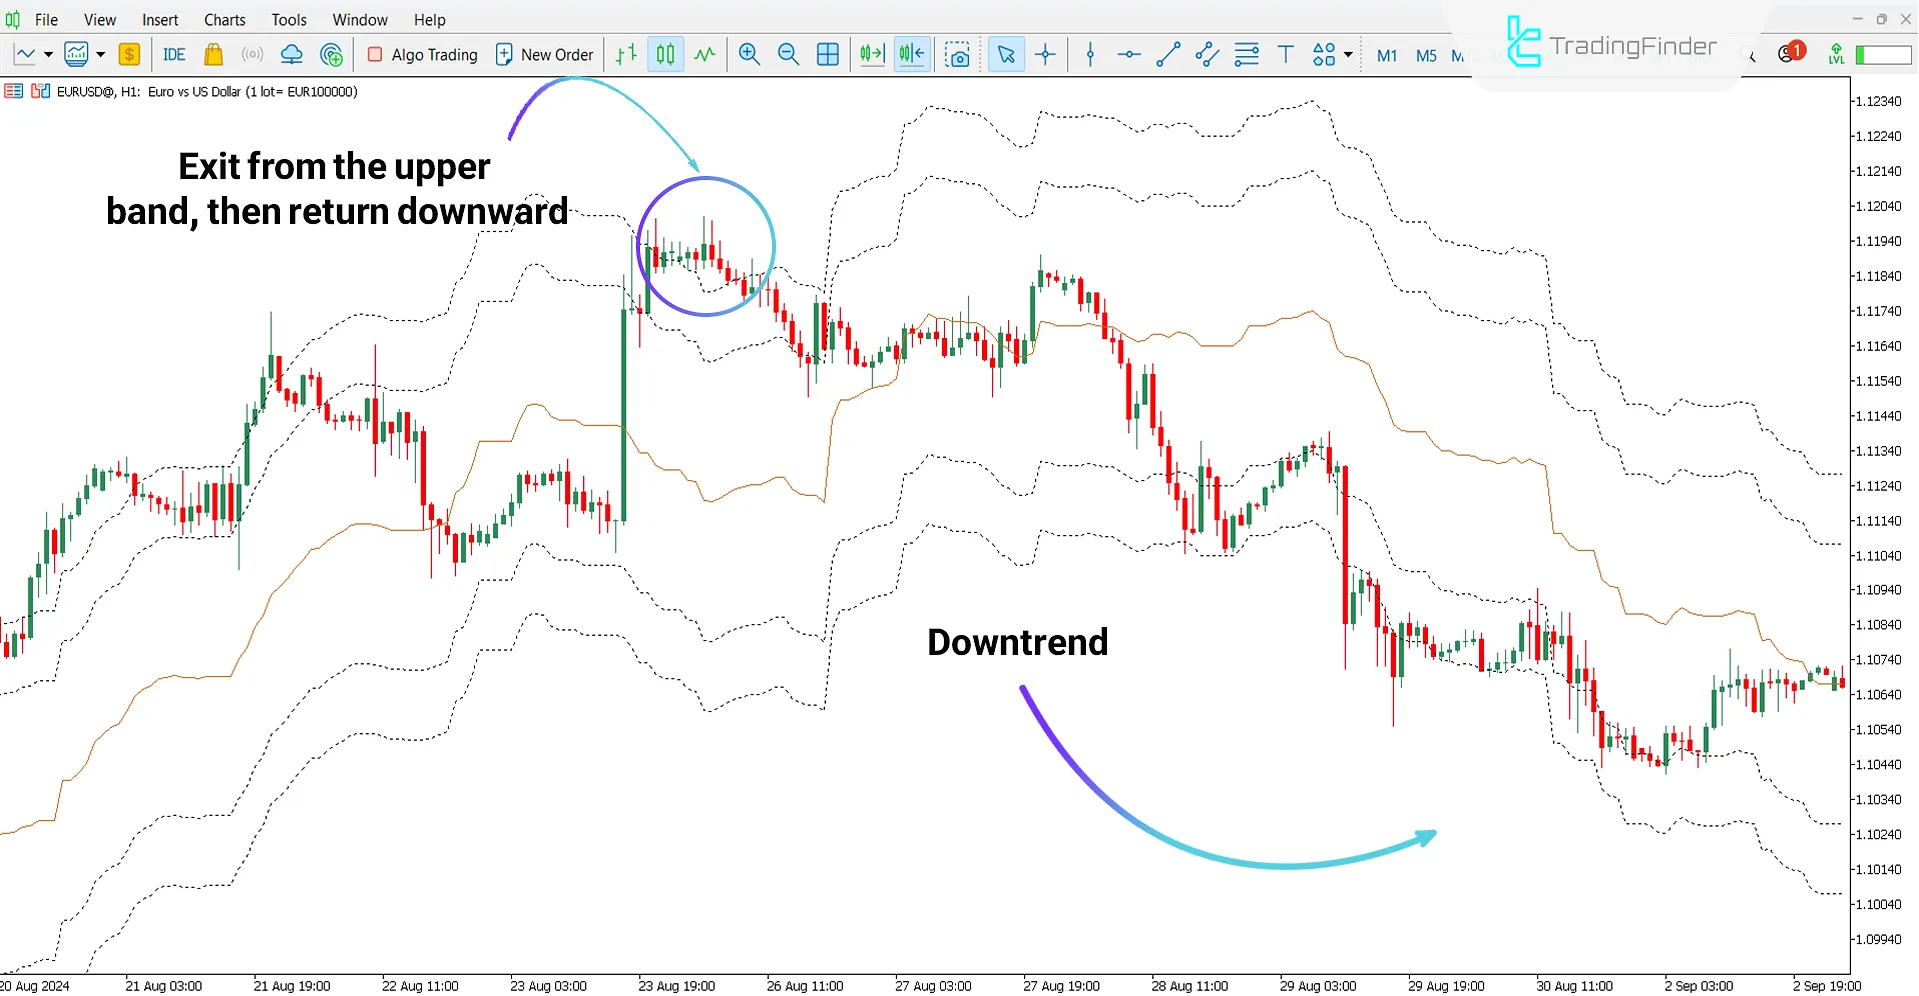
Conversely, when the trend crosses the upper band and then closes below it, a downtrend is indicated.
Bullish Trend Conditions
According to the Cardano (ADA) cryptocurrency chart on the 30-minute timeframe, when the price crosses the lower band and then returns above it, the beginning of an uptrend is shown.
Additionally, price fluctuations in the upper regions of the indicator’s bands demonstrate the continuation of the uptrend.

Bearish Trend Conditions
According to the EUR/USD chart on the 1-hour timeframe, the price first crossed the upper band and then shifted downward; this condition confirms the start of a downtrend.
Furthermore, price stabilization below the bands demonstrates the strength of the bearish trend.

Settings of Ichimoku Senkou A Channel Indicator
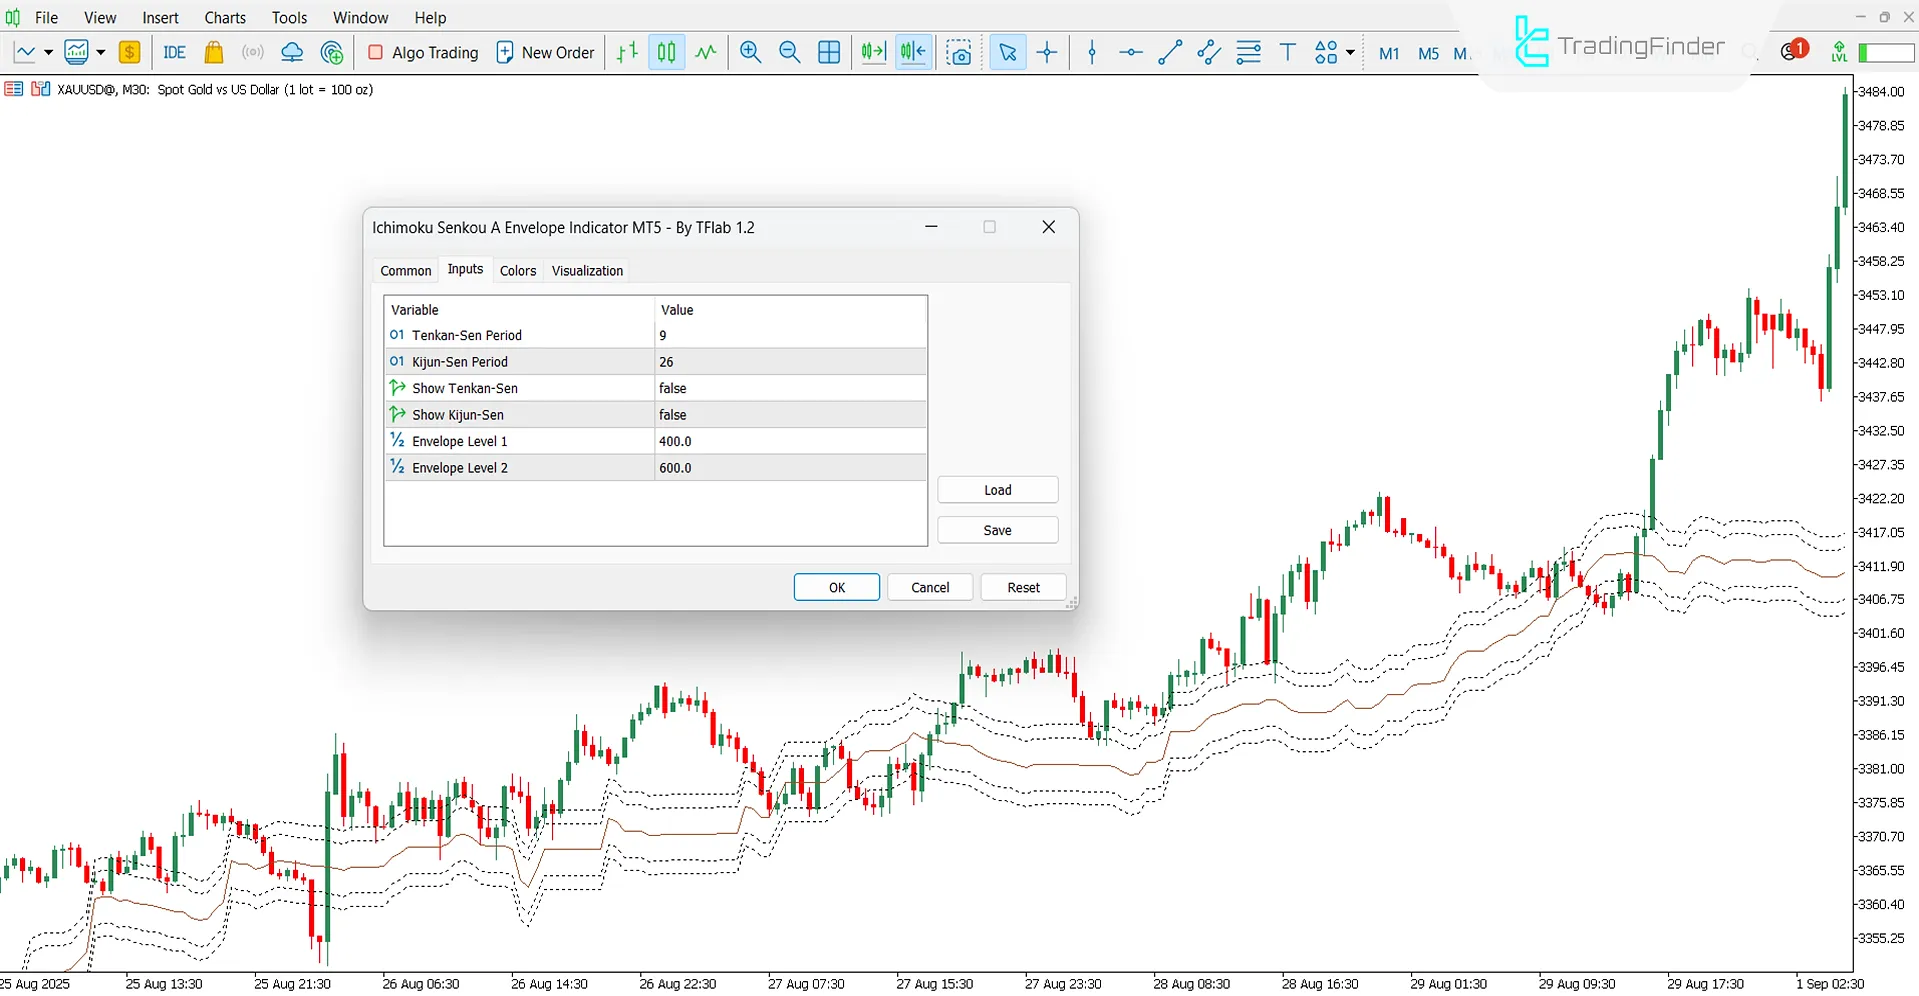
The settings of the Ichimoku Senkou A Envelope Indicator are as follows:

- Tenkan-sen Period: Calculation period of Tenkan-sen line
- Kijun-sen Period: Calculation period of Kijun-sen line
- Show Tenkan-Sen: Display status of Tenkan-sen line
- Show Kijun-Sen: Display status of Kijun-sen line
- Envelope Level 1: Coverage range of level one
- Envelope Level 2: Coverage range of level two
Conclusion
The Ichimoku Senkou A Envelope Indicator, by creating dynamicbands, identifies the market trend and potential price reversal points.
Moreover, the position of price relative to these bands can confirm the start of bullish or bearish trends.
One of the features of this trading tool is the display of key Ichimoku lines, namely Tenkan-sen and Kijun-sen.
Ichimoku Senkou A Channel Indicator MT5 PDF
Ichimoku Senkou A Channel Indicator MT5 PDF
Click to download Ichimoku Senkou A Channel Indicator MT5 PDFWhat does price stabilization below the bands mean?
Confirmation of seller strength and the persistence of the downtrend.
Can this tool be used on higher timeframes?
Yes, the Ichimoku Senkou A Channel Indicator is multi-timeframe and can be applied across all timeframes.


