![ICT 2022 Model Indicator for MetaTrader 5 Download - Free - [TradingFinder]](https://cdn.tradingfinder.com/image/186416/4-25-en-ict-2022-model-mt5-1.webp)
![ICT 2022 Model Indicator for MetaTrader 5 Download - Free - [TradingFinder] 0](https://cdn.tradingfinder.com/image/186416/4-25-en-ict-2022-model-mt5-1.webp)
![ICT 2022 Model Indicator for MetaTrader 5 Download - Free - [TradingFinder] 1](https://cdn.tradingfinder.com/image/186383/4-25-en-ict-2022-model-mt5-2.webp)
![ICT 2022 Model Indicator for MetaTrader 5 Download - Free - [TradingFinder] 2](https://cdn.tradingfinder.com/image/186384/4-25-en-ict-2022-model-mt5-3.webp)
![ICT 2022 Model Indicator for MetaTrader 5 Download - Free - [TradingFinder] 3](https://cdn.tradingfinder.com/image/186385/4-25-en-ict-2022-model-mt5-4.webp)
The ICT 2022 Indicator for MetaTrader 5 indicators is based on key concepts such as liquidity grabs (Sweep), Change of Character (CHoCH), Swing Failure Pattern (SFP), and Fair Value Gaps (FVG).
This indicator provides a clear visualization of these concepts on price charts, making it a valuable tool for analysts and traders who follow the ICT style.
Indicator Specifications
The table below summarizes the features of the indicator:
Indicator Categories: | Signal & Forecast MT5 Indicators Liquidity Indicators MT5 Indicators ICT MT5 Indicators |
Platforms: | MetaTrader 5 Indicators |
Trading Skills: | Advanced |
Indicator Types: | Reversal MT5 Indicators |
Timeframe: | Multi-Timeframe MT5 Indicators |
Trading Style: | Day Trading MT5 Indicators |
Trading Instruments: | Forex MT5 Indicators Crypto MT5 Indicators Forward MT5 Indicators |
Indicator Overview
Liquidity is captured through two main methods:
- Fake Breakouts (SFP): Designed to mislead traders;
- Sweeps (Sweep): Occurs to attract liquidity in the opposite direction of the trend.
These processes often result in strong retracements and the formation of Fair Value Gaps (FVG).
The ICT 2022 Model Indicator identifies these changes and confirms signals, displaying buy entry signals with a green arrow and sell entry signals with a red arrow.
Indicator in an Uptrend
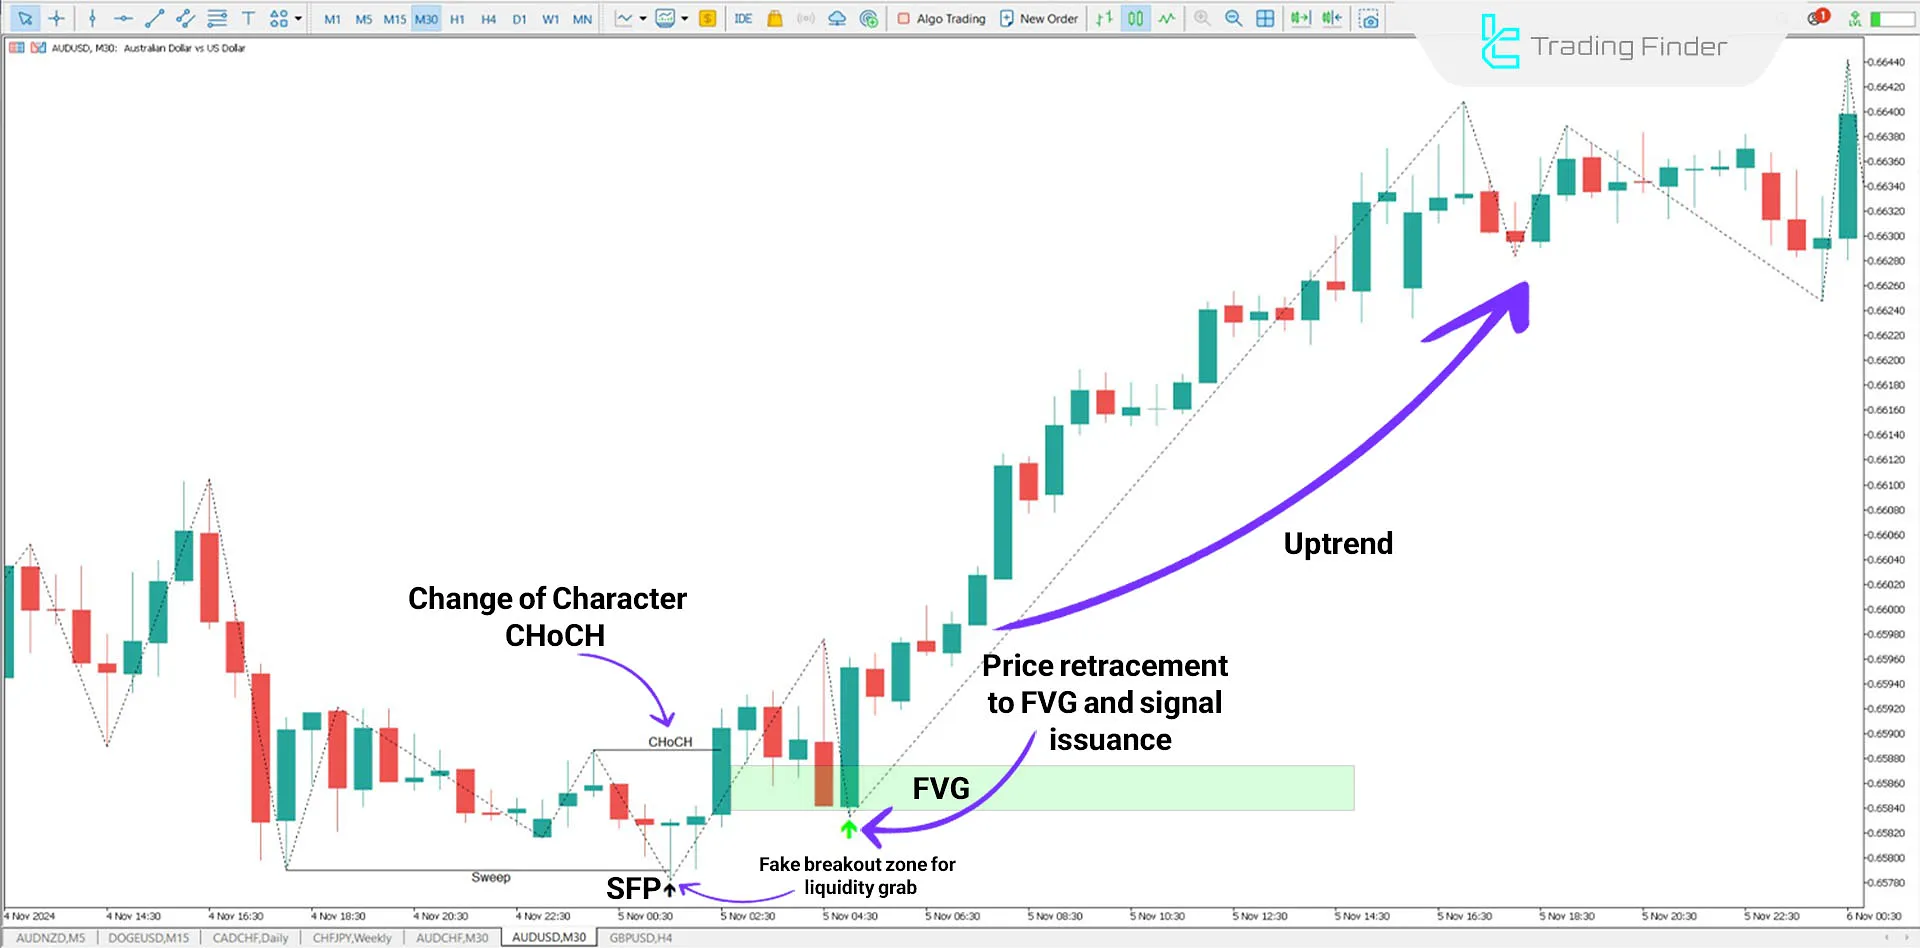
As shown in the price chart of AUD/USD, the price initially attracts liquidity below support levels and then resumes the uptrend, resulting in a Change of Character (CHoCH) in the market.
After locating the latest SFP, the indicator analyzes the FVG in the direction of the price's upward movement and issues a buy signal (Buy) upon receiving confirmation.

Indicator in a Downtrend
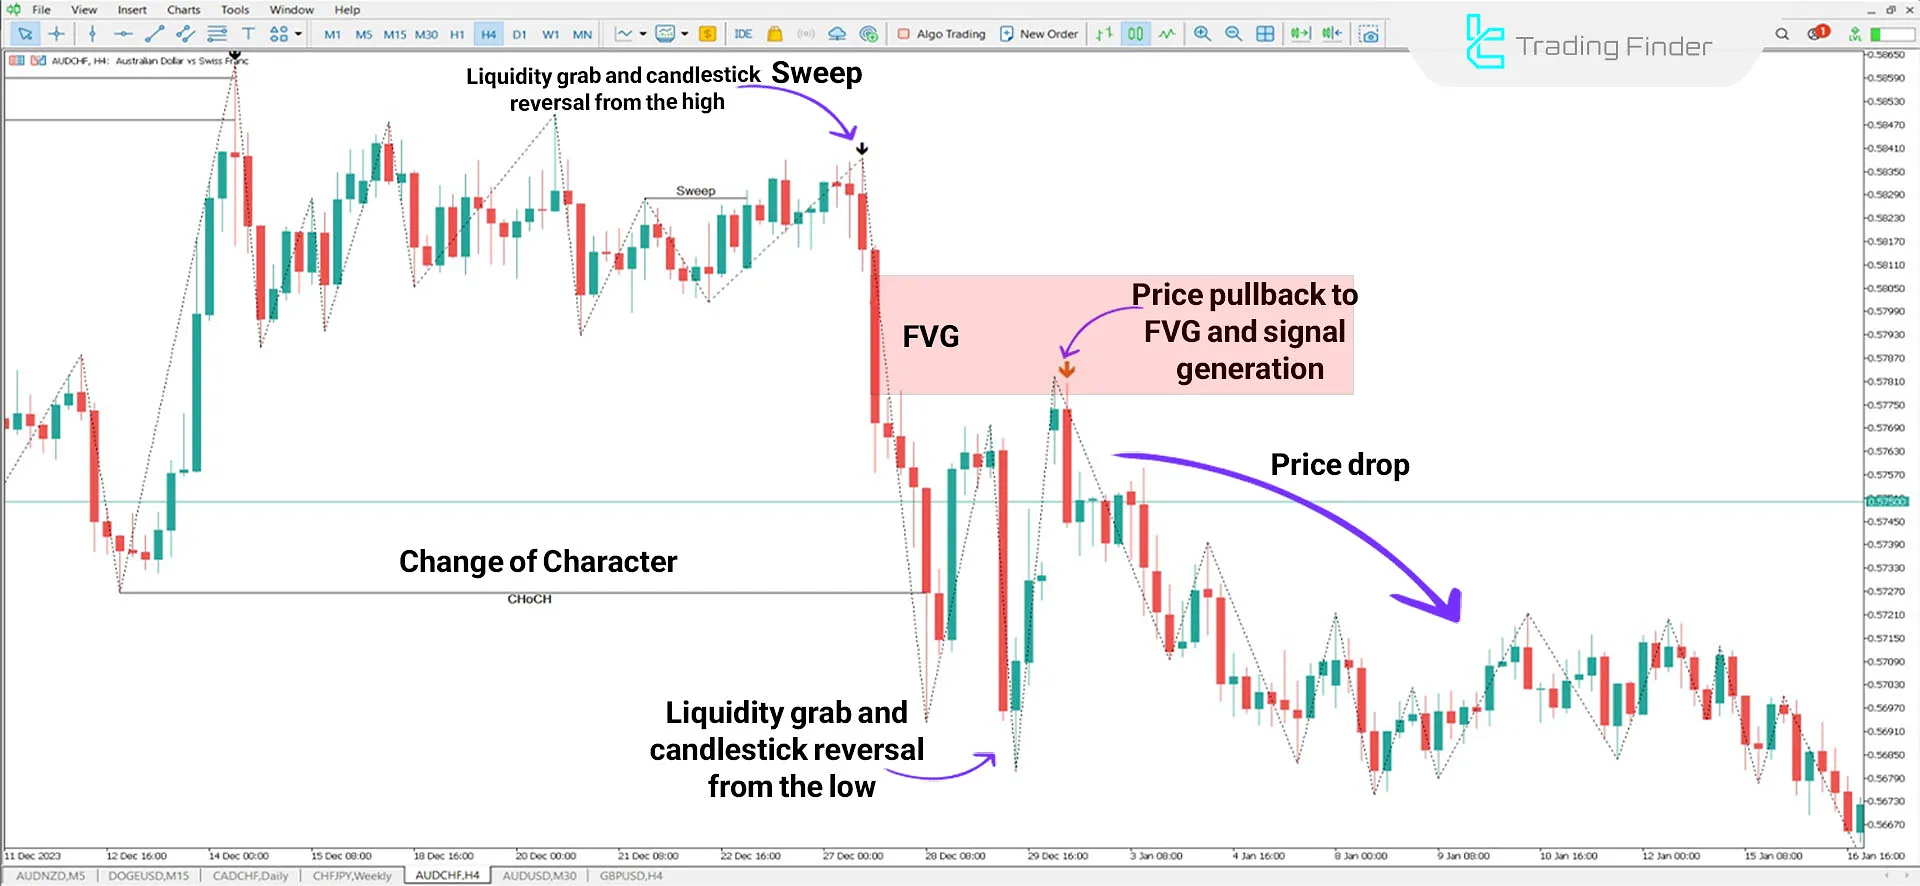
In the price chart of AUD/CHF, liquidity above resistance areas is initially captured; this process leads to a price reversal and the start of bearish momentum, ultimately resulting in a Change of Character (CHoCH).

ICT 2022 Model Indicator Settings
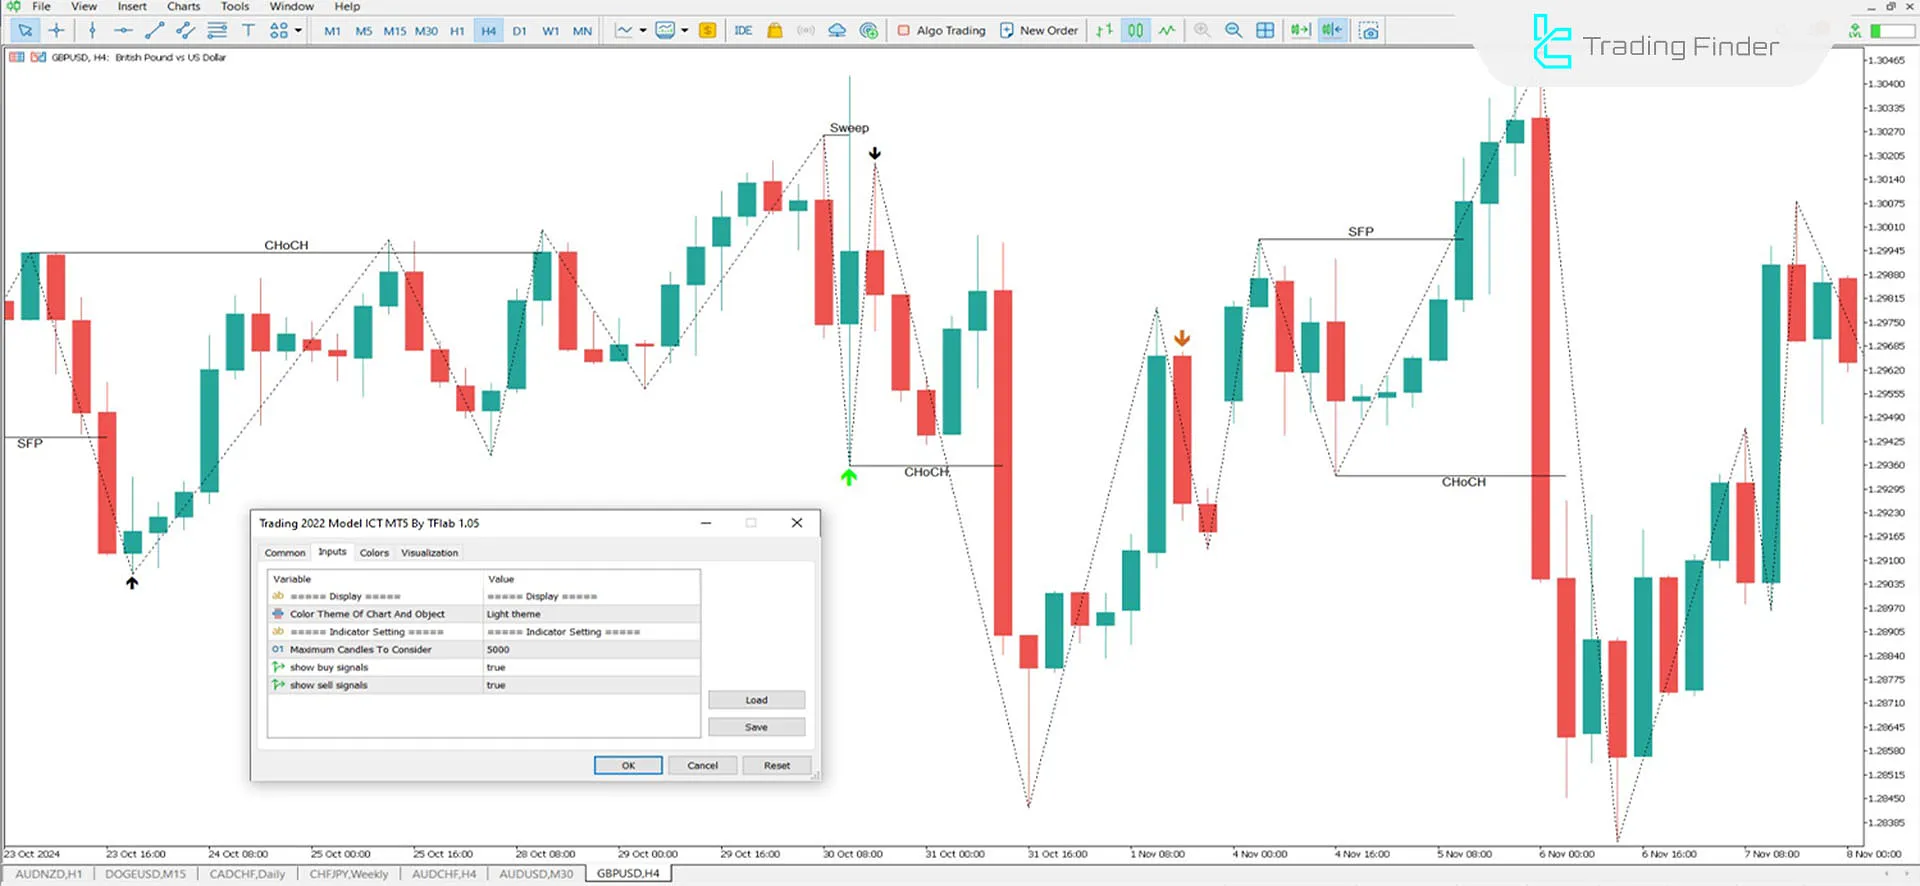
The image below fully displays the indicator settings:

- Color Theme of Chart and Object: Background color theme of the chart;
- Maximum Candles to Consider: Number of past candles to calculate (default: 5000);
- Show Buy Signals: Display buy signals;
- Show Sell Signals: Display sell signals.
Conclusion
The ICT 2022 Indicator is designed based on the ICT trading style, providing a useful tool for identifying buy (Buy) and sell (Sell) signals in financial markets.
This indicator is used to analyze trends, Potential Reversal Zones (PRZ), and the behavior of Market Makers in various time frames. Its features include identifying liquidity and analyzing price movements based on institutional behavior.
ICT 2022 Model MT5 PDF
ICT 2022 Model MT5 PDF
Click to download ICT 2022 Model MT5 PDFHow are buy and sell signals issued?
Buy and sell signals are issued by identifying key changes such as SFP, FVG, and CHoCH and confirming market conditions. Green arrows indicate buy signals and red arrows indicate sell signals.
Is the indicator usable for all time frames?
Yes, this indicator supports multiple time frames (multi-time frame) and is suitable for day trading.


