![ICT Index Futures Vertical Lines Indicator MT5 Download – Free – [Tradingfinder]](https://cdn.tradingfinder.com/image/463386/13-169-en-ict-index-futures-vertical-lines-mt5-01.webp)
![ICT Index Futures Vertical Lines Indicator MT5 Download – Free – [Tradingfinder] 0](https://cdn.tradingfinder.com/image/463386/13-169-en-ict-index-futures-vertical-lines-mt5-01.webp)
![ICT Index Futures Vertical Lines Indicator MT5 Download – Free – [Tradingfinder] 1](https://cdn.tradingfinder.com/image/463362/13-169-en-ict-index-futures-vertical-lines-mt5-02.webp)
![ICT Index Futures Vertical Lines Indicator MT5 Download – Free – [Tradingfinder] 2](https://cdn.tradingfinder.com/image/463363/13-169-en-ict-index-futures-vertical-lines-mt5-03.webp)
![ICT Index Futures Vertical Lines Indicator MT5 Download – Free – [Tradingfinder] 3](https://cdn.tradingfinder.com/image/463380/13-169-en-ict-index-futures-vertical-lines-mt5-04.webp)
The ICT Index Futures Vertical Lines Indicator is a powerful tool designed for traders in the futures markets and CME indices aimed at simplifying daily market analysis.
This tool is developed based on ICT strategy concepts and plots critical time zones directly on the chart to highlight key moments of each trading day.
ICT Index Futures Vertical Lines Indicator Specifications Table
The following table outlines the specifications of the ICT Index Futures Vertical Lines Indicator.
Indicator Categories: | Liquidity Indicators MT5 Indicators Session & KillZone MT5 Indicators ICT MT5 Indicators |
Platforms: | MetaTrader 5 Indicators |
Trading Skills: | Advanced |
Indicator Types: | Reversal MT5 Indicators |
Timeframe: | Multi-Timeframe MT5 Indicators |
Trading Style: | Swing Trading MT5 Indicators Scalper MT5 Indicators Day Trading MT5 Indicators |
Trading Instruments: | Forex MT5 Indicators Crypto MT5 Indicators Stock MT5 Indicators |
At a Glance: ICT Index Futures Vertical Lines Indicator
With the ICT Index Futures Vertical Lines Indicator, the three main time zones Asia, London, and New York can be precisely applied to the chart.
Additionally, the indicator offers options to visualize key market times, such as:
- New York PM Session
- New York Midnight
- CME Open
- Start and End of the New York Afternoon Session
Bullish Scenario
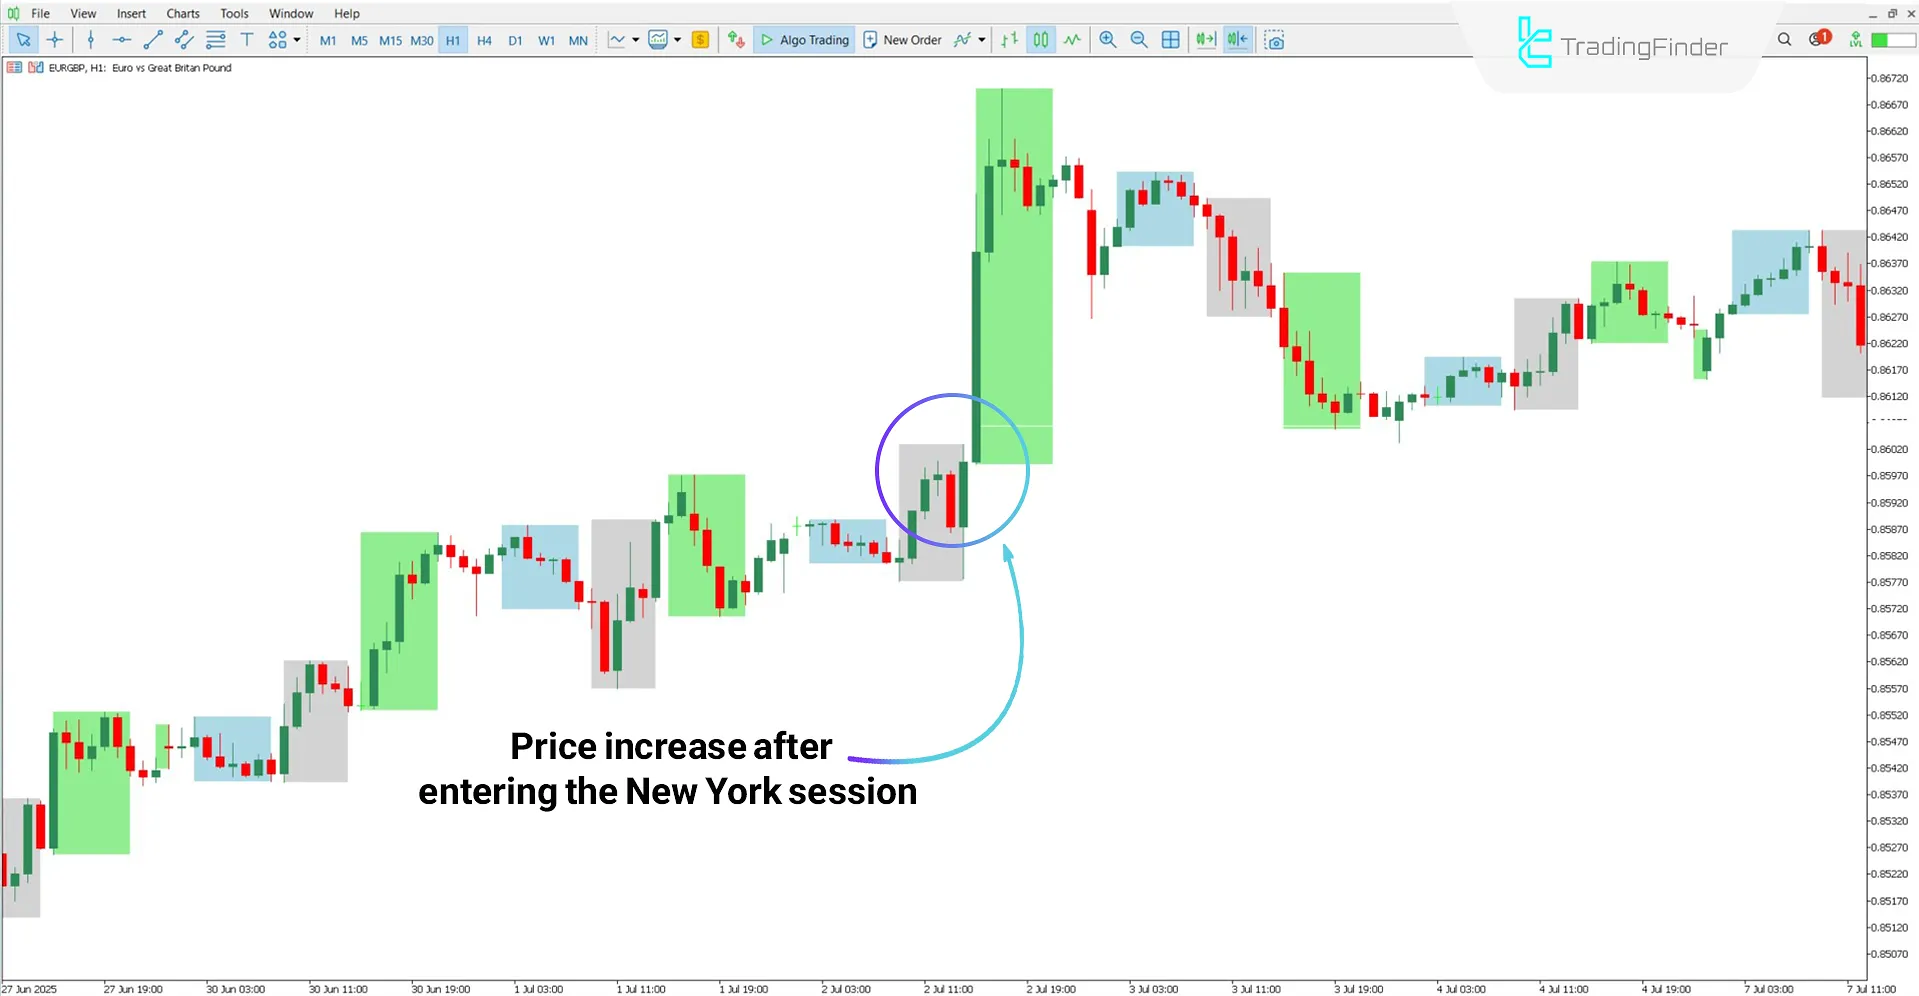
Based on the EUR/GBP chart in the 1-hour timeframe, the three major session zones (Asia, London, and New York) are highlighted using colored boxes.
As seen in the image, the price enters the New York session and begins a bullish move.

Bearish Scenario
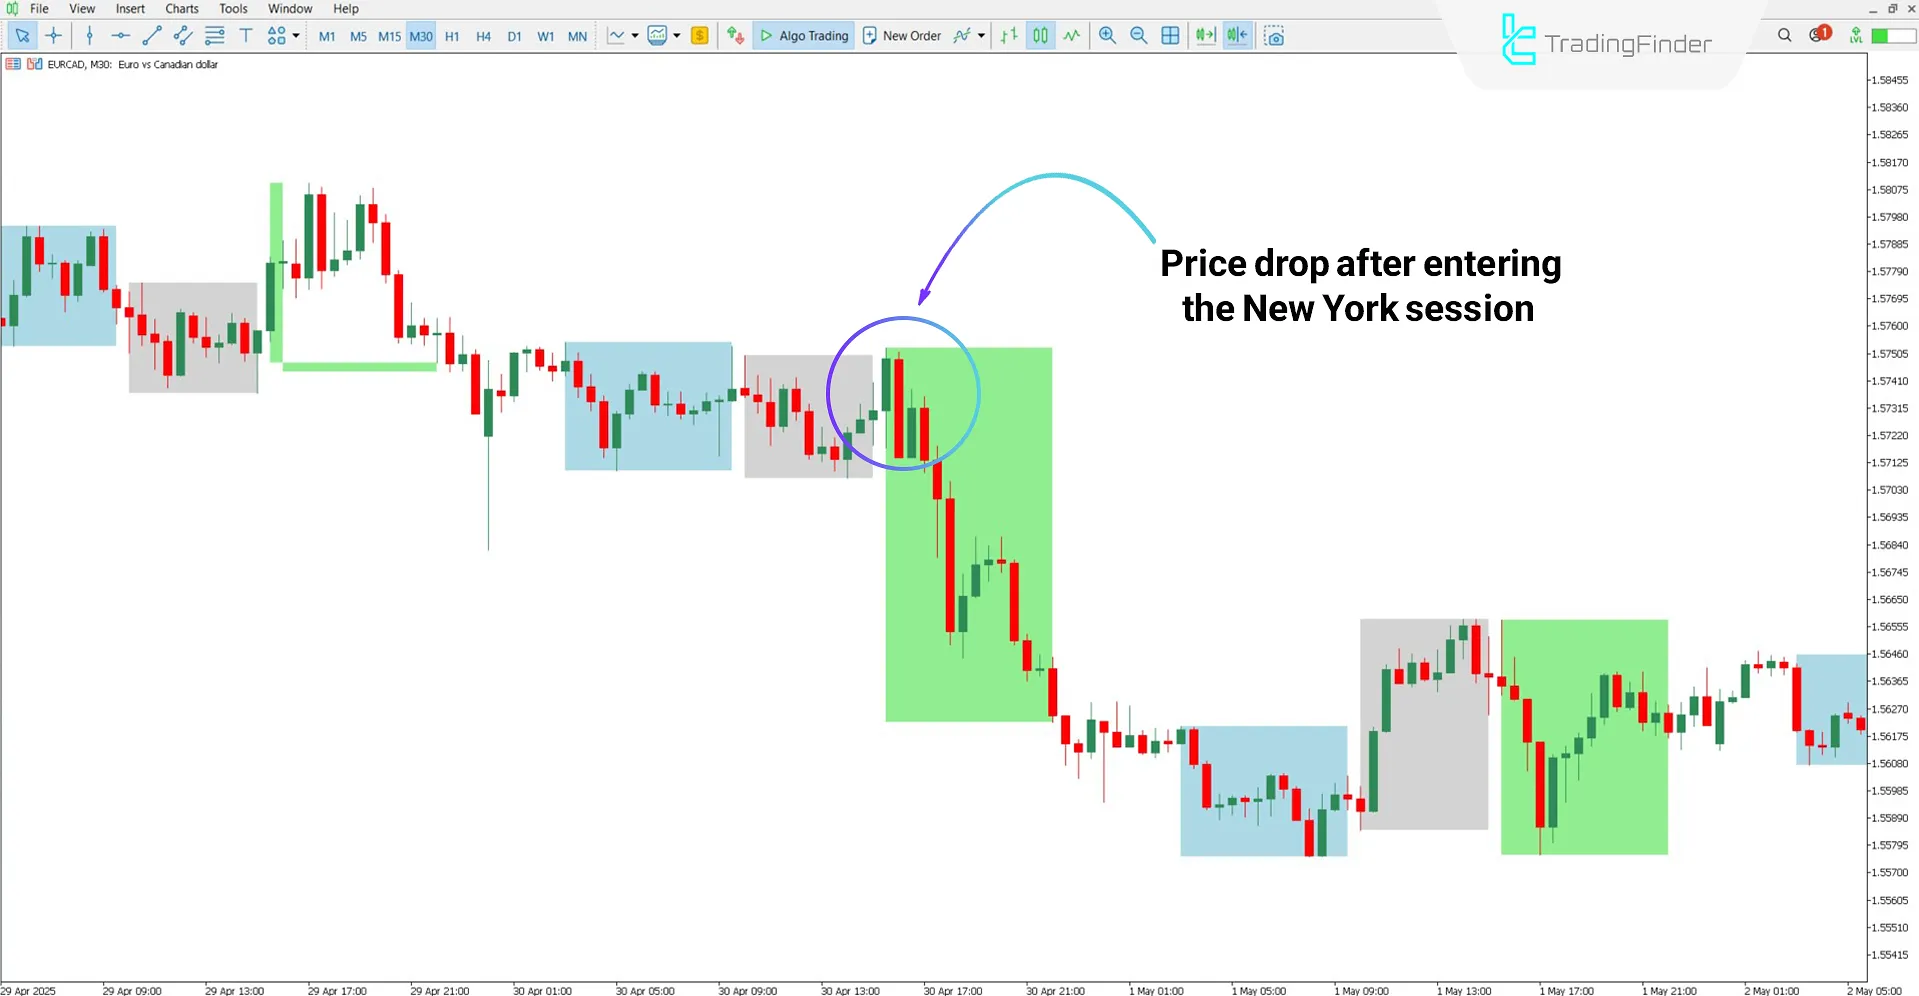
Based on the 30-minute EUR/CAD chart, the indicator distinguishes the three main trading sessions using colored boxes blue for the Asia session, grey for London, and green for New York. As shown in the chart, the price breaks out of its range upon entering the New York session and begins a bearish move.

Indicator Settings
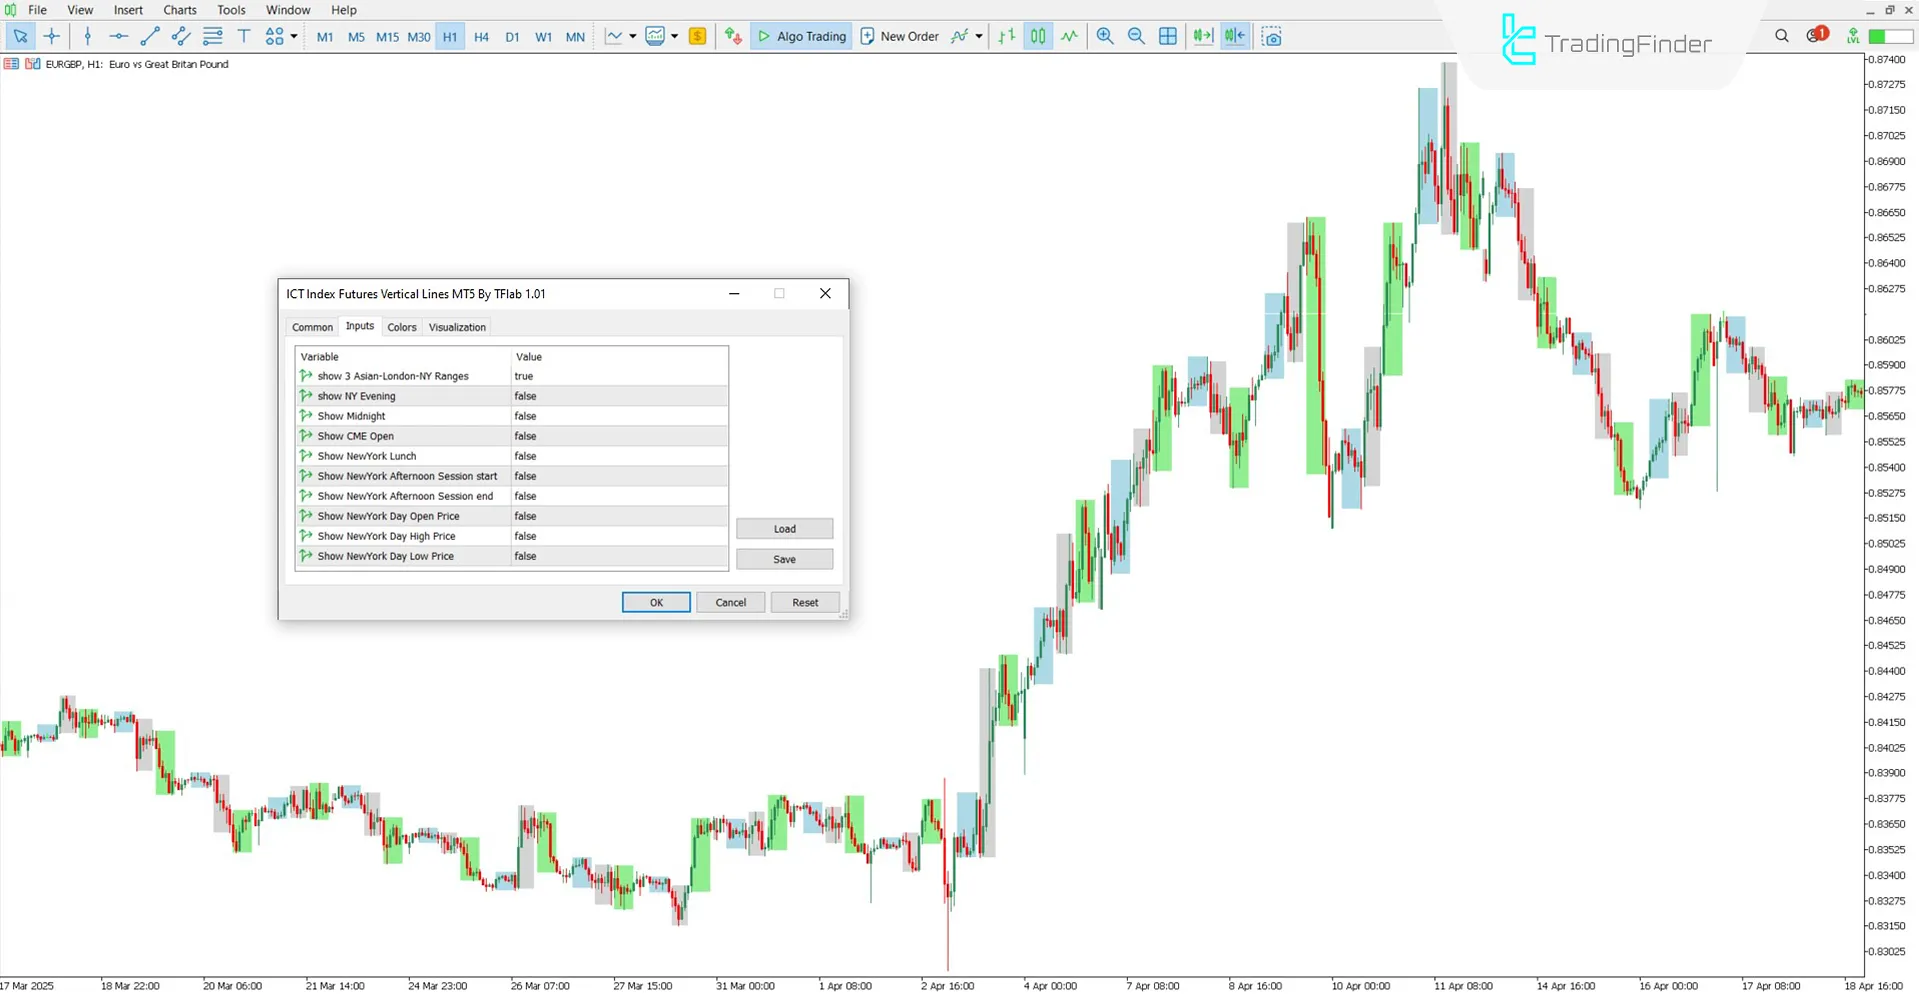
The configuration options for the ICT Index Futures Vertical Lines Indicator are shown below:

- show 3 Asian-London-NY Ranges: Displays the time ranges for Asia, London, and New York
- show NY Evening: Displays the New York evening session on the chart
- Show Midnight: Displays the 00:00 New York timeline
- Show CME Open: Displays the opening line of the CME futures market
- Show NewYork Lunch: Displays the New York lunchtime
- Show NewYork Afternoon Session start: Displays the start time of the New York afternoon session
- Show NewYork Afternoon Session end: Displays the end time of the New York afternoon session
- Show NewYork Day Open Price: Displays the day’s opening price for the New York session
- Show NewYork Day High Price: Displays the daily high for the New York session
- Show NewYork Day Low Price: Displays the daily low for the New York session
Conclusion
The ICT Index Futures Vertical Lines Indicator is a precise trading tool for visualizing the session zones of Asia, London, and New York directly on the chart.
The indicator’s settings allow traders to activate key time markers such as CME Open, New York Midnight, and important daily price levels.
By leveraging this information, traders can better understand the daily market structure and identify optimal entry and exit zones.
ICT Index Futures Vertical Lines MT5 PDF
ICT Index Futures Vertical Lines MT5 PDF
Click to download ICT Index Futures Vertical Lines MT5 PDFDoes this indicator provide trade entry signals?
No, the ICT Index Futures Vertical Lines Indicator does not generate trade entry signals.
Which markets is this indicator suitable for?
Although the indicator is designed for CME futures and indices, it is also fully compatible with the Forex market.


