![KAGI 1 Indicator for MetaTrader 5 – Free – [TradingFinder]](https://cdn.tradingfinder.com/image/426065/2-77-en-kagi-1-mt5-1.webp)
![KAGI 1 Indicator for MetaTrader 5 – Free – [TradingFinder] 0](https://cdn.tradingfinder.com/image/426065/2-77-en-kagi-1-mt5-1.webp)
![KAGI 1 Indicator for MetaTrader 5 – Free – [TradingFinder] 1](https://cdn.tradingfinder.com/image/426063/2-77-en-kagi-1-mt5-2.webp)
![KAGI 1 Indicator for MetaTrader 5 – Free – [TradingFinder] 2](https://cdn.tradingfinder.com/image/426064/2-77-en-kagi-1-mt5-3.webp)
![KAGI 1 Indicator for MetaTrader 5 – Free – [TradingFinder] 3](https://cdn.tradingfinder.com/image/426062/2-77-en-kagi-1-mt5-4.webp)
The KAGI 1 Indicator is designed based on the Kagi chart structure for the MetaTrader 5 platform.
Unlike time-based charts, the Kagi chart only changes shape when the price fluctuates by a defined amount.
This trading tool is used to identify significant market trends, price reversal points, and potential entry or exit zones for trades.
KAGI 1 Indicator Table
The general specifications of the KAGI 1 Indicator are presented in the table below.
Indicator Categories: | Price Action MT5 Indicators Oscillators MT5 Indicators Currency Strength MT5 Indicators |
Platforms: | MetaTrader 5 Indicators |
Trading Skills: | Intermediate |
Indicator Types: | Reversal MT5 Indicators |
Timeframe: | Multi-Timeframe MT5 Indicators |
Trading Style: | Intraday MT5 Indicators |
Trading Instruments: | Forex MT5 Indicators Crypto MT5 Indicators Stock MT5 Indicators |
Indicator Overview
The KAGI 1 Indicator uses a colored line to display trend direction and market changes on the oscillator chart.
Color changes help define optimal zones for buy or sell trades as follows:
- Dark blue: Indicates buying pressure and the formation of a bullish trend;
- Light blue: Reflects increasing selling pressure and the beginning of a bearish trend.
Uptrend Condition
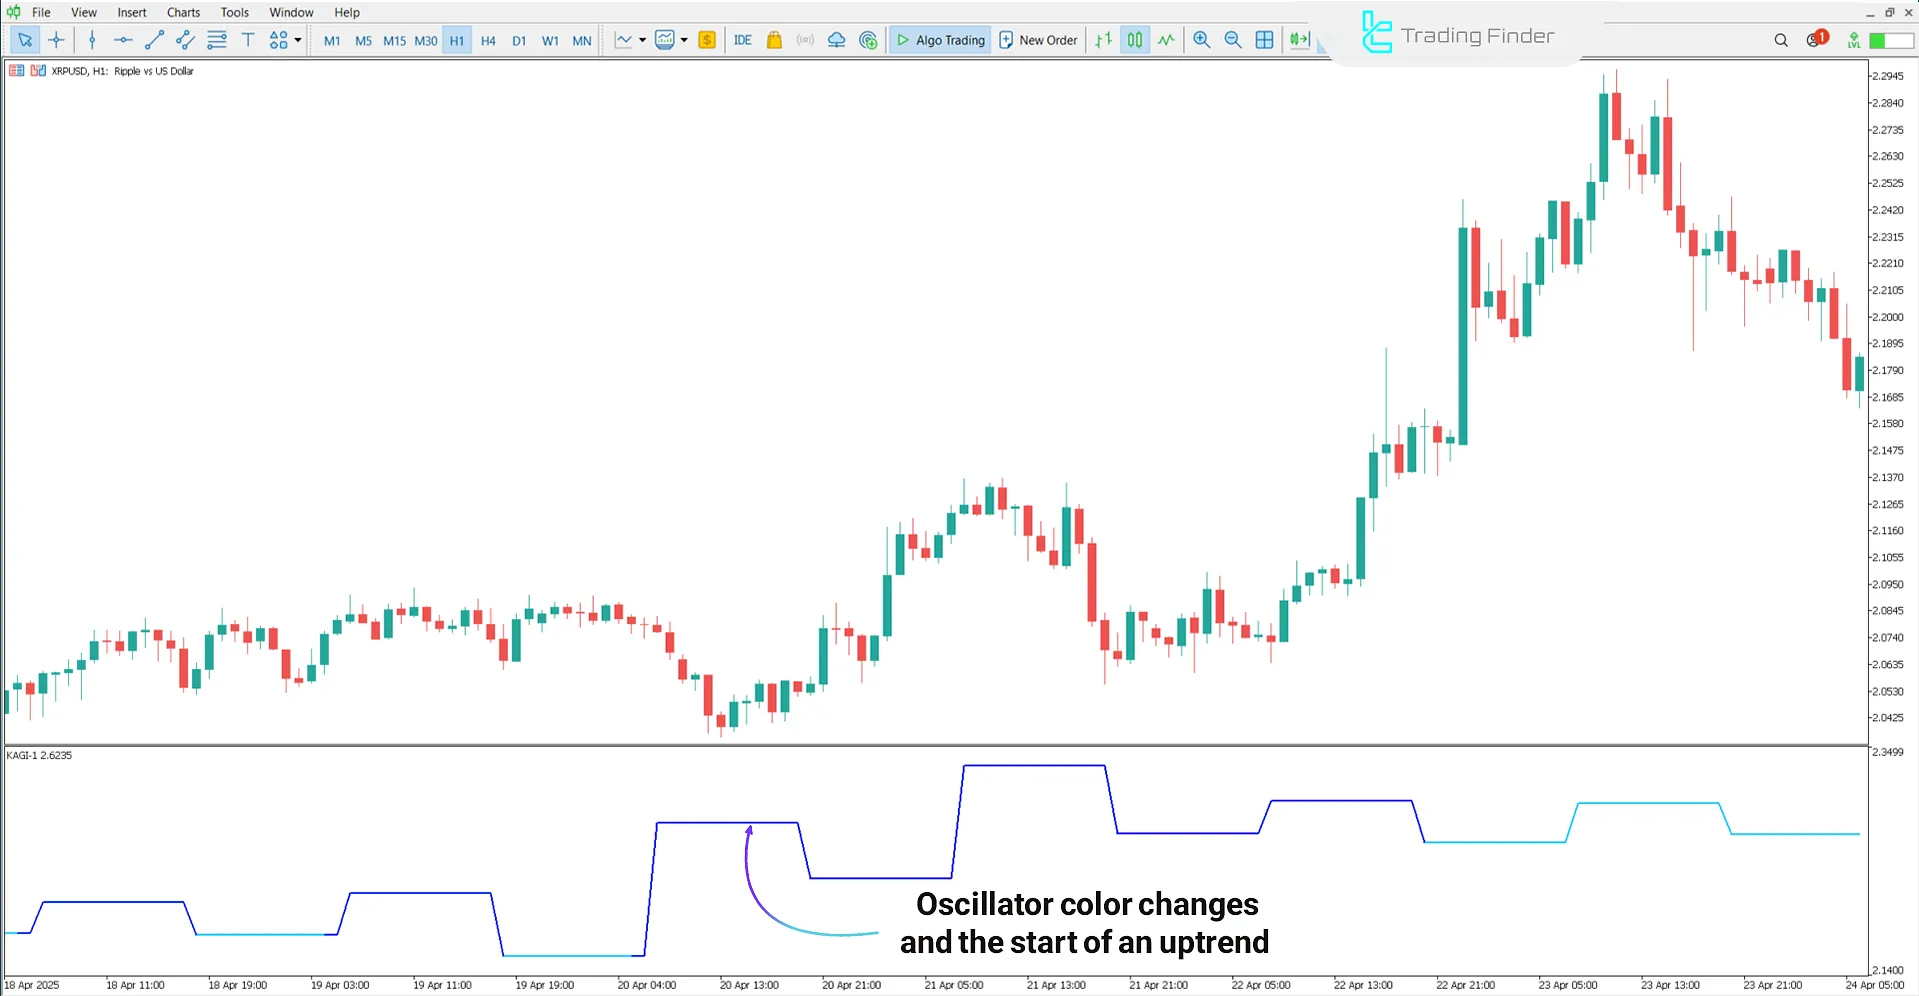
On the 1-hour chart of the Ripple (XRP/USD) cryptocurrency, a color change in the KAGI 1 oscillator line from light blue to dark blue signals a potential shift in market conditions.
If this color shift coincides with the line curving upward, it can be interpreted as a sign of a strengthening uptrend.

Downtrend Condition
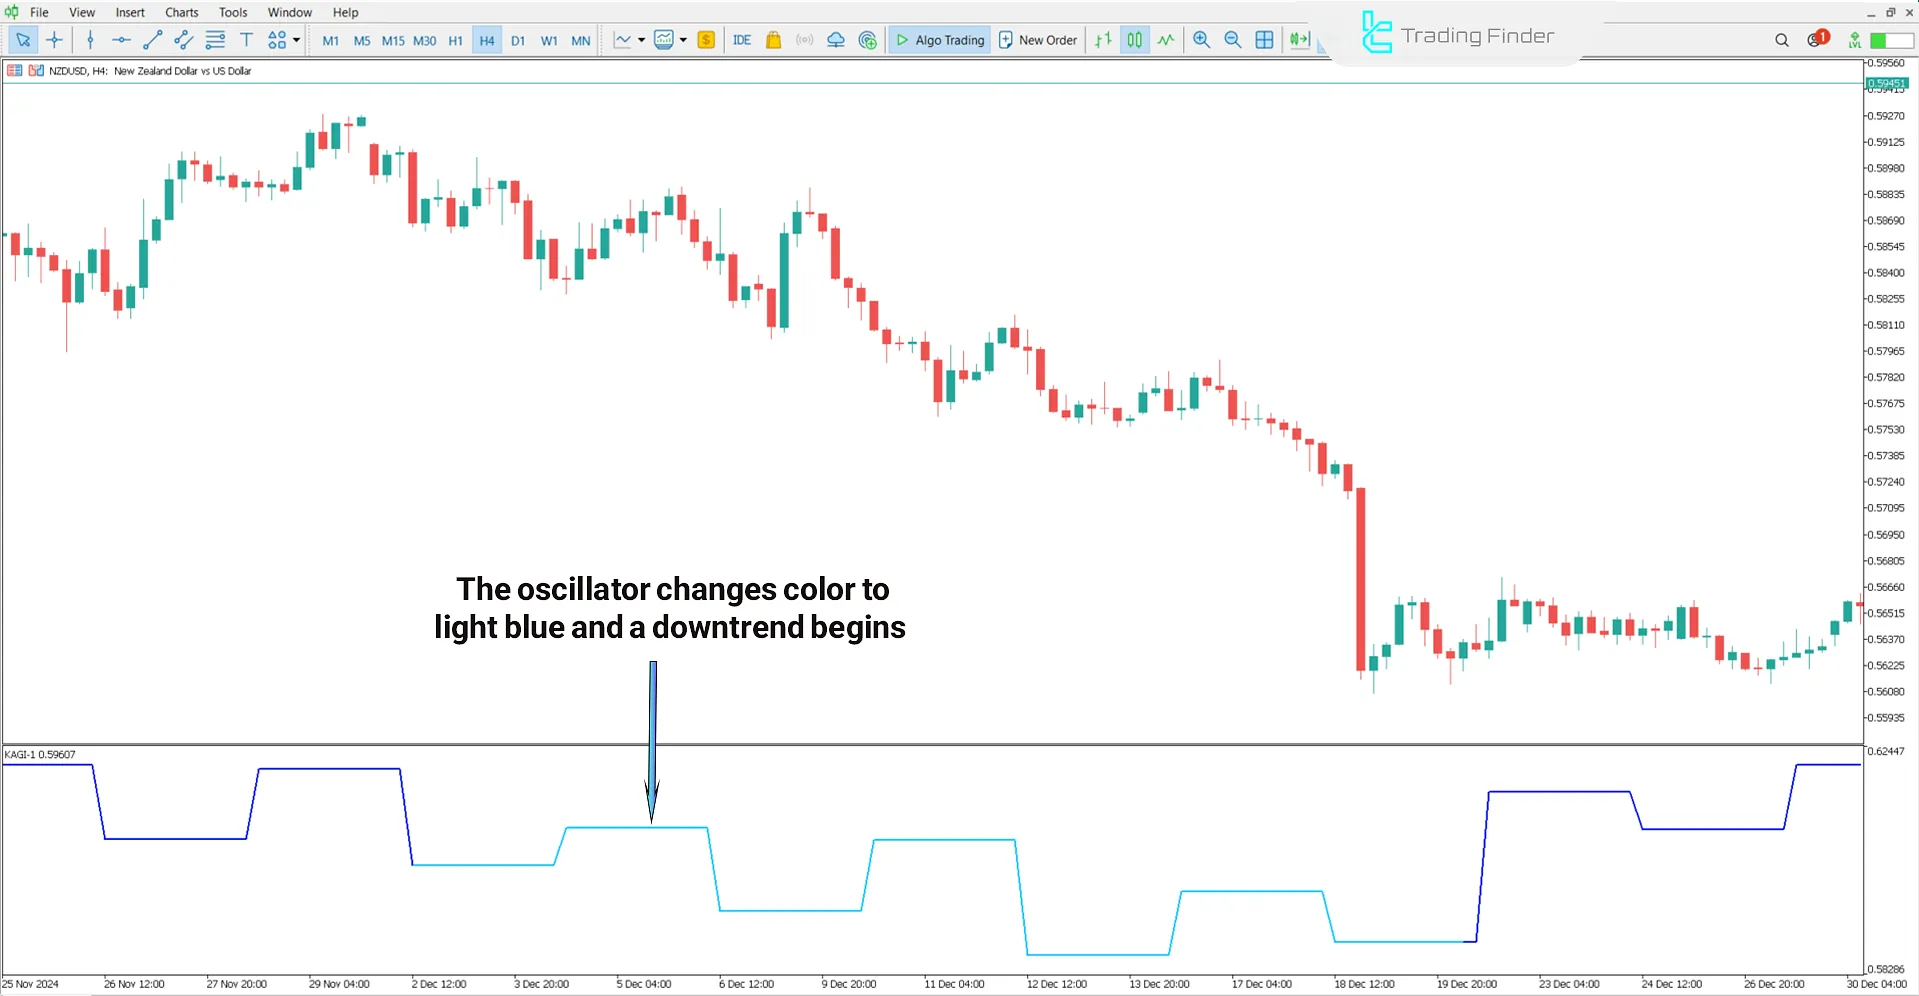
The chart below displays the NZD/USD currency pair in a 4-hour timeframe. If the oscillator line changes from dark blue to light blue and the oscillator slope aligns with the price trend, this setup reflects selling pressure and confirms the strengthening of a bearish trend.

KAGI 1 Indicator Settings
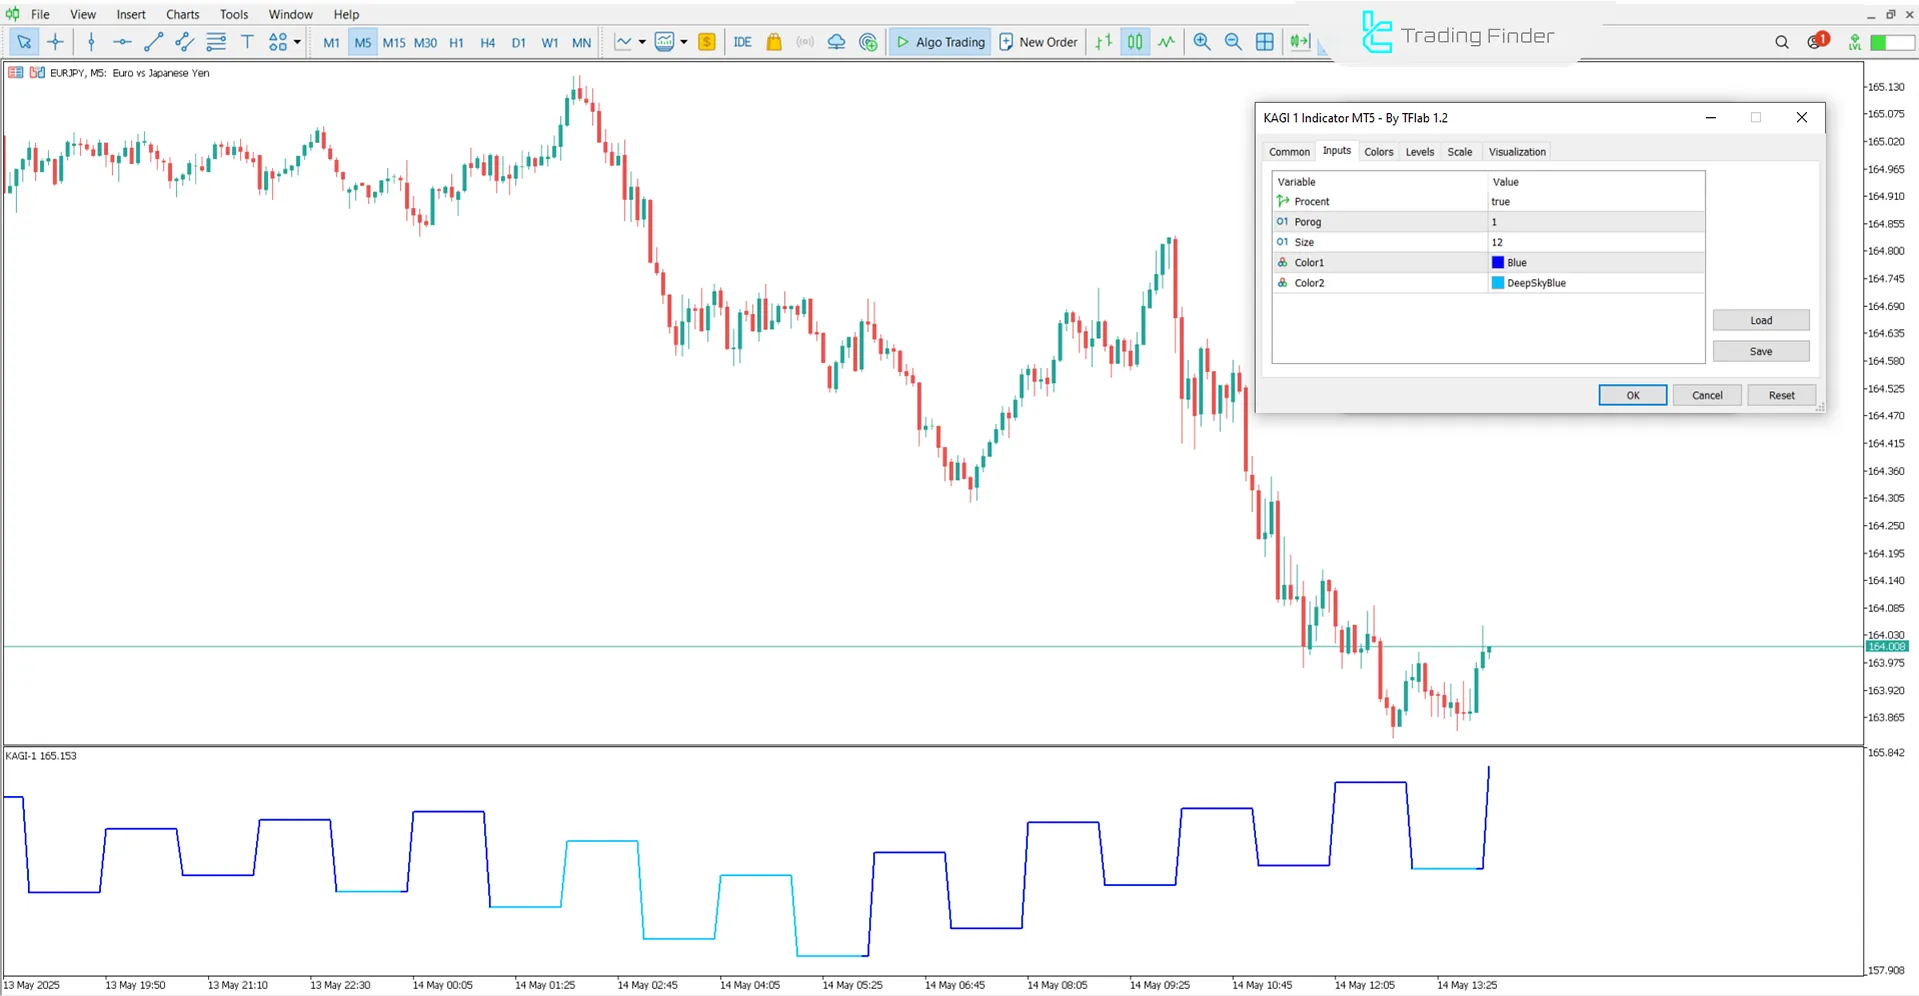
The image below shows the settings section of the KAGI 1 Indicator:

- Percent: Percentage of change;
- Porog: Change threshold;
- Size: Show Size;
- Color1: Uptrend color;
- Color2: Downtrend color.
Conclusion
The KAGI 1 Indicator (KAGI 1) serves as a tool for market trend analysis and price reversal identification, utilizing color transitions.
In this technical analysis, Dark blue represents an uptrend, Light blue indicates a downtrend.
This distinction provides clear visual cues for market direction and entry zones for trades.
KAGI 1 MT5 PDF
KAGI 1 MT5 PDF
Click to download KAGI 1 MT5 PDFWhat is the main application of the KAGI 1 Indicator in technical analysis?
Its primary use is to identify significant market trends, price reversals, and entry and exit zones for trades.
On what basis is the KAGI 1 Indicator designed?
The Kagi 1 Indicator is based on the Kagi chart structure, a non-time-based charting method.


