![Kairi Indicator for MetaTrader 5 Download – Free – [TradingFinder]](https://cdn.tradingfinder.com/image/419808/13-138-en-kairi-mt5-01.webp)
![Kairi Indicator for MetaTrader 5 Download – Free – [TradingFinder] 0](https://cdn.tradingfinder.com/image/419808/13-138-en-kairi-mt5-01.webp)
![Kairi Indicator for MetaTrader 5 Download – Free – [TradingFinder] 1](https://cdn.tradingfinder.com/image/419807/13-138-en-kairi-mt5-02.webp)
![Kairi Indicator for MetaTrader 5 Download – Free – [TradingFinder] 2](https://cdn.tradingfinder.com/image/419809/13-138-en-kairi-mt5-03.webp)
![Kairi Indicator for MetaTrader 5 Download – Free – [TradingFinder] 3](https://cdn.tradingfinder.com/image/419806/13-138-en-kairi-mt5-04.webp)
The Kairi Indicator, developed for MetaTrader 5, is used to display price momentum. This trading tool calculates the deviation of the current price from the Moving Average (MA) and visualizes the results using a blue line chart in a separate window.
Its high flexibility makes it suitable for various markets, including Forex, cryptocurrencies, stocks, and commodities.
Kairi Oscillator Specifications Table
The features and technical specifications of the Kairi Indicator are as follows:
Indicator Categories: | Oscillators MT5 Indicators Currency Strength MT5 Indicators Trading Assist MT5 Indicators |
Platforms: | MetaTrader 5 Indicators |
Trading Skills: | Elementary |
Indicator Types: | Trend MT5 Indicators Reversal MT5 Indicators |
Timeframe: | Multi-Timeframe MT5 Indicators |
Trading Style: | Swing Trading MT5 Indicators Scalper MT5 Indicators Day Trading MT5 Indicators |
Trading Instruments: | Forex MT5 Indicators Crypto MT5 Indicators Stock MT5 Indicators Commodity MT5 Indicators Indices MT5 Indicators Share Stock MT5 Indicators |
Overview of the Kairi Indicator
In the Kairi Oscillator, an increase in momentum is generally considered a sign of overbought conditions.
Conversely, a decline in momentum may indicate oversold zones. This makes the Kairi Indicator a valuable tool for identifying potential reversal points in price.
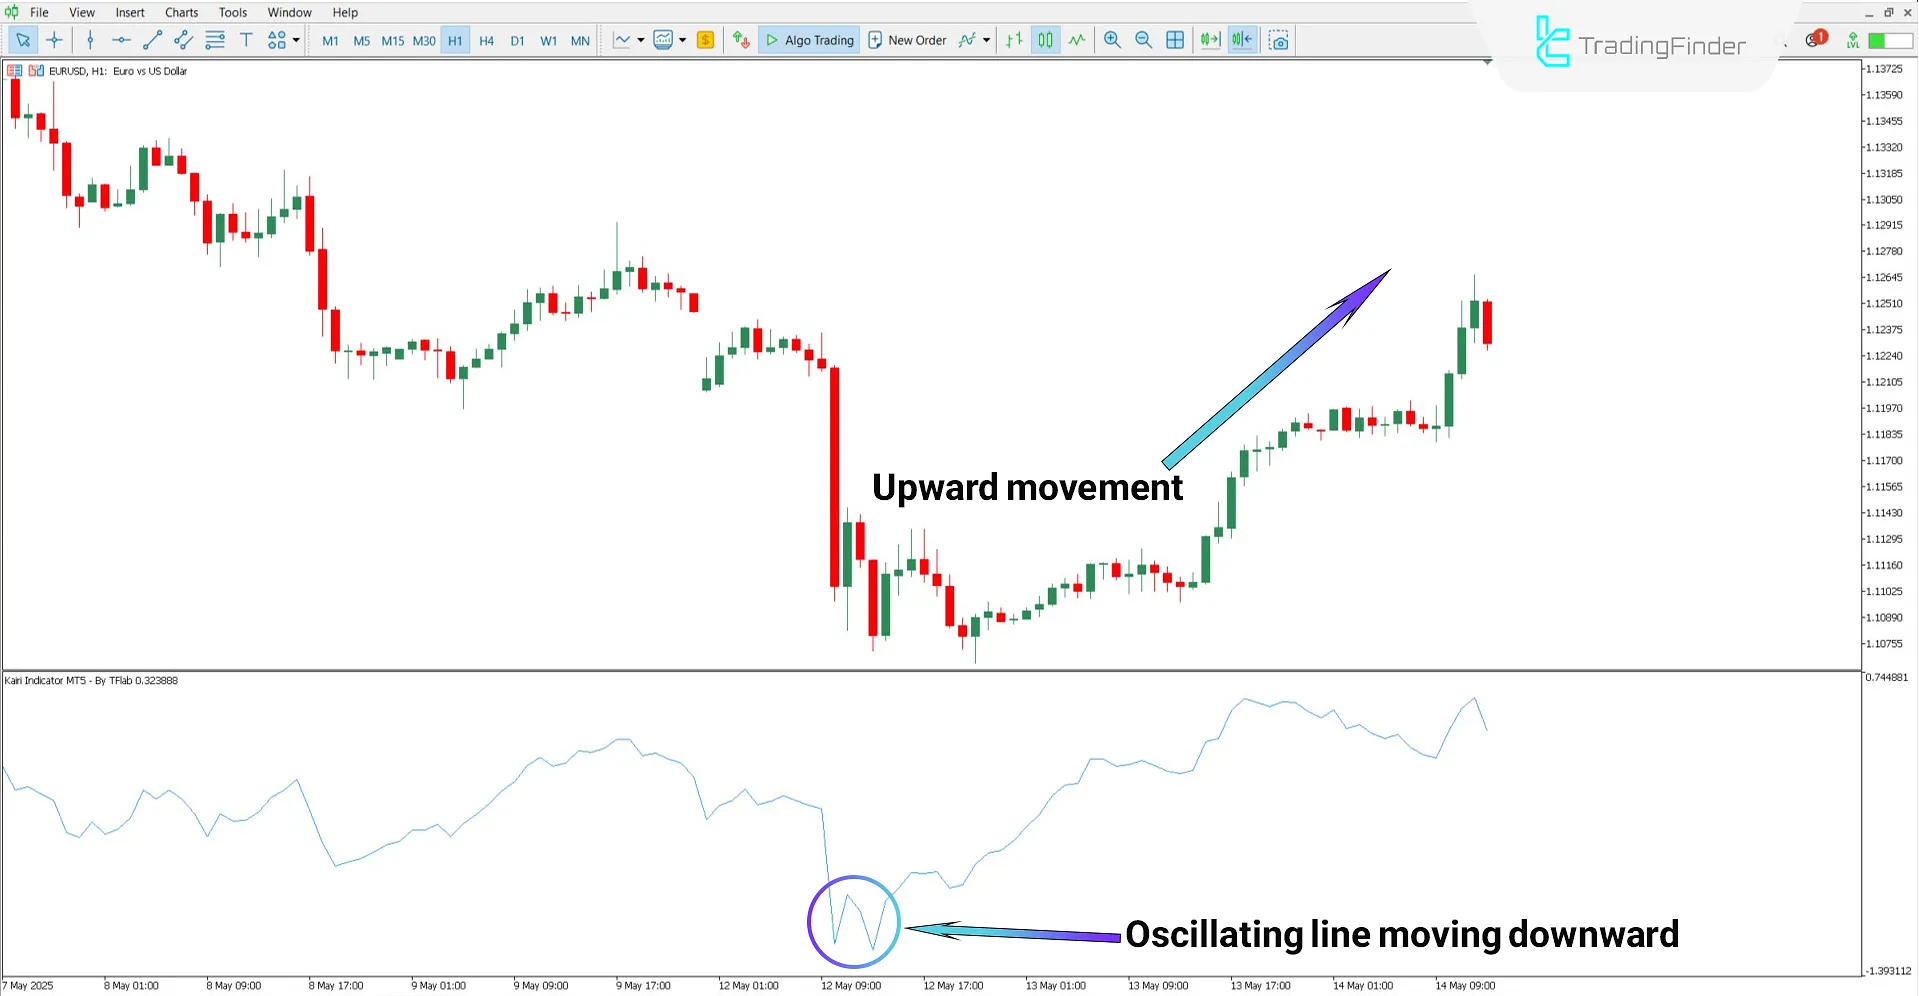
Buy Signal
Based on the EUR/USD 1-hour chart, a gradual decline in momentum entering negative territory signals an oversold condition.
This increases the likelihood of a price reversal and trend change in the current range.

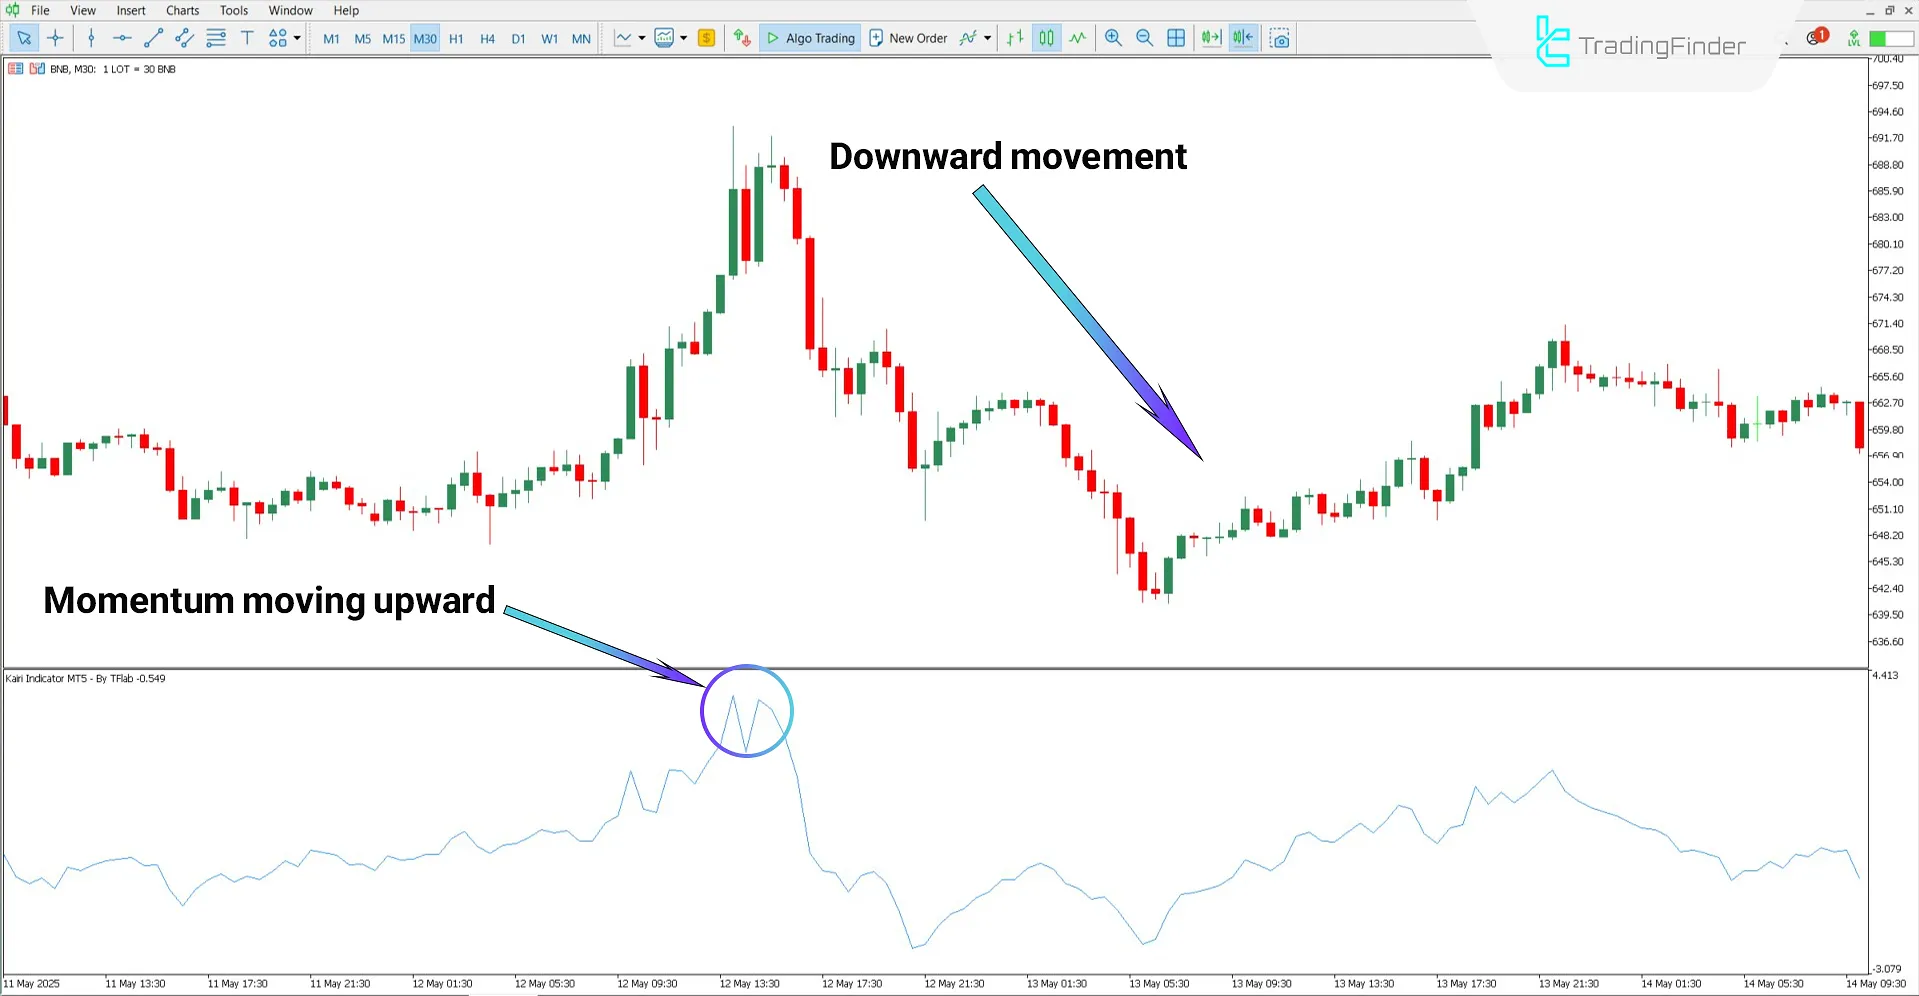
Sell Signal
According to the 30-minute chart of Binance Coin (BNB), momentum has significantly increased and stabilized above the zero line.
This situation is typically seen as an overbought signal, increasing the probability of a trend reversal. Traders may choose to enter a sell position depending on their strategy.

Kairi Oscillator Settings
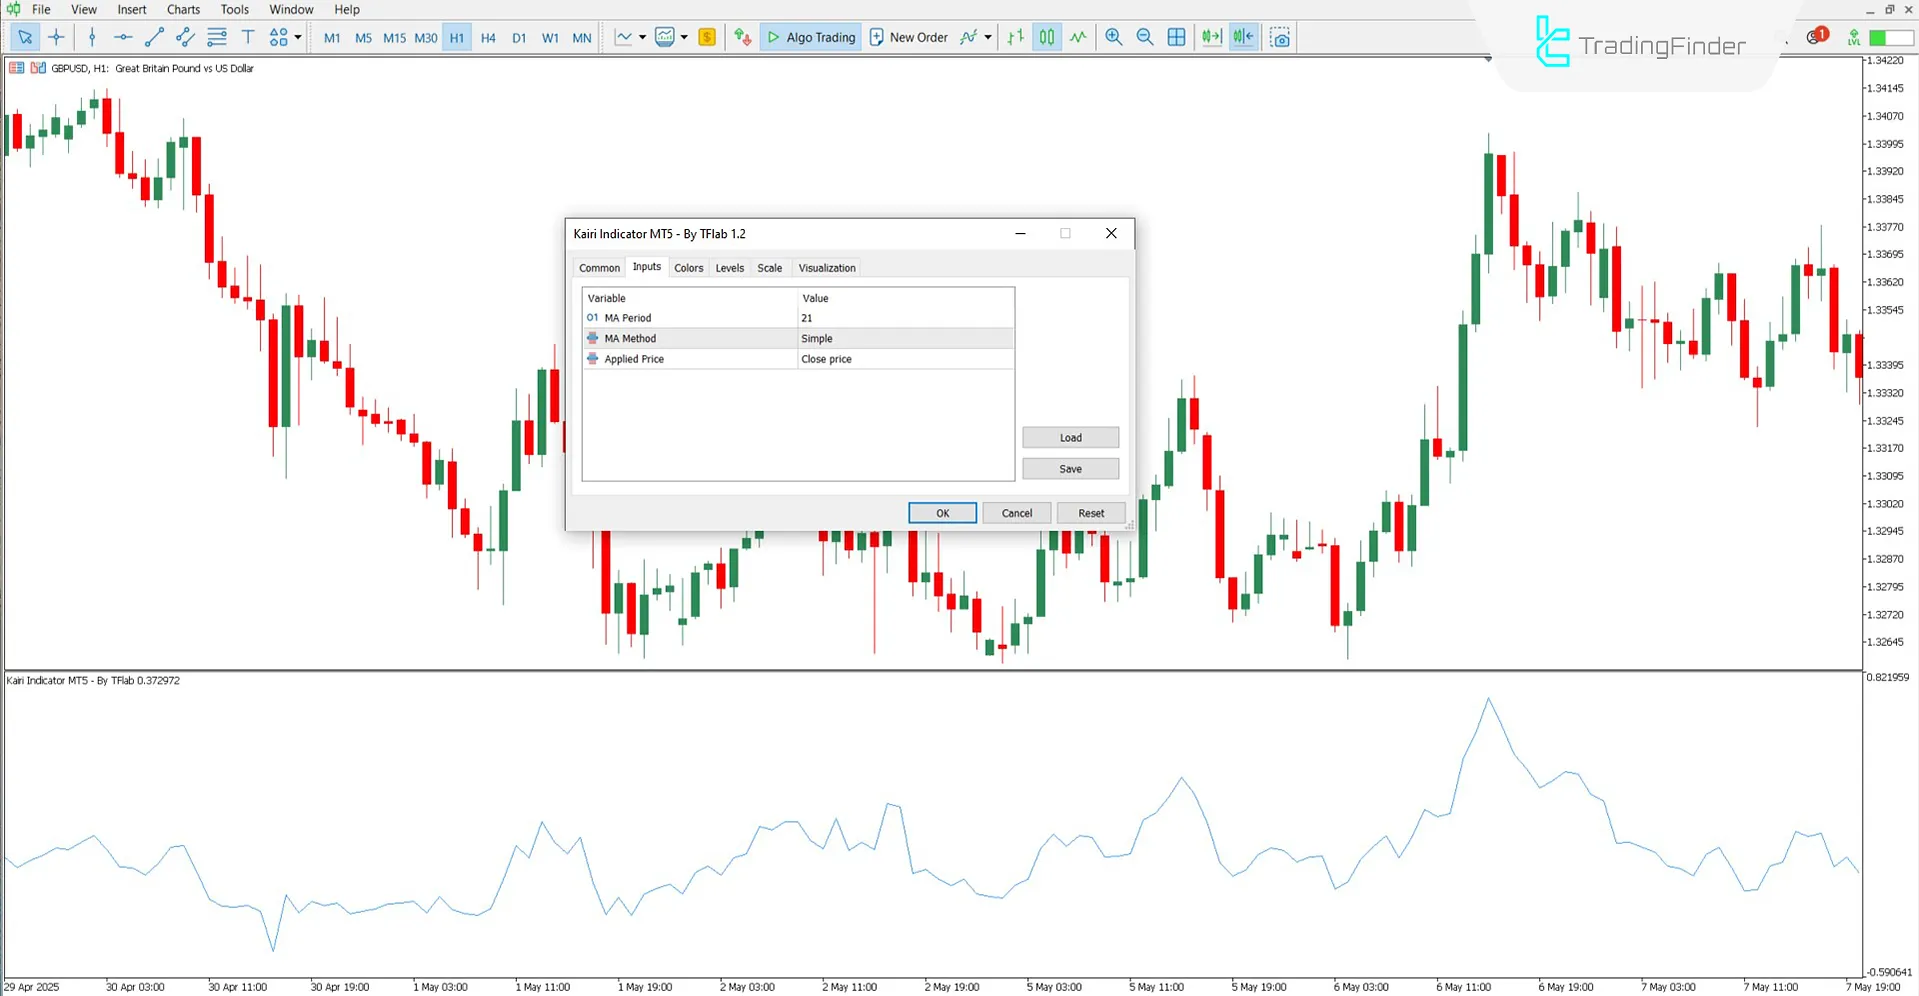
The image below shows the settings fields for the Kairi Indicator:

- MA Period: Calculation period for the moving average
- MA Method: Moving average used
- Applied Price: Price type used in indicator calculations
Conclusion
The Kairi Indicator, through a fluctuating line, displays overbought and oversold conditions within the oscillator window.
Trading signals in this tool are based on the position of the oscillator line relative to the midpoint (zero); crossing this level may indicate a market direction change.
Another key feature of this indicator is its multi timeframe compatibility, which allows it to be used across all time intervals.
What is the Kairi Indicator?
It’s a key tool in technical analysis that displays momentum as well as overbought and oversold levels.
Is the Kairi Indicator suitable for the Forex market?
Yes, this indicator is suitable for all markets, including the Foreign Exchange (forex) market.


