![KDJ Indicator in MetaTrader 5 Download - Free - [TradingFinder]](https://cdn.tradingfinder.com/image/170546/4-29-en-kdj-indicator-mt5-1.webp)
![KDJ Indicator in MetaTrader 5 Download - Free - [TradingFinder] 0](https://cdn.tradingfinder.com/image/170546/4-29-en-kdj-indicator-mt5-1.webp)
![KDJ Indicator in MetaTrader 5 Download - Free - [TradingFinder] 1](https://cdn.tradingfinder.com/image/170513/4-29-en-kdj-indicator-mt5-2.webp)
![KDJ Indicator in MetaTrader 5 Download - Free - [TradingFinder] 2](https://cdn.tradingfinder.com/image/170520/4-29-en-kdj-indicator-mt5-3.webp)
![KDJ Indicator in MetaTrader 5 Download - Free - [TradingFinder] 3](https://cdn.tradingfinder.com/image/170518/4-29-en-kdj-indicator-mt5-4.webp)
The KDJ indicator is an advanced version of the Stochastic Oscillator used for precise price movement analysis in MetaTrader 5 indicators. This indicator consists of three main lines: K, D, and J, each serving a specific purpose.
The J line, which is the primary distinction between KDJ and the Stochastic Oscillator, highlights the variations between the K and D lines, making it particularly effective for identifying overbought and oversold conditions.
KDJ Indicator Specifications
Indicator Categories: | Price Action MT5 Indicators Oscillators MT5 Indicators Currency Strength MT5 Indicators |
Platforms: | MetaTrader 5 Indicators |
Trading Skills: | Intermediate |
Indicator Types: | Trend MT5 Indicators Reversal MT5 Indicators |
Timeframe: | Multi-Timeframe MT5 Indicators |
Trading Style: | Day Trading MT5 Indicators |
Trading Instruments: | Forex MT5 Indicators Crypto MT5 Indicators Stock MT5 Indicators Forward MT5 Indicators Share Stock MT5 Indicators |
Overview of the Indicator
The indicator activates when the J line (green) crosses above the K and D lines, indicating an overbought condition. Conversely, when the J line falls below the K and D lines, it signifies an oversold condition.
Using the KDJ indicator on longer timeframes (e.g., daily or weekly) is more effective as it minimizes market noise and provides more reliable trends.
Bullish Trend in the Indicator
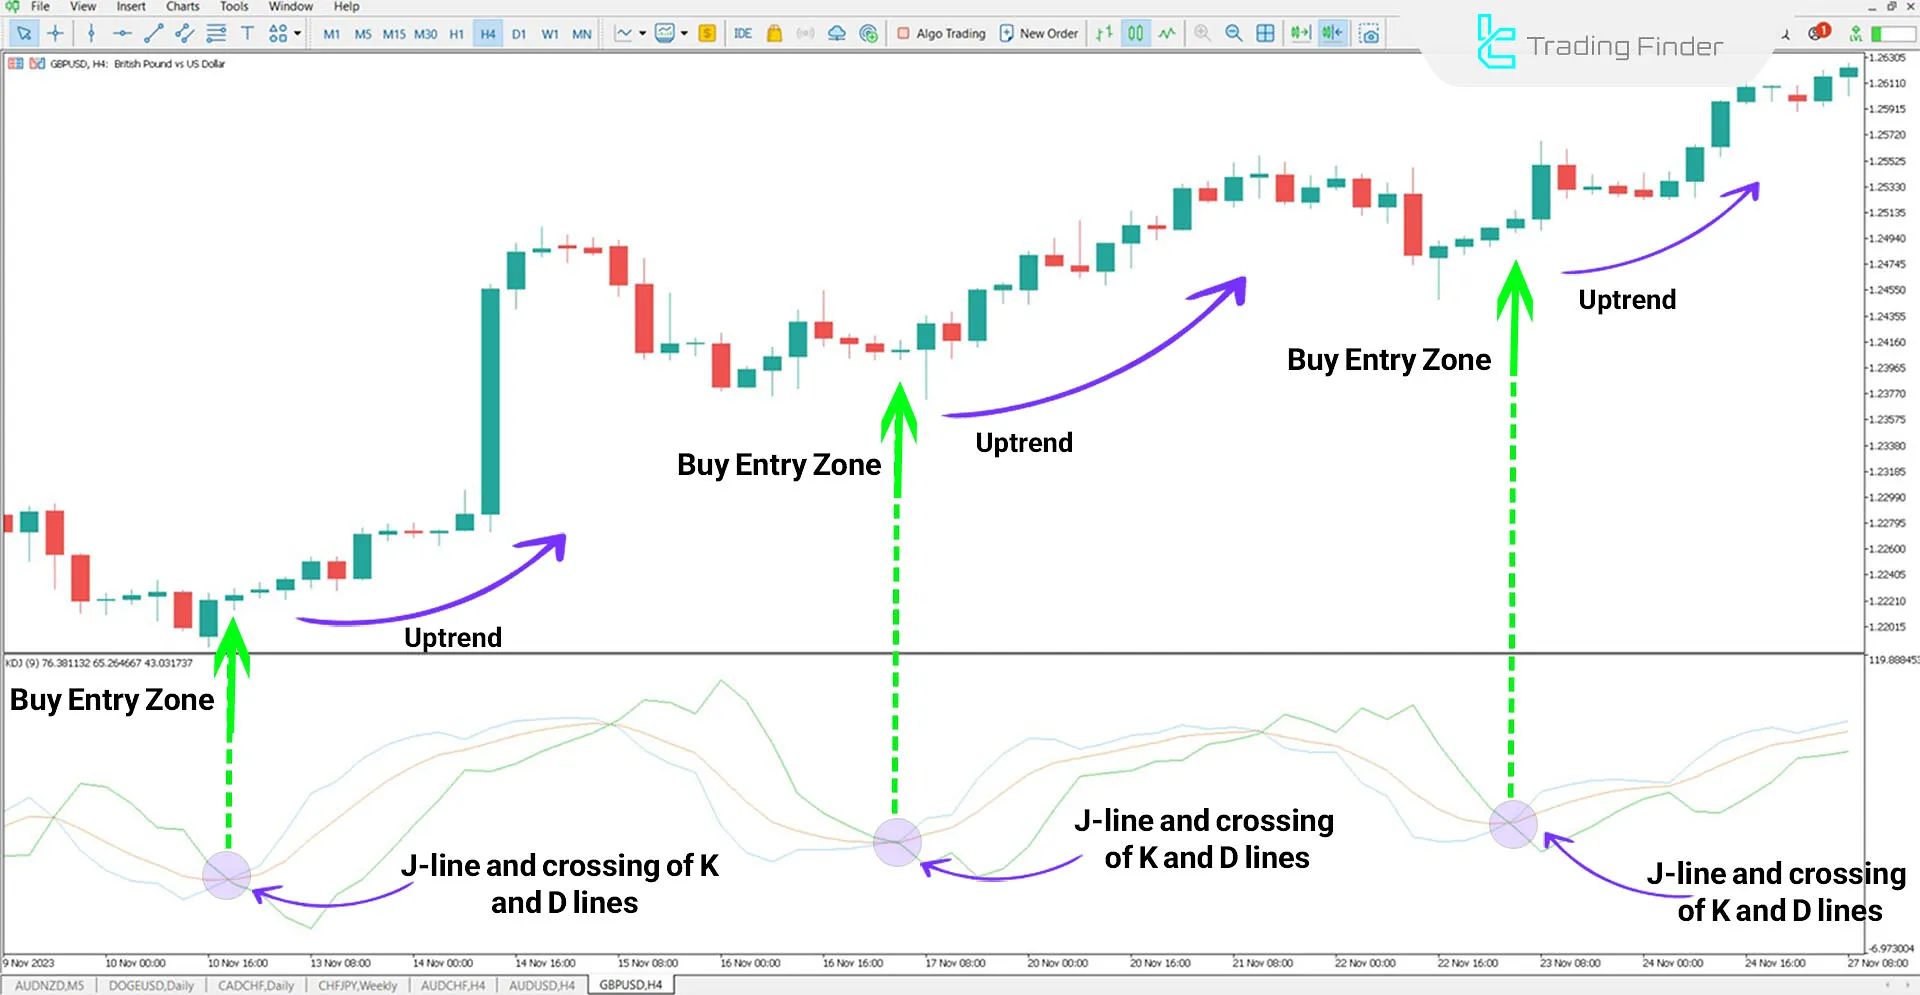
When the J line crosses below the K and D lines and then moves upwards under bullish conditions, it signals oversold conditions and indicates a potential trend reversal from bearish to bullish.
Traders can leverage this indicator, along with necessary confirmations within their strategies, to accurately identify Entry and Exit points for their trades.

Bearish Trend in the Indicator
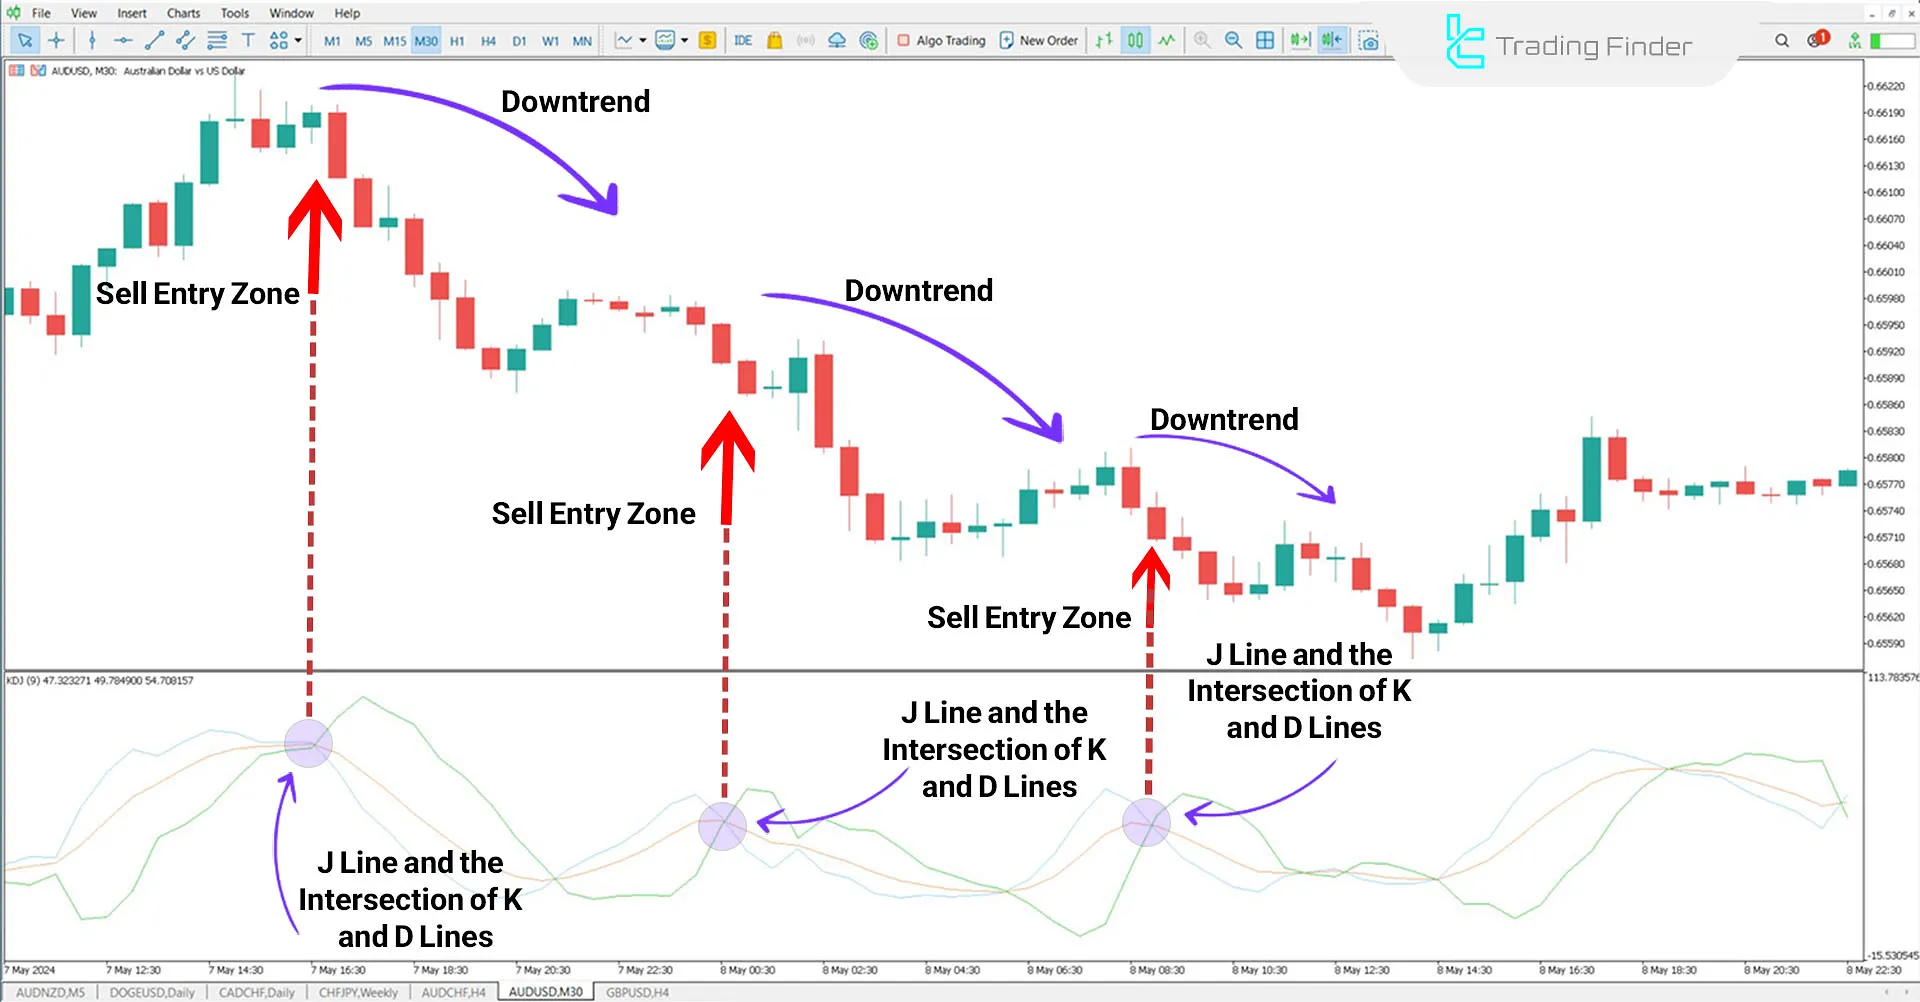
In bearish conditions, such as with the AUD/USD currency pair, the J line crossing above the K and D lines signals overbought conditions and a decrease in buyer strength.
A trend reversal typically occurs near resistance levels or after the formation of strong bearish candles. Traders can enter Sell trades after confirming the signal through other Trading Assist Indicators, specialized tools designed to support precise market analysis and decision-making.

KDJ Indicator Settings

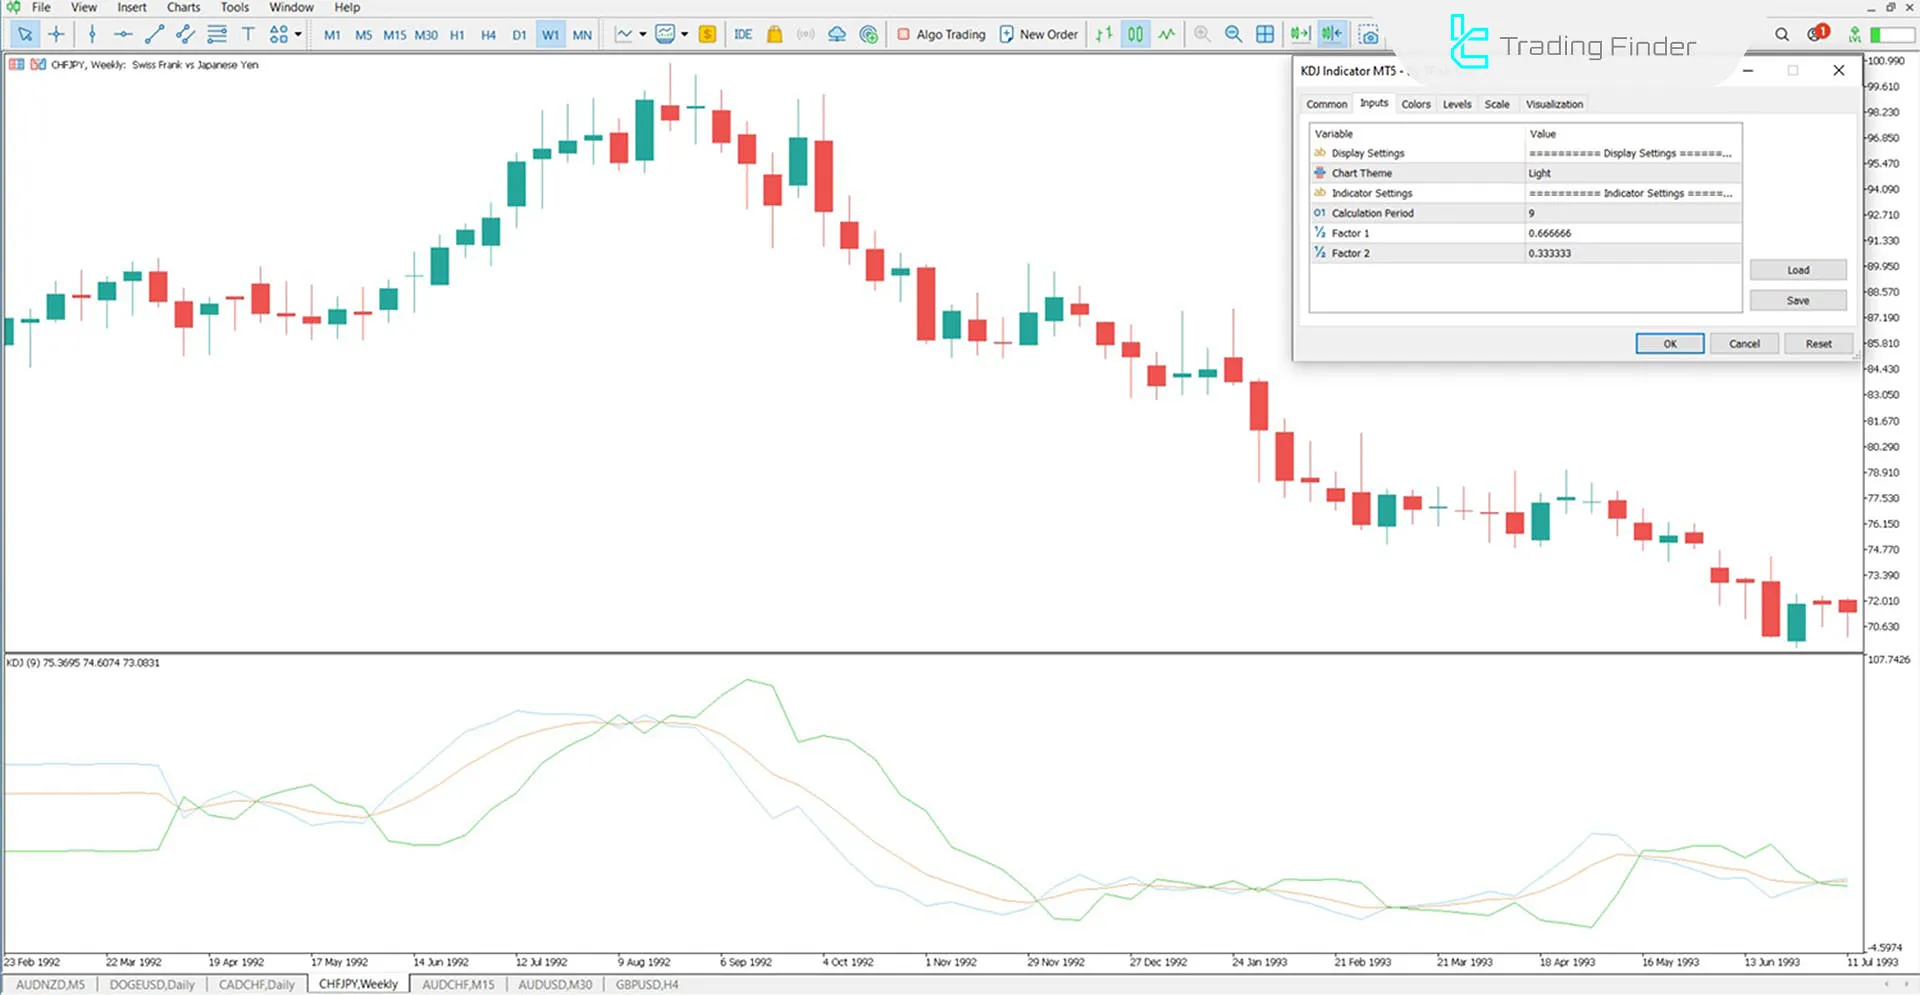
- Chart Theme: Display chart background;
- Period: Indicator calculation period (default: 9);
- Factor1: Smoothing factor 1 for line calculations (default: 0.666666);
- Factor 2: Smoothing factor 2 for line calculations (default: 0.333333).
Conclusion
The KDJ indicator in MetaTrader 5 is an effective tool for identifying overbought and oversold conditions and analyzing trend changes. Compared to the Stochastic Oscillator, it delivers more precise signals.
The J line, a key distinction of this indicator, quickly reflects variations, providing greater sensitivity in detecting reversal points.
KDJ Meta MT5 PDF
KDJ Meta MT5 PDF
Click to download KDJ Meta MT5 PDFWhat is the best timeframe for using the KDJ indicator?
The KDJ indicator works efficiently on all timeframes, but longer timeframes (e.g., daily or weekly) are recommended for better reliability.
How to use the indicator for bearish trends (Sell)?
The J line above the K and D lines indicates overbought conditions and the start of a bearish trend. Confirmation from resistance levels or bearish candles is essential.


