![Knoxville Divergence Indicator MT5 Download – Free – [TradingFinder]](https://cdn.tradingfinder.com/image/521539/13-198-en-knoxville-divergence-mt5-01.webp)
![Knoxville Divergence Indicator MT5 Download – Free – [TradingFinder] 0](https://cdn.tradingfinder.com/image/521539/13-198-en-knoxville-divergence-mt5-01.webp)
![Knoxville Divergence Indicator MT5 Download – Free – [TradingFinder] 1](https://cdn.tradingfinder.com/image/521536/13-198-en-knoxville-divergence-mt5-02.webp)
![Knoxville Divergence Indicator MT5 Download – Free – [TradingFinder] 2](https://cdn.tradingfinder.com/image/521533/13-198-en-knoxville-divergence-mt5-03.webp)
![Knoxville Divergence Indicator MT5 Download – Free – [TradingFinder] 3](https://cdn.tradingfinder.com/image/521537/13-198-en-knoxville-divergence-mt5-04.webp)
The Knoxville Divergence Indicator is built using two technical indicators: Relative Strength Index (RSI) and Momentum.
By analyzing the difference between price movement and momentum, this indicator identifies conditions where the current trend may weaken, signaling the possibility of a reversal or price correction.
Knoxville Divergence Detection Indicator Specifications Table
The specifications of the Knoxville Divergence Detection Indicator are presented in the table below.
Indicator Categories: | Signal & Forecast MT5 Indicators Trading Assist MT5 Indicators Momentum Indicators in MT5 |
Platforms: | MetaTrader 5 Indicators |
Trading Skills: | Intermediate |
Indicator Types: | Reversal MT5 Indicators |
Timeframe: | Multi-Timeframe MT5 Indicators |
Trading Style: | Swing Trading MT5 Indicators Scalper MT5 Indicators Day Trading MT5 Indicators |
Trading Instruments: | Forex MT5 Indicators Crypto MT5 Indicators Stock MT5 Indicators |
Knoxville Divergence Detection Indicator at a Glance
The Knoxville Divergence Indicator analyzes momentum to detect price divergences and displays them as colored lines on the chart.
These lines include:
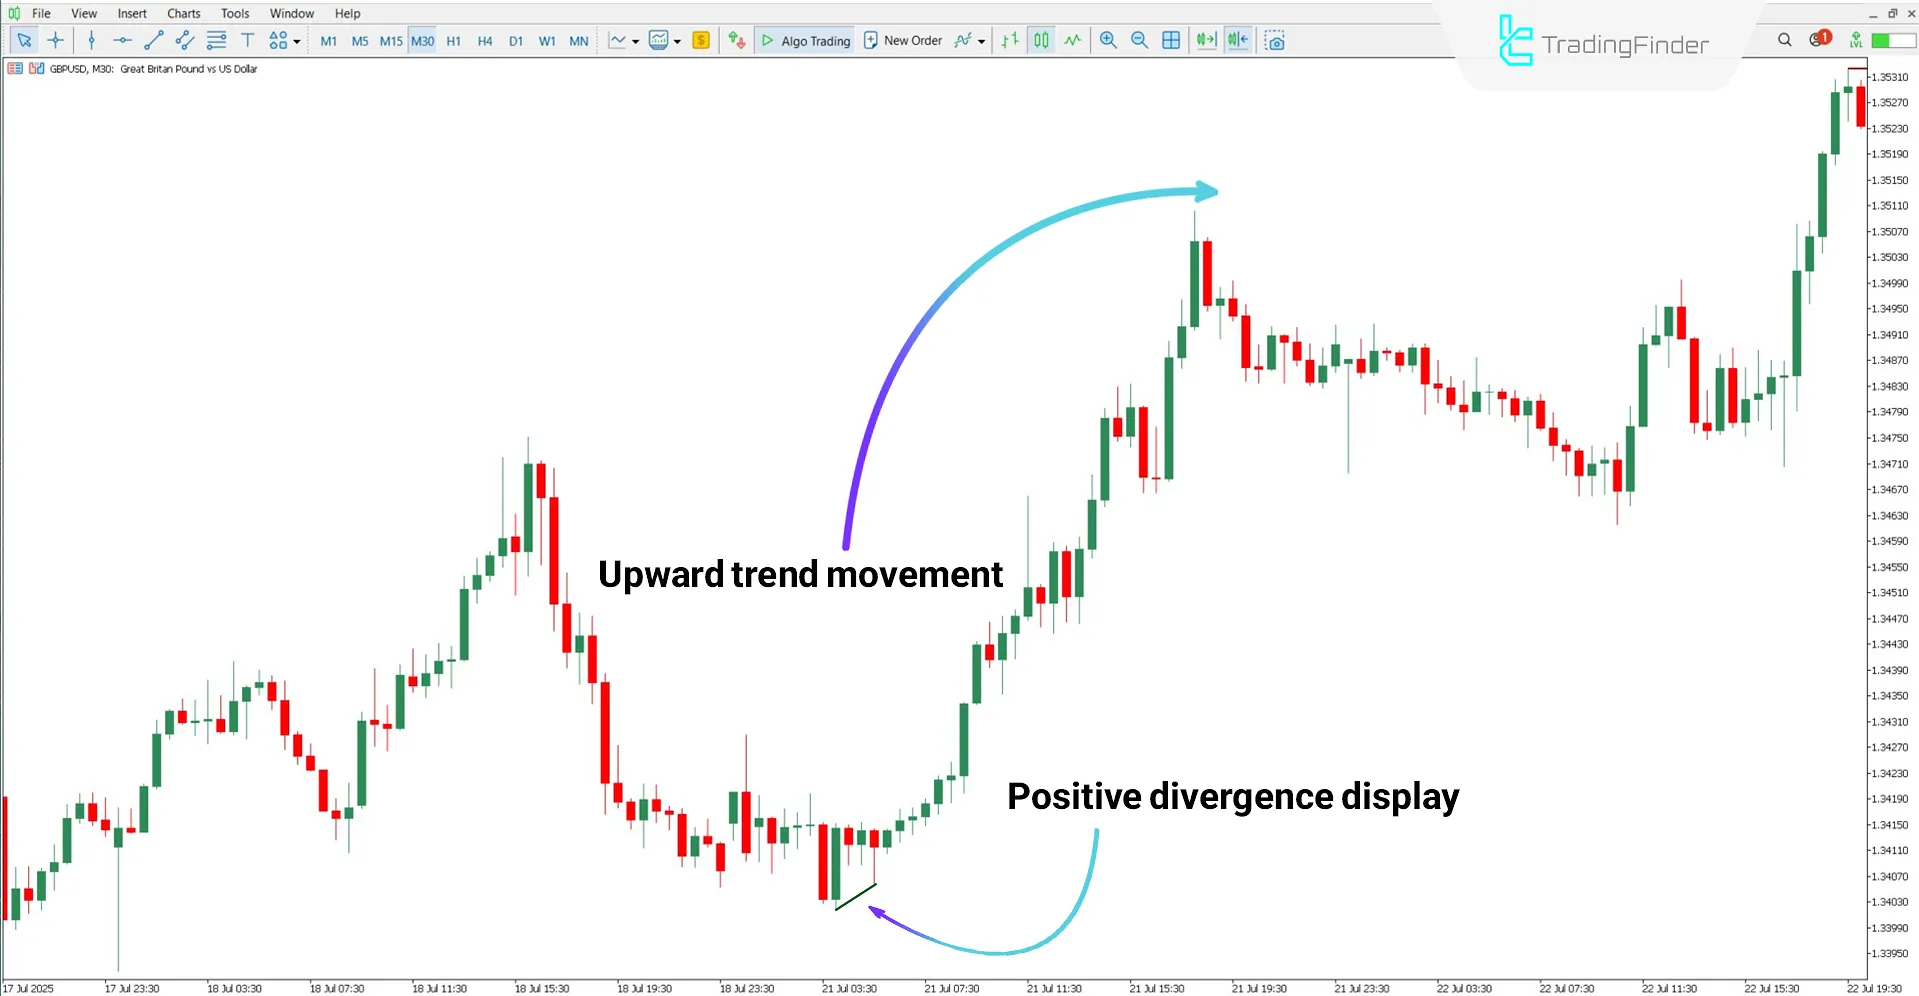
- Green line: Represents positive divergence
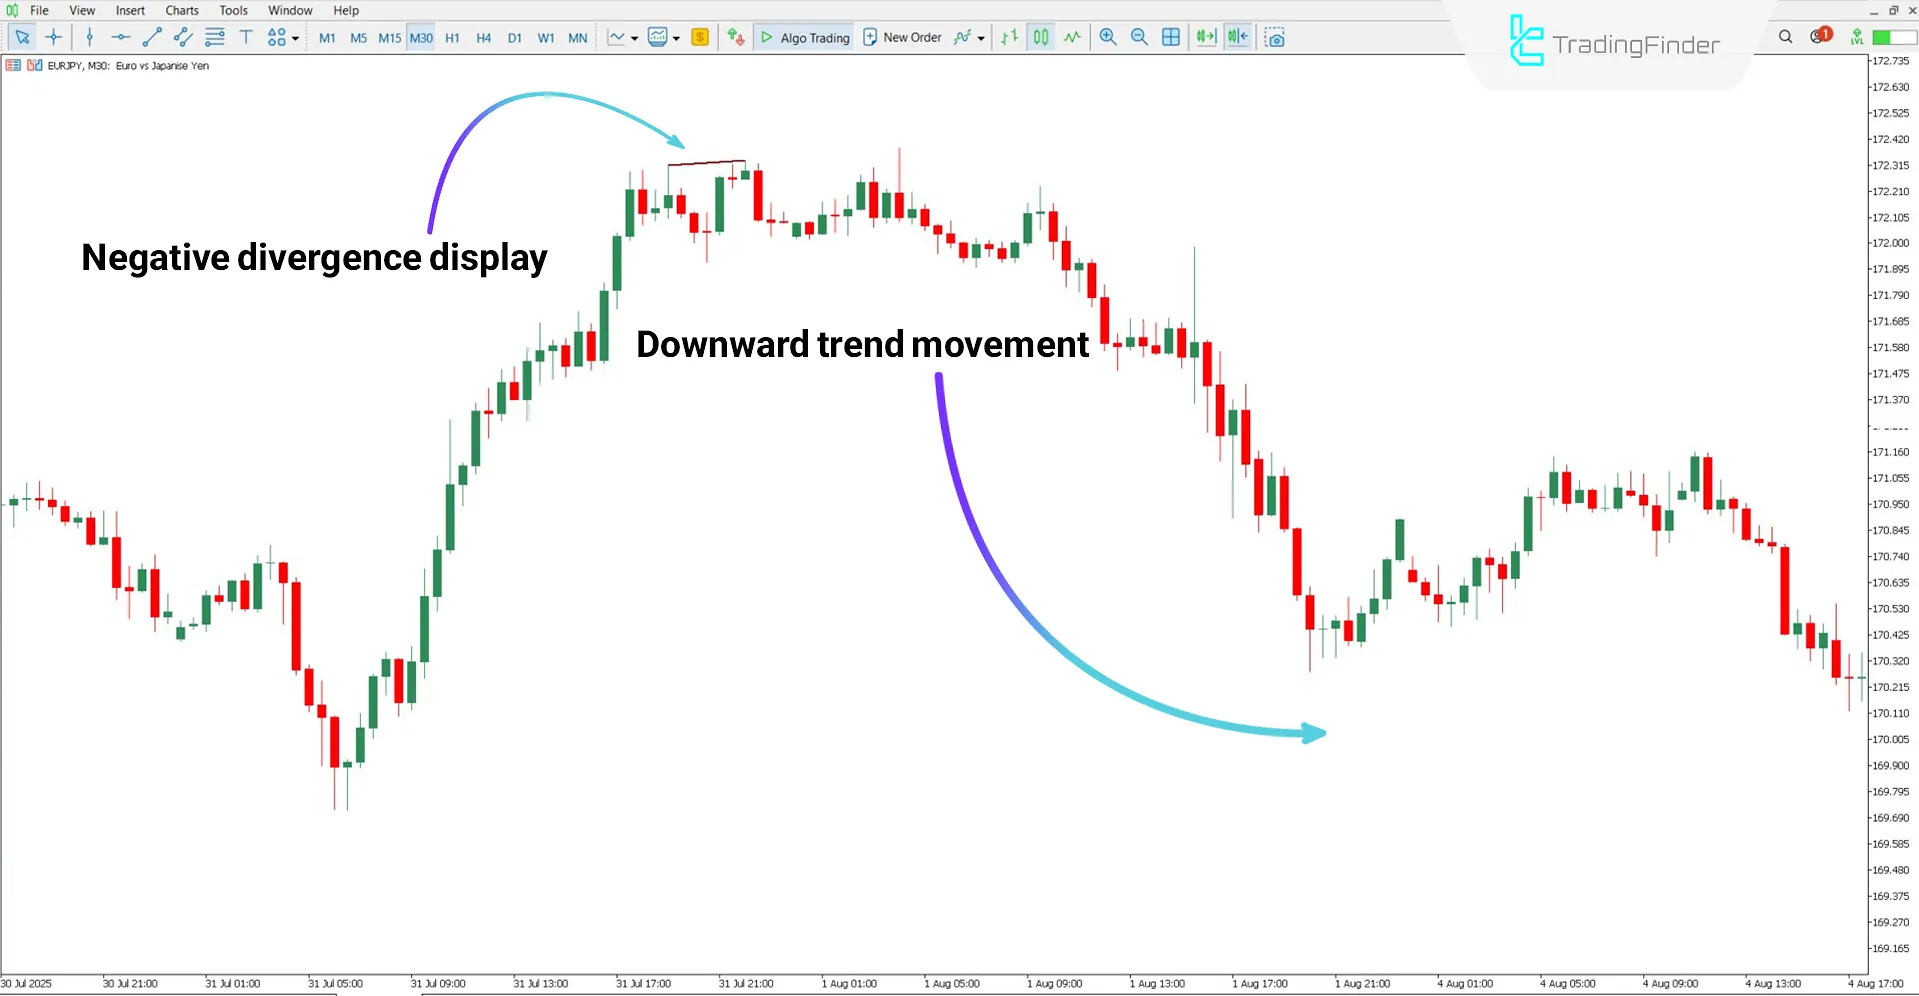
- Red line: Indicates the presence of negative divergence
Positive Divergence
According to the GBP/USD 30-minute chart, the indicator has identified a divergence between price and momentum and displayed it on the chart.
In such a situation, traders may enter buy positions based on their analysis and trading strategy.

Negative Divergence
According to the EUR/JPY chart, by comparing price movement and momentum, the indicator has revealed a negative divergence. As shown in the chart, the price entered a downtrend after this divergence appeared.

Knoxville Divergence Indicator Settings
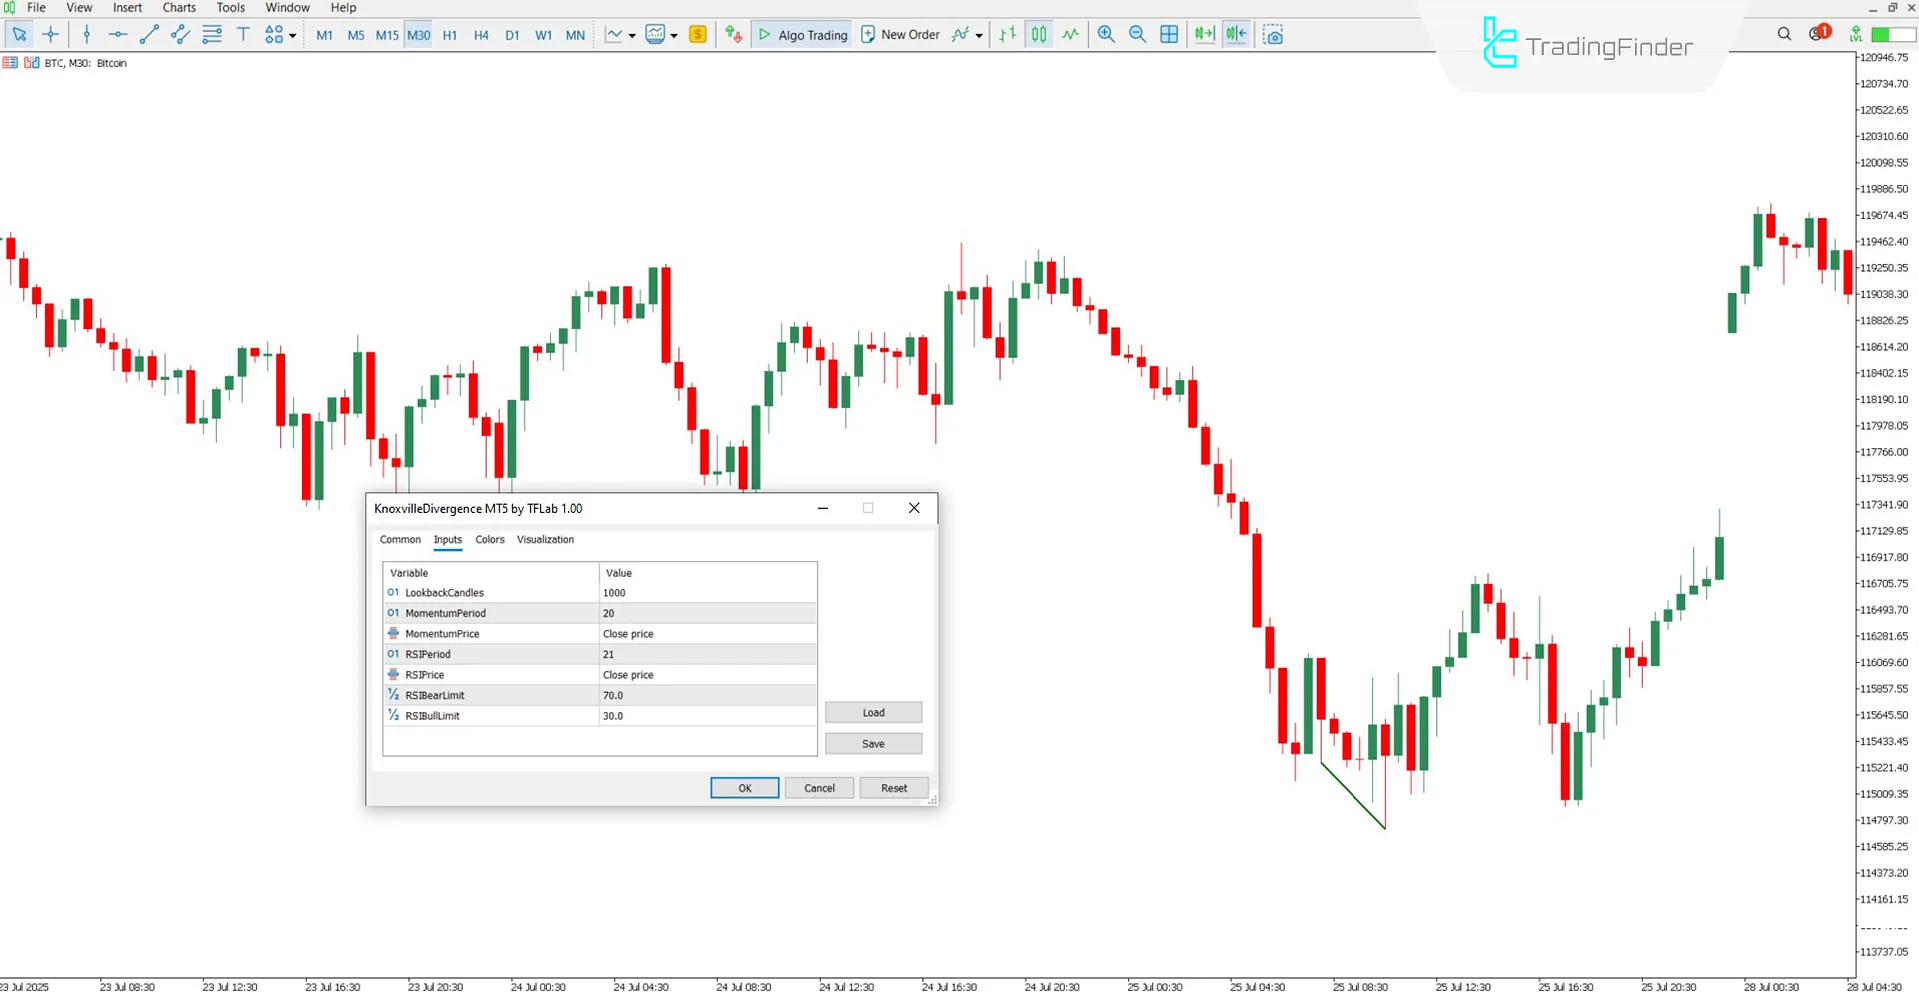
The following image shows the settings panel of the Knoxville Divergence Detection Indicator:

- LookbackCandles: Number of candles analyzed for divergence
- MomentumPeriod: Momentum calculation period
- MomentumPrice: Price for momentum calculation
- RSIPeriod: RSI calculation period
- RSIPrice: Price for RSI calculation
- RSIBearLimit: Overbought threshold
- RSIBullLimit: Oversold threshold
Conclusion
The Knoxville Divergence Detection Indicator, using the RSI and Momentum, analyzes the difference between price movement and actual market strength to identify divergences.
These divergences are shown as a green line for bullish signals and a red line for bearish signals on the chart. The main role of this indicator is to provide early warnings for potential trend reversal zones.
Knoxville Divergence Indicator MT5 PDF
Knoxville Divergence Indicator MT5 PDF
Click to download Knoxville Divergence Indicator MT5 PDFIs this indicator only applicable in the Forex market?
No, the Knoxville Divergence Indicator can be used in all markets.
What do the green lines represent?
These lines indicate positive divergences.


