![Kumo Cloud Heatmap Indicator MT5 Download – Free – [TradingFinder]](https://cdn.tradingfinder.com/image/599222/13-245-en-kumo-cloud-heatmap-mt5-01.webp)
![Kumo Cloud Heatmap Indicator MT5 Download – Free – [TradingFinder] 0](https://cdn.tradingfinder.com/image/599222/13-245-en-kumo-cloud-heatmap-mt5-01.webp)
![Kumo Cloud Heatmap Indicator MT5 Download – Free – [TradingFinder] 1](https://cdn.tradingfinder.com/image/599203/13-245-en-kumo-cloud-heatmap-mt5-02.webp)
![Kumo Cloud Heatmap Indicator MT5 Download – Free – [TradingFinder] 2](https://cdn.tradingfinder.com/image/599209/13-245-en-kumo-cloud-heatmap-mt5-03.webp)
![Kumo Cloud Heatmap Indicator MT5 Download – Free – [TradingFinder] 3](https://cdn.tradingfinder.com/image/599220/13-245-en-kumo-cloud-heatmap-mt5-04.webp)
The Kumo Cloud Heatmap Indicator is based on the concepts of the Ichimoku indicator, but instead of showing the complex details of the system, it presents the market conditions in a simplified manner.
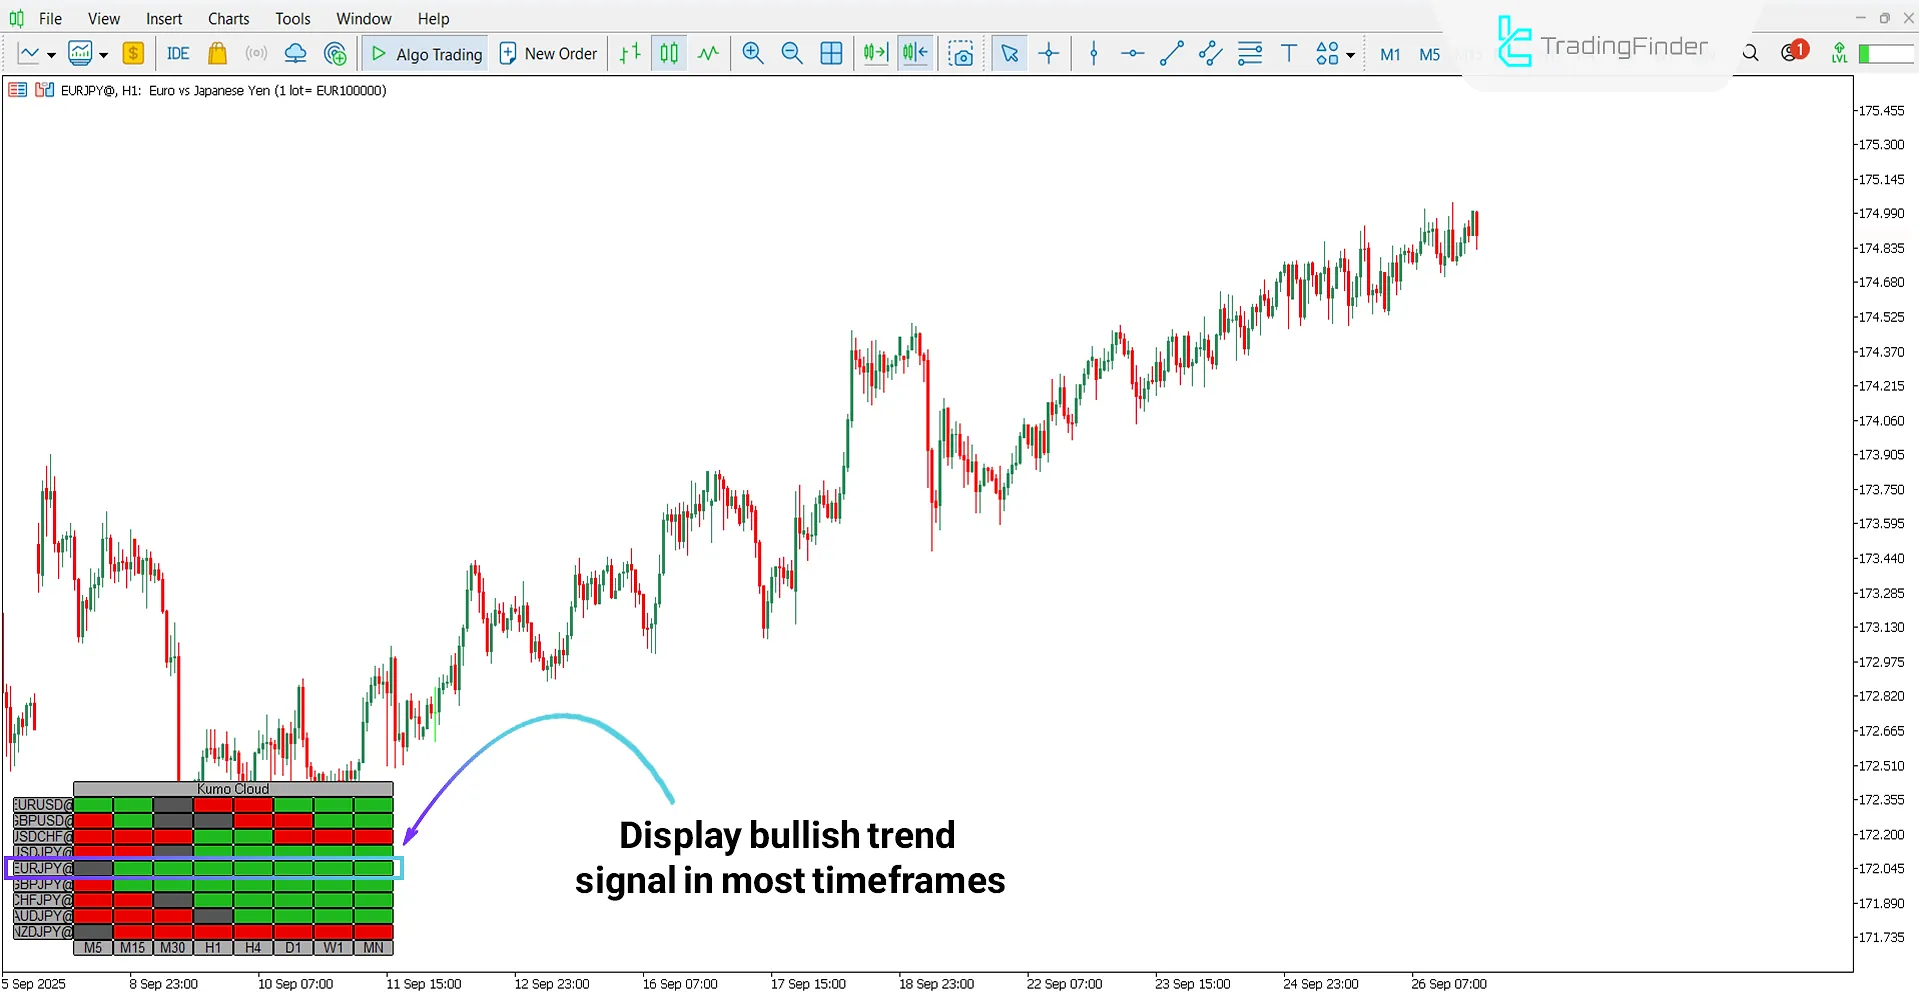
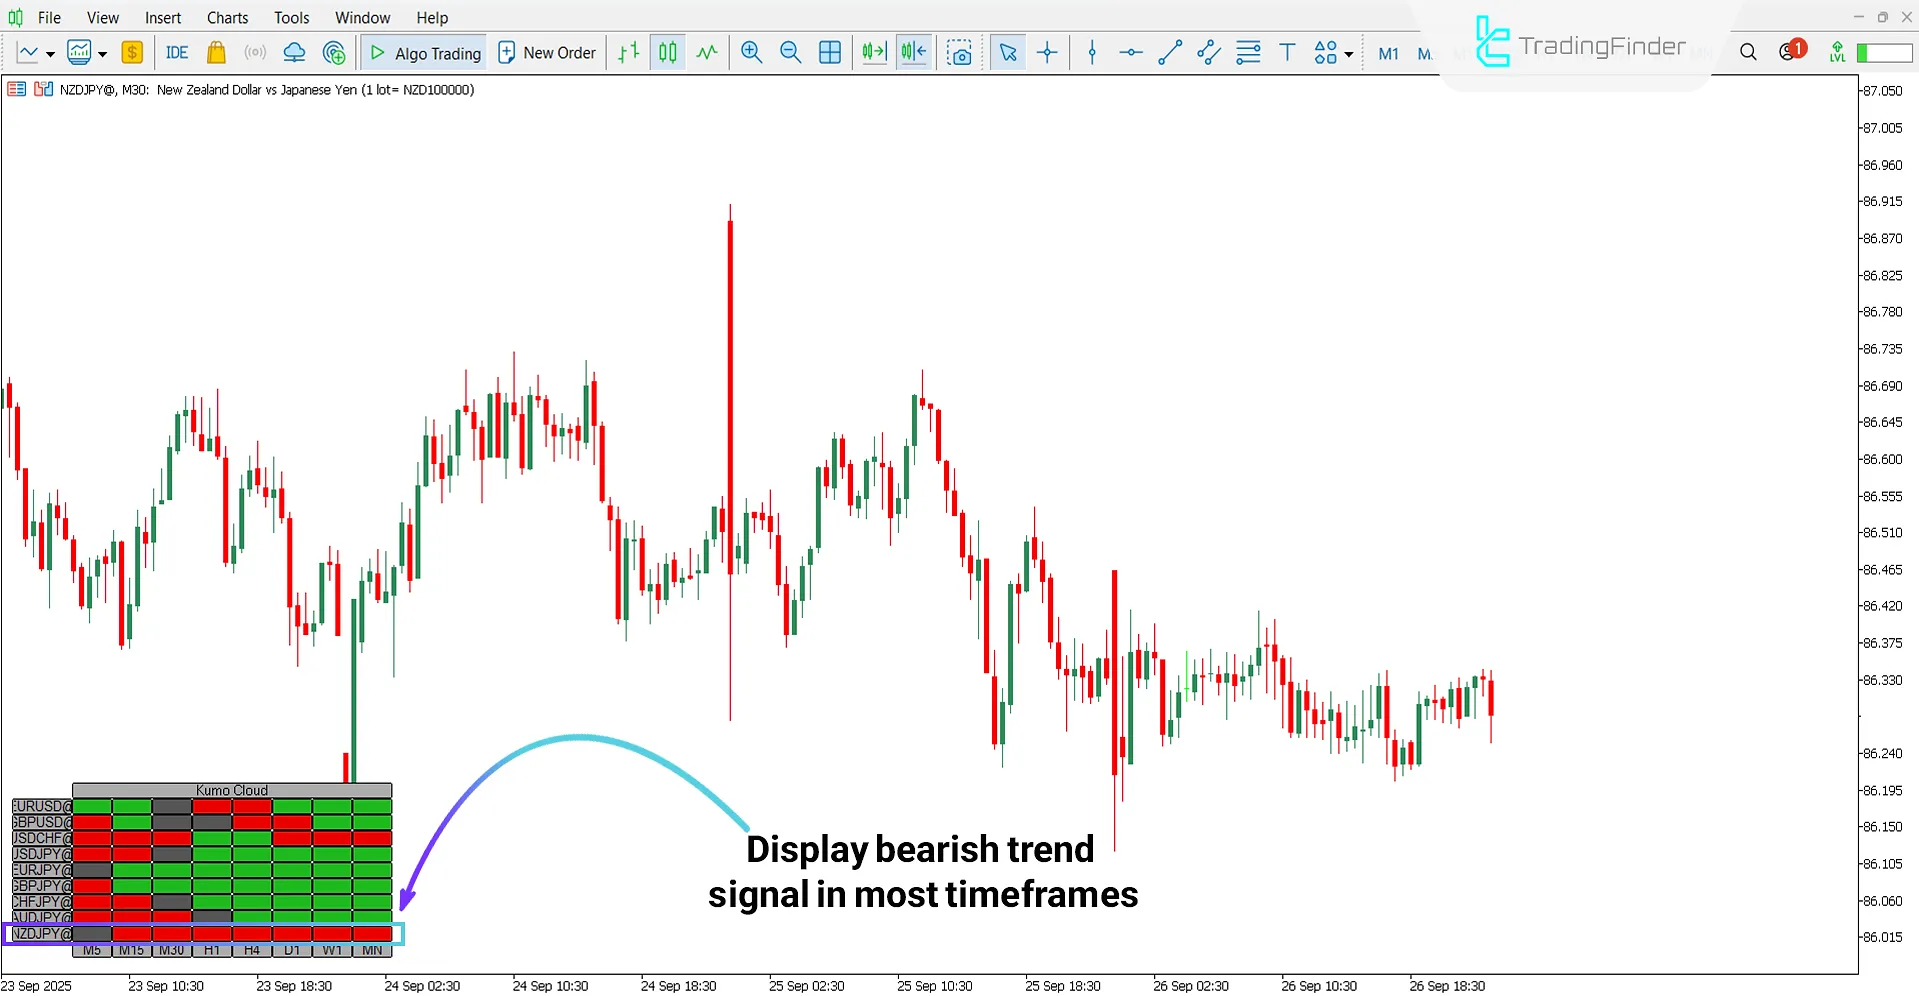
This indicator displays price movements across different timeframes in the form of a colored heatmap. In its structure, green means a dominant bullish trend, red indicates the continuation of a bearish trend, and gray represents a neutral or directionless market phase.
Specification Table of Kumo Cloud Heatmap Indicator
The table below displays the specifications of the Kumo Cloud Heatmap Indicator:
Indicator Categories: | Trading Assist MT5 Indicators Heatmap Indicators for MetaTrader 5 Ichimoku Indicators for MetaTrader 5 |
Platforms: | MetaTrader 5 Indicators |
Trading Skills: | Elementary |
Indicator Types: | Reversal MT5 Indicators |
Timeframe: | Multi-Timeframe MT5 Indicators |
Trading Style: | Swing Trading MT5 Indicators Scalper MT5 Indicators Day Trading MT5 Indicators |
Trading Instruments: | Forex MT5 Indicators Crypto MT5 Indicators Stock MT5 Indicators |
Kumo Cloud Heatmap at a Glance
Coloring in the Kumo Cloud Heatmap is determined by the price position relative to the Ichimoku Cloud area:
- Green: Bullish dominance, price stabilized above the Kumo Cloud
- Red: Bearish dominance, price moving below the Kumo Cloud
- Gray: Neutral/ranging market condition, price positioned inside the Kumo Cloud
Bullish Trend Condition
According to the 1-hour chart of Euro to Japanese Yen (EUR/JPY), the "H1" section in the heatmap is displayed in green, which indicates a bullish signal. Moreover, the alignment and green color of most other timeframes also emphasize the strength and continuation of the existing bullish trend.

Bearish Trend Condition
Based on the 30-minute chart of New Zealand Dollar to Japanese Yen (NZD/JPY), the "M30" timeframe in the heatmap is shown in red, which signals a bearish trend. In addition, the repetition of red color across most timeframes confirms the selling pressure in the market.

Settings of Kumo Cloud Heatmap Indicator
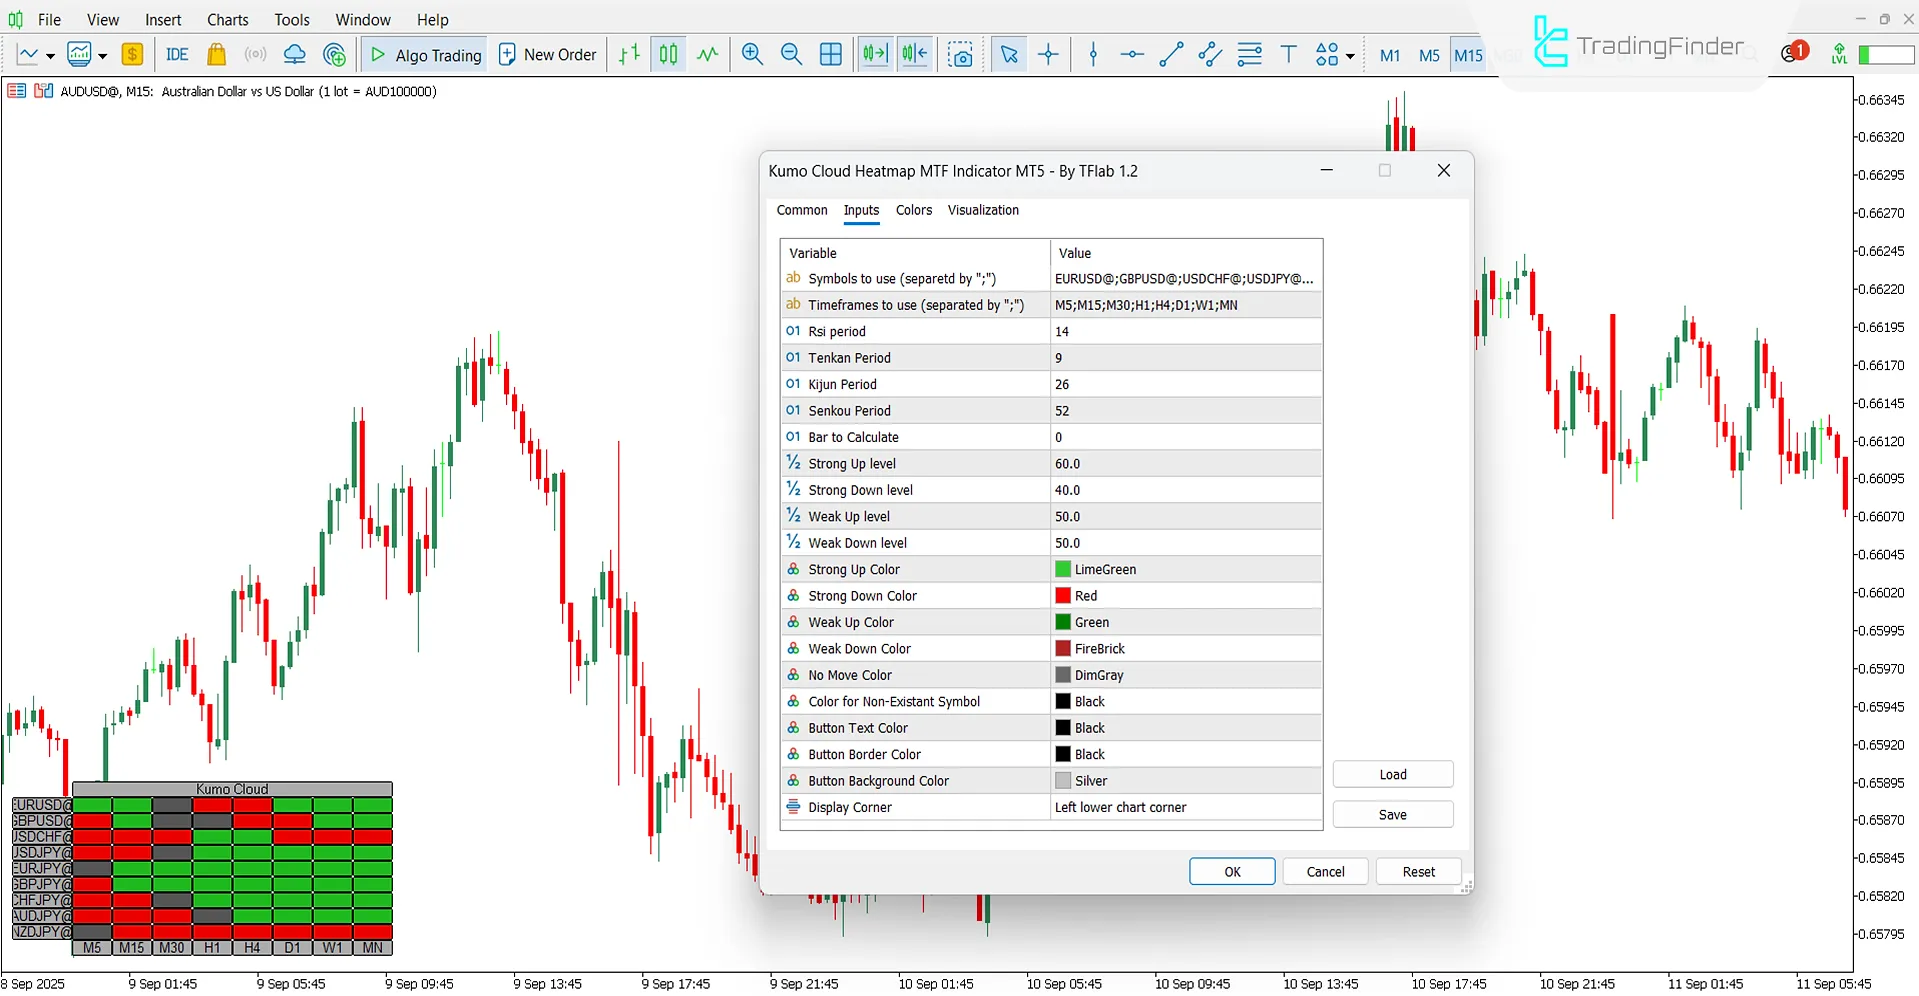
The settings of the Kumo Cloud Heatmap Indicator are as follows:

- Symbols to use: List of selected symbols to display in the heatmap
- Timeframes to use: Timeframes used for analysis
- Rsi period: Number of periods for RSI calculation
- Tenkan Period: Calculation period for Tenkan-Sen line
- Kijun Period: Calculation period for Kijun-Sen line
- Senkou Period: Calculation period for Senkou Span
- Bar to Calculate: Number of candles considered for calculation
- Strong Up level: Threshold for detecting strong bullish trend
- Strong Down level: Threshold for detecting strong bearish trend
- Weak Up level: Range for weak bullish trend
- Weak Down level: Range for weak bearish trend
- Strong Up Color: Color assigned to strong bullish trend
- Strong Down Color: Color assigned to strong bearish trend
- Weak Up Color: Color assigned to weak bullish trend
- Weak Down Color: Color assigned to weak bearish trend
- No Move Color: Color for neutral/no-movement conditions
- Color for Non-Existant Symbol: Color for non-existing symbols
- Button Text Color: Color of button texts
- Button Border Color: Color of button borders
- Button Background Color: Color of button background
- Display Corner: Position of the indicator on the chart
Note: In the "Symbols to use" setting, symbol names must match the names provided by the broker.
Conclusion
The Kumo Cloud Heatmap Indicator is one of the specialized tools in technical analysis that simplifies the Ichimoku Cloud presentation.
By using a heatmap, this indicator specifies bullish, bearish, or neutral market conditions.
Moreover, its settings section allows customization of calculation parameters and adjustment of element colors, offering traders flexibility.
Kumo Cloud Heatmap Indicator MT5 PDF
Kumo Cloud Heatmap Indicator MT5 PDF
Click to download Kumo Cloud Heatmap Indicator MT5 PDFCan different symbols be added to this indicator?
Yes, through the Symbols setting, multiple assets can be added simultaneously.
What is the difference between this indicator and the original Ichimoku?
Instead of complex lines, it displays Ichimoku output in the form of a heatmap.


