![Lab Trend Indicator MetaTrader 5 Download - [TradingFinder]](https://cdn.tradingfinder.com/image/424053/2-80-en-lab-trend-mt5-1.webp)
![Lab Trend Indicator MetaTrader 5 Download - [TradingFinder] 0](https://cdn.tradingfinder.com/image/424053/2-80-en-lab-trend-mt5-1.webp)
![Lab Trend Indicator MetaTrader 5 Download - [TradingFinder] 1](https://cdn.tradingfinder.com/image/424064/2-80-en-lab-trend-mt5-2.webp)
![Lab Trend Indicator MetaTrader 5 Download - [TradingFinder] 2](https://cdn.tradingfinder.com/image/424065/2-80-en-lab-trend-mt5-3.webp)
![Lab Trend Indicator MetaTrader 5 Download - [TradingFinder] 3](https://cdn.tradingfinder.com/image/424066/2-80-en-lab-trend-mt5-4.webp)
The Lab Trend Indicator is a trend-based technical analysis tool that utilizes intelligent algorithms to identify the starting points of bullish and bearish movements indicated by colored signals on the chart.
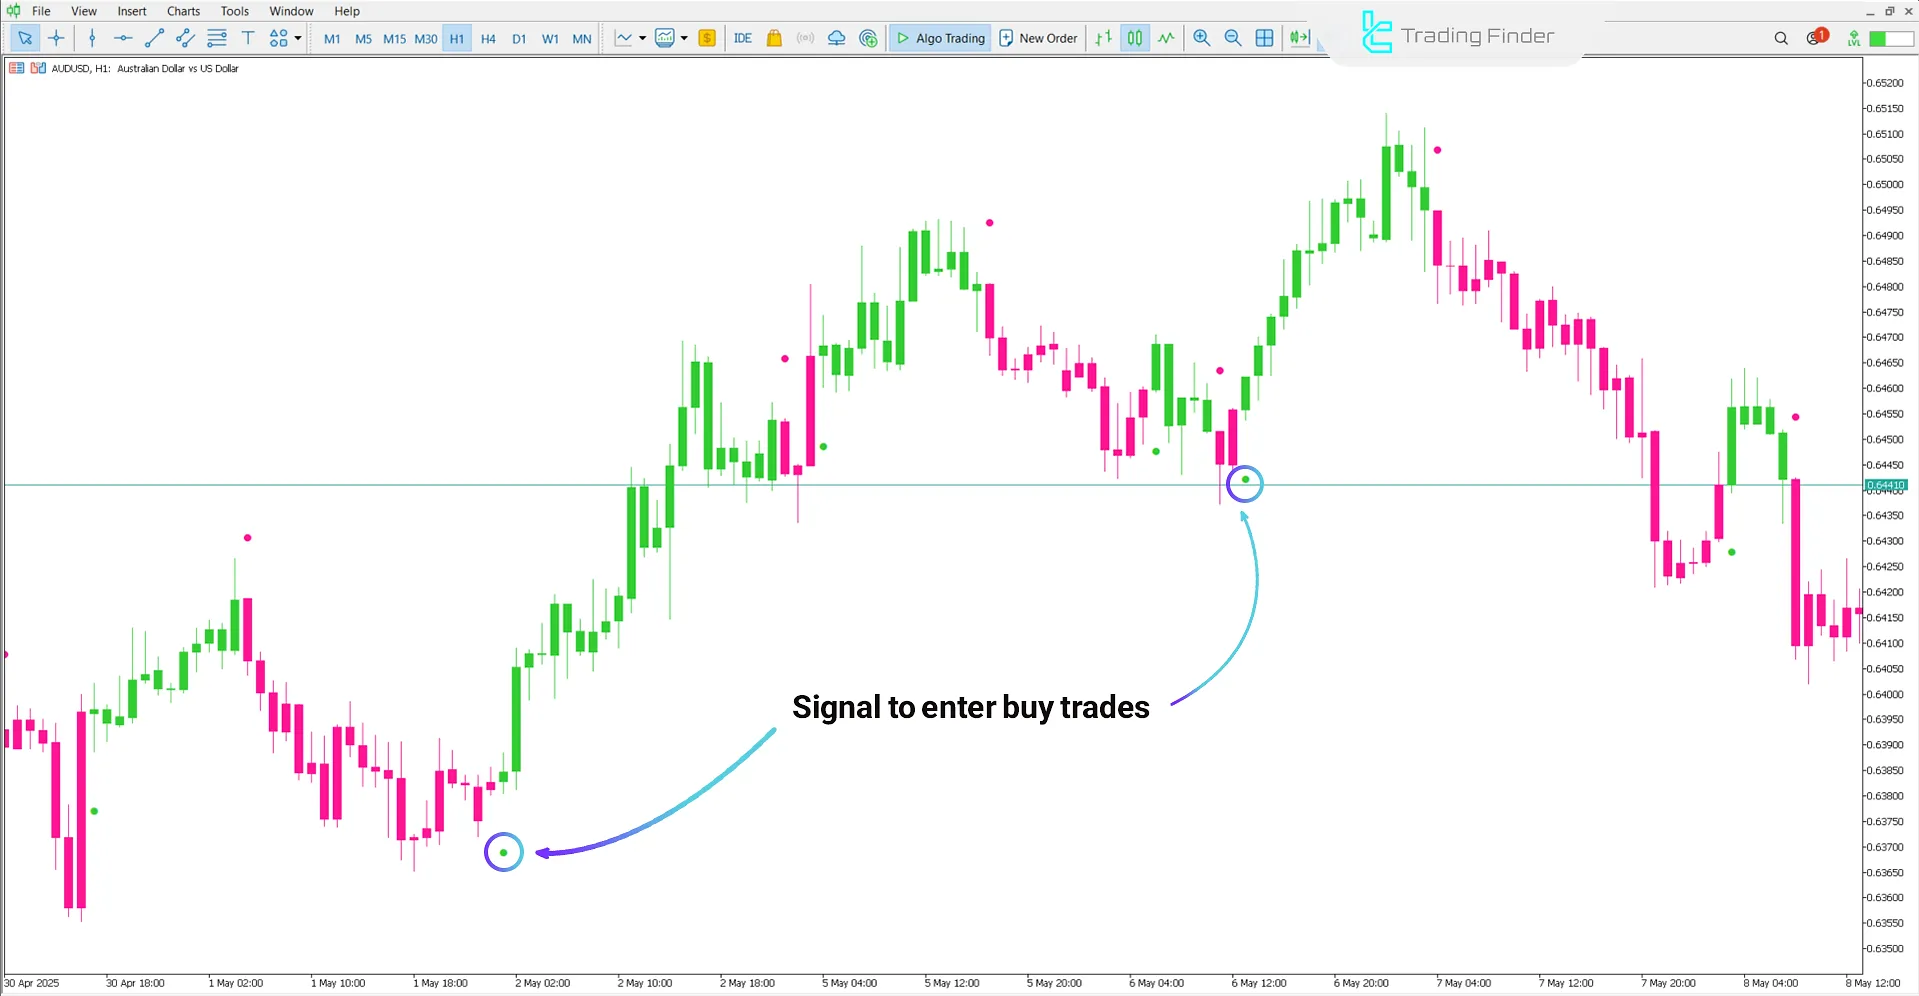
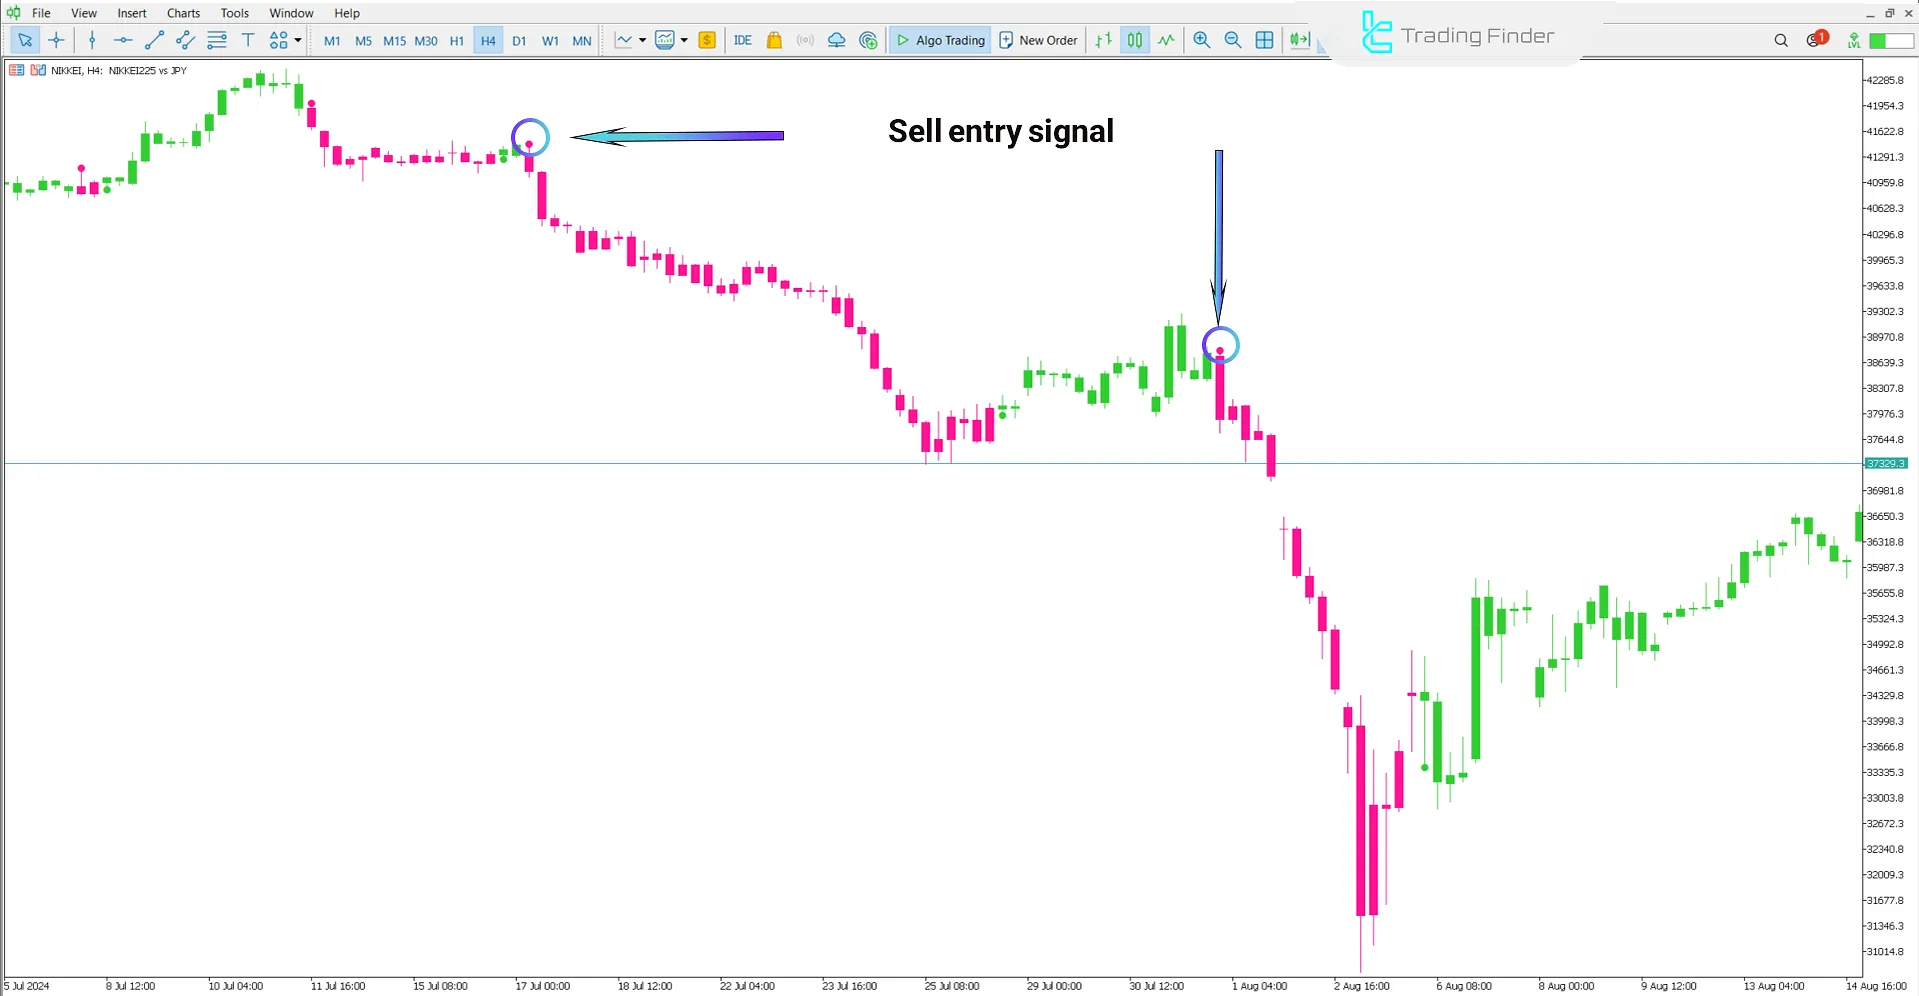
A green dot indicates the beginning of a bullish trend and signals a Buy entry, while a pink dot signals the start of a bearish trend and warns of a Sell opportunity.
Lab Trend Indicator Table
The table below provides an overview of the Lab Trend Indicator performance features on the MetaTrader 5 platform:
Indicator Categories: | Signal & Forecast MT5 Indicators Currency Strength MT5 Indicators Trading Assist MT5 Indicators |
Platforms: | MetaTrader 5 Indicators |
Trading Skills: | Elementary |
Indicator Types: | Reversal MT5 Indicators |
Timeframe: | Multi-Timeframe MT5 Indicators |
Trading Style: | Intraday MT5 Indicators |
Trading Instruments: | Forex MT5 Indicators Crypto MT5 Indicators Stock MT5 Indicators Commodity MT5 Indicators Indices MT5 Indicators Share Stock MT5 Indicators |
Overview of the Lab Trend Indicator
The Lab Trend Indicator is a trend-based trading tool that precisely analyzes market behavior to detect shifts in the balance of buying and selling power.
In addition to point-based signals, the indicator also changes candlestick colors to help identify the trend. In this model:
- Bullish candles appear in green;
- Bearish candles appear in pink.
Indicator in a Bullish Trend
In the 1-hour chart of the AUD/USD currency pair, the indicator displays a green dot, indicating the start of an uptrend.
This dot acts as a Buy signal, and simultaneously, the candlesticks change to green to visually confirm the price direction.

Indicator in a Bearish Trend
At the end of a bullish trend in the Nikkei index (NIKKEI), the Lab Trend Indicator issues a pink dot, indicating the beginning of a bearish trend.
At the same time, it changes the candle color to pink, highlighting an area for sale entry.

Lab Trend Indicator Settings
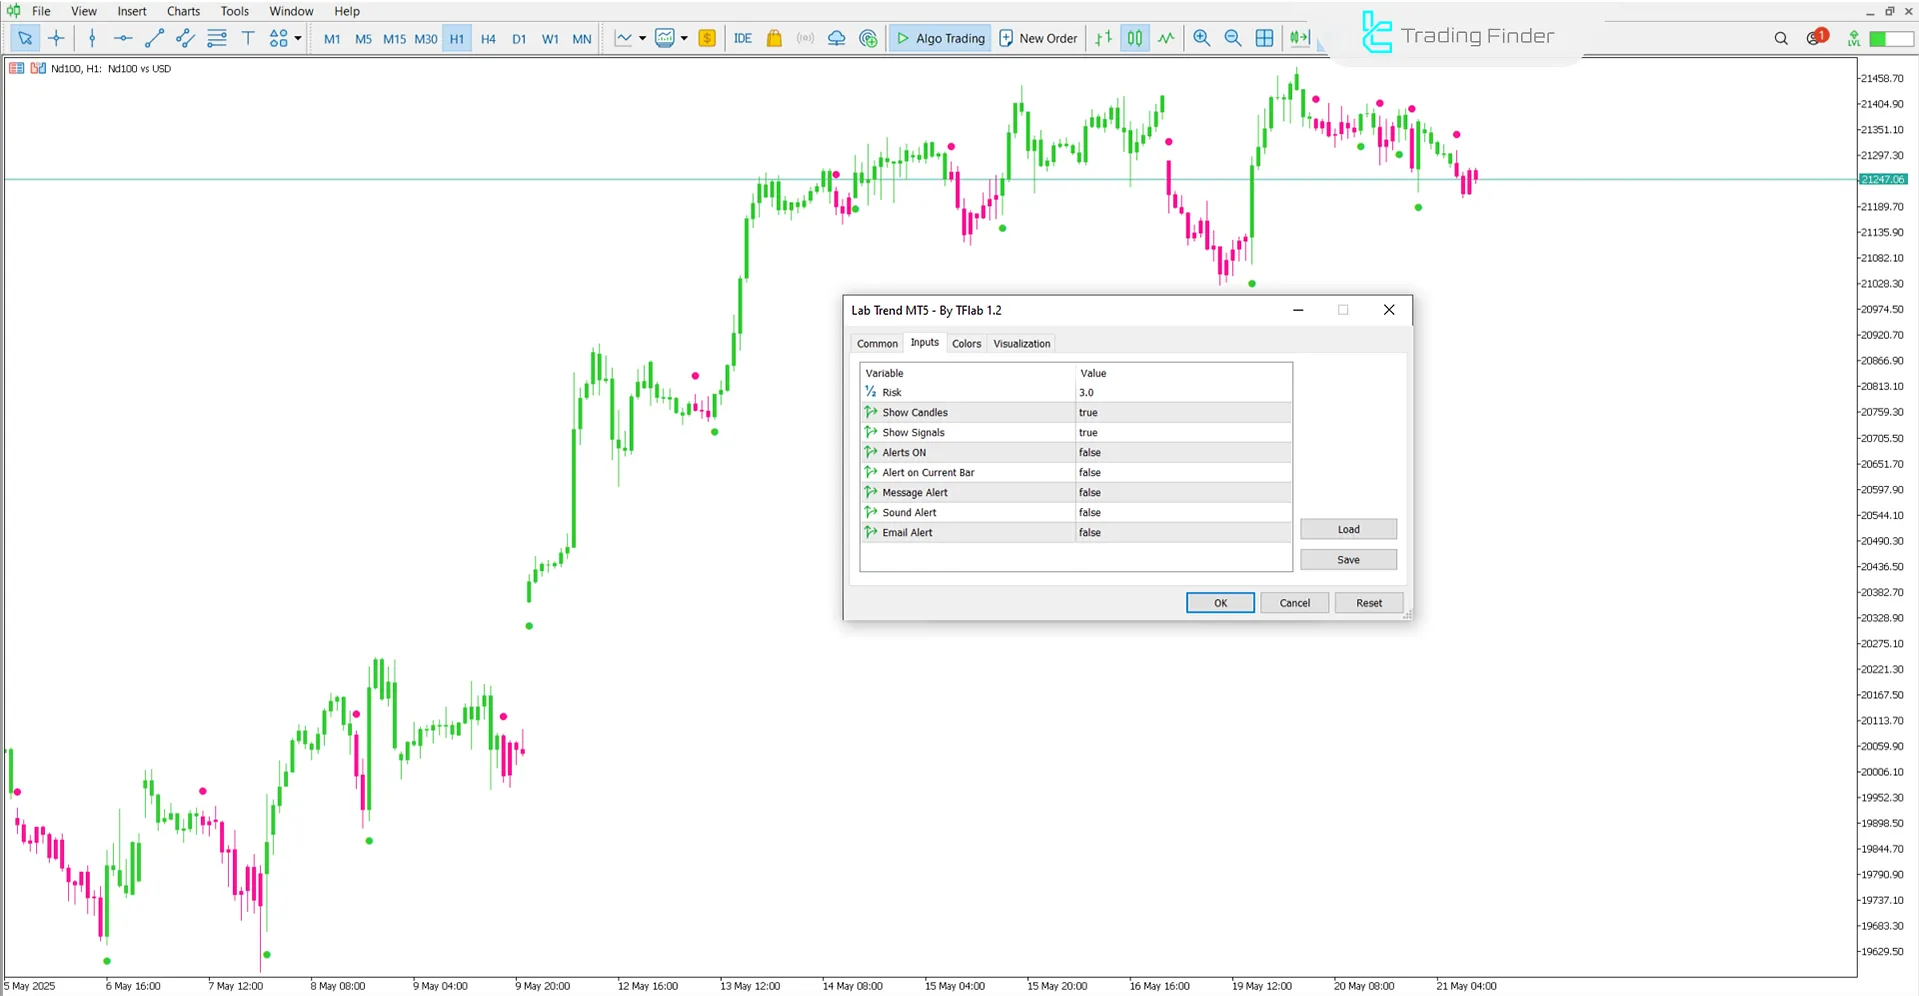
The settings panel of the Lab Trend Indicator is shown in the image below:

- Risk: Risk level
- Show Candles: Display candlesticks
- Show Signals: Display signals
- Alerts On: Enable global alerts
- Alerts On Current: Alerts based on the current candle
- Message Alerts: Show message alert
- Sound Alerts: Enable sound notification
- Email Alerts: Enable email notification
Conclusion
The Lab Trend trading Tools is a trend recognition tool used in financial markets that highlights entry and exit positions using colored signal dots on the chart.
In addition to providing highly accurate confirmation of price direction, the indicator also plays a vital role in identifying key trend reversal zones.
In which markets does the Lab Trend Indicator perform best?
This indicator works best in trending markets such as Forex pairs or high-volume cryptocurrencies.
What is the role of candle colors in the Lab Trend Indicator?
Beyond signal dots, the indicator also changes candle colors, Green candles for bullish movement, Pink candles for bearish movement, This helps visualize the price direction more clearly.


