![Laguerre Volume Index Indicator for MT5 Download - Free - [TFlab]](https://cdn.tradingfinder.com/image/217734/4-51-en-laguerre-volume-index-mt5-4-1.webp)
![Laguerre Volume Index Indicator for MT5 Download - Free - [TFlab] 0](https://cdn.tradingfinder.com/image/217734/4-51-en-laguerre-volume-index-mt5-4-1.webp)
![Laguerre Volume Index Indicator for MT5 Download - Free - [TFlab] 1](https://cdn.tradingfinder.com/image/217701/4-51-en-laguerre-volume-index-mt5-4-2.webp)
![Laguerre Volume Index Indicator for MT5 Download - Free - [TFlab] 2](https://cdn.tradingfinder.com/image/217703/4-51-en-laguerre-volume-index-mt5-4-3.webp)
![Laguerre Volume Index Indicator for MT5 Download - Free - [TFlab] 3](https://cdn.tradingfinder.com/image/217702/4-51-en-laguerre-volume-index-mt5-4-4.webp)
On July 22, 2025, in version 2, alert/notification and signal functionality was added to this indicator
The Laguerre Volume Index Indicator is an analytical tool among MetaTrader 5 indicators designed with the Laguerre filter based on trade volume analysis.This indicator is used to identify potential overbought and oversold zones in the market.
Specifications Table of Laguerre Volume Index Indicator
The following table summarizes the features of this indicator.
Indicator Categories: | Oscillators MT5 Indicators Volatility MT5 Indicators Trading Assist MT5 Indicators |
Platforms: | MetaTrader 5 Indicators |
Trading Skills: | Intermediate |
Indicator Types: | Reversal MT5 Indicators |
Timeframe: | Multi-Timeframe MT5 Indicators |
Trading Style: | Intraday MT5 Indicators |
Trading Instruments: | Forex MT5 Indicators Crypto MT5 Indicators Stock MT5 Indicators |
Indicator at a Glance
The Laguerre Volume Index Oscillator fluctuates between 0 and 1, displaying three significant horizontal levels at 0.25, 0.5, and 0.75.
- A value above 0.5 indicates buyer dominance, while values below 0.5 signify seller control
- A breakout above the 0.25 level may signal a buy entry, whereas a breakdown below the 0.75 level is considered a sell signal
Indicator in an Uptrend
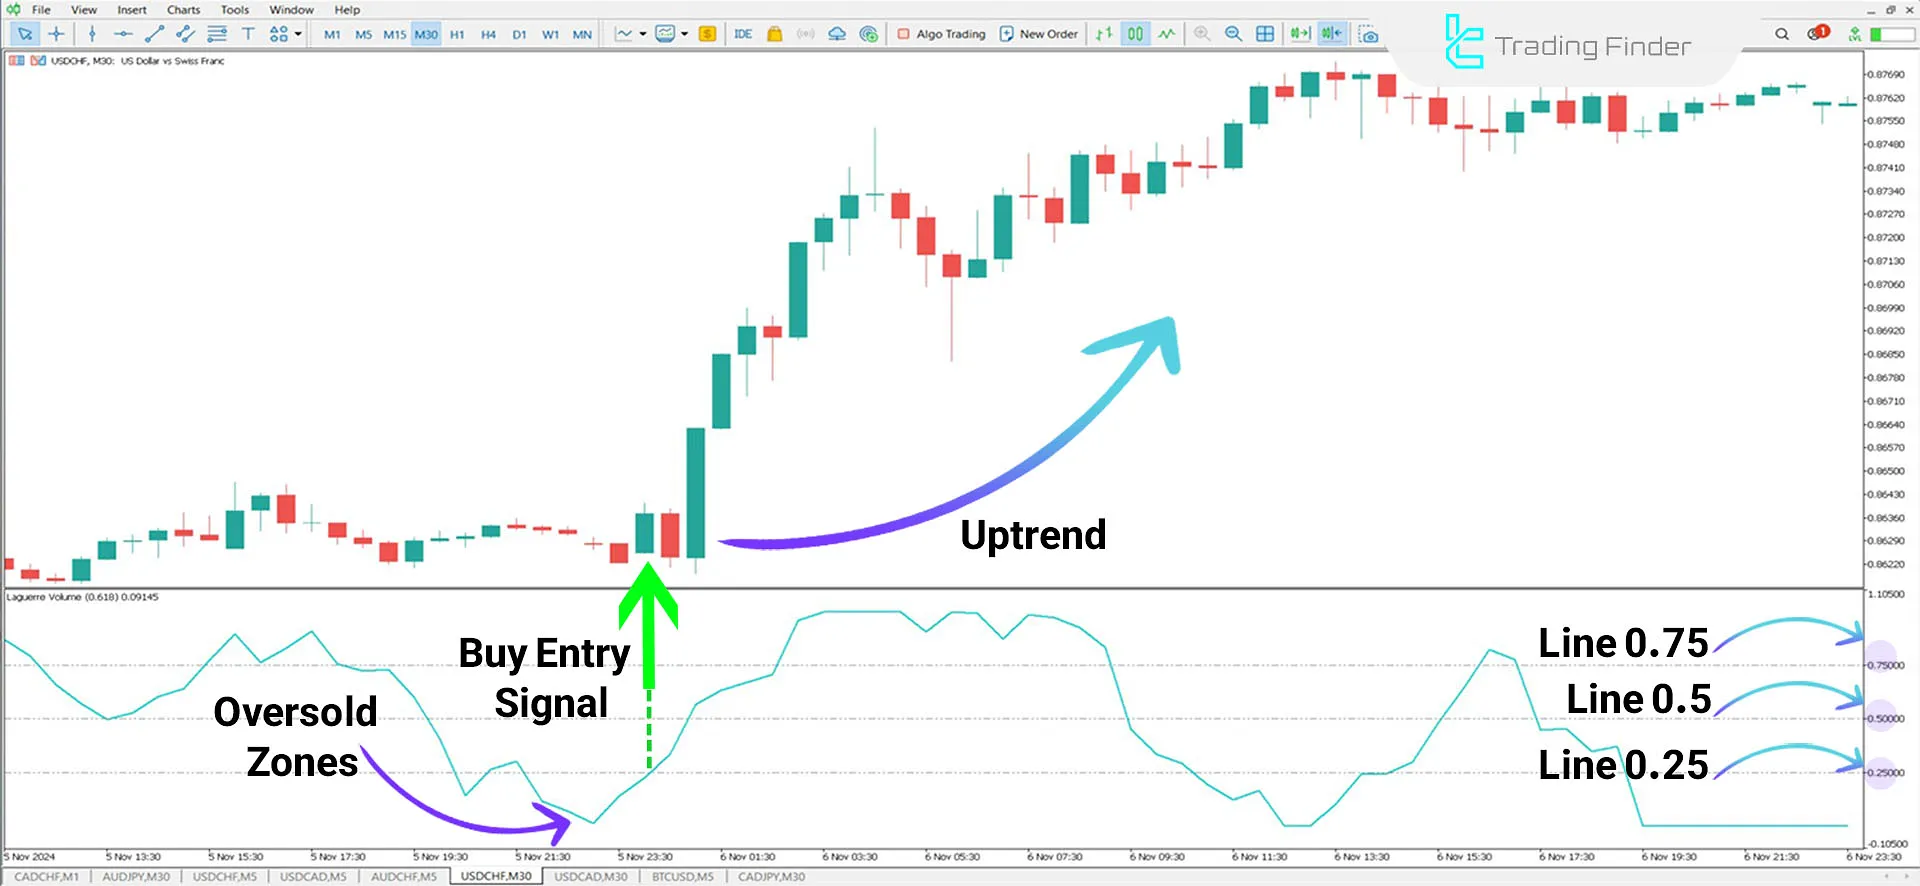
In an uptrend, the price approaches oversold zones, and as the blue line crosses the 0.25 level upward, the trend shifts to bullish.
Traders look for confirmations such as Marubozu candlesticks to ensure trend continuation.

Indicator in a Downtrend
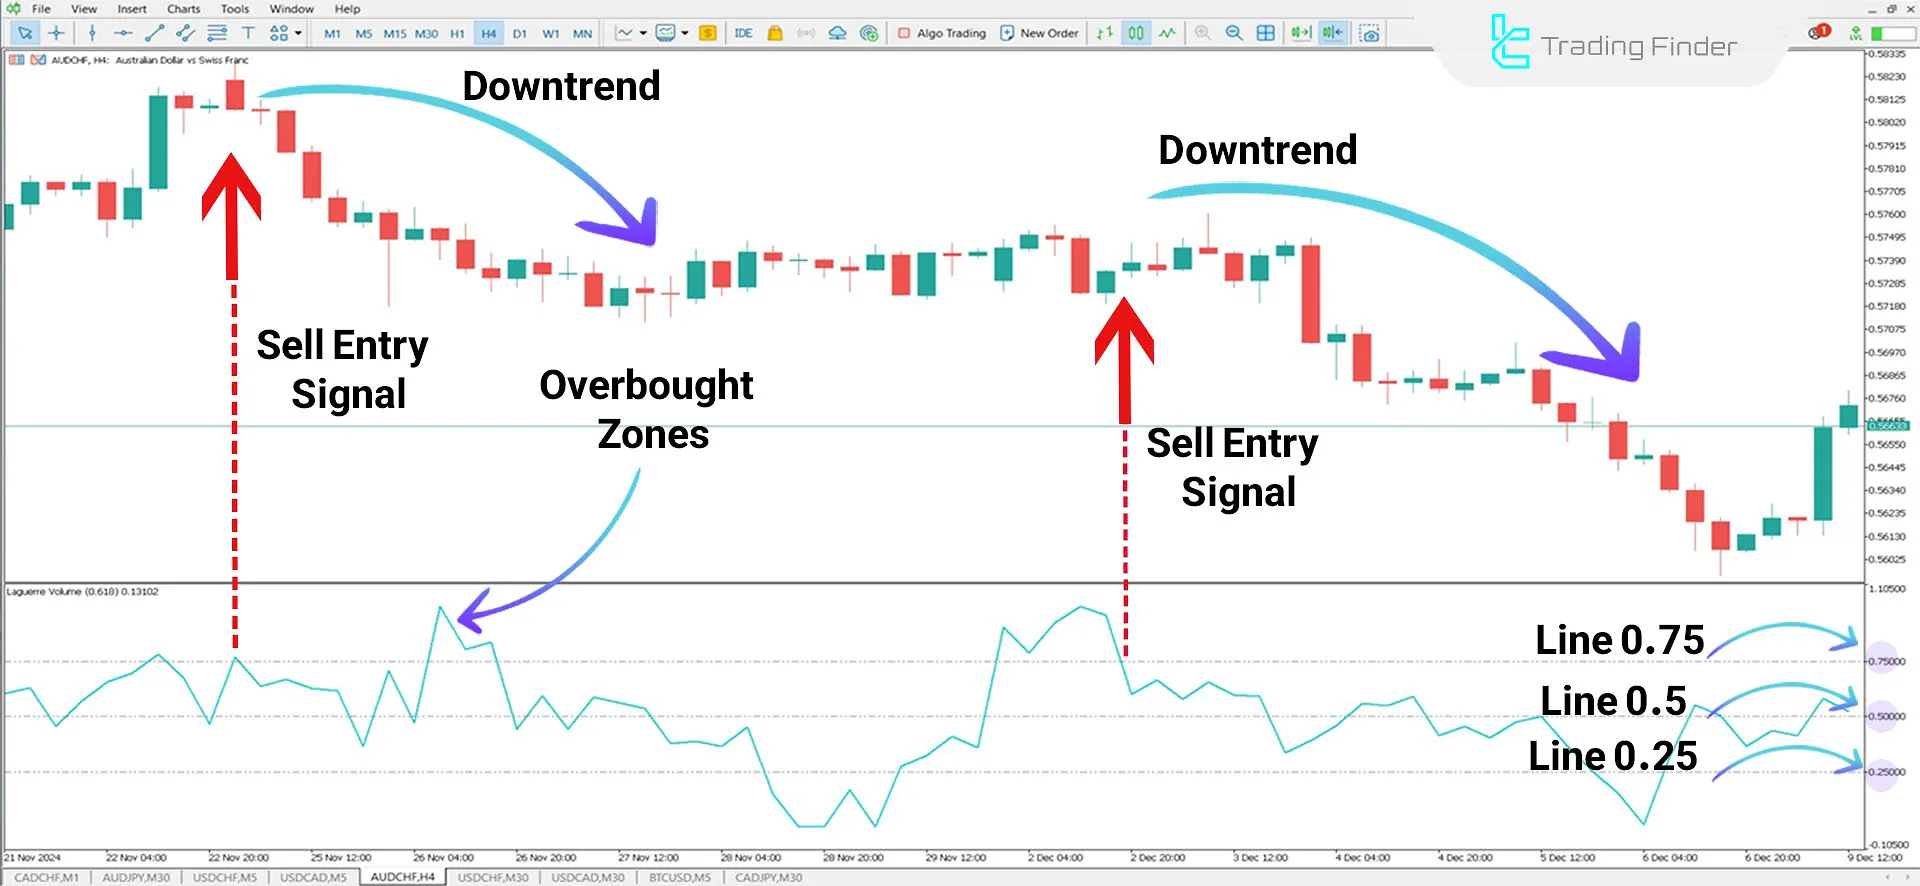
When the blue oscillator line crosses below the 0.75 level, the price trend turns bearish. Traders initiate sell trades and exit as the indicator reaches oversold zones.

Indicator Settings
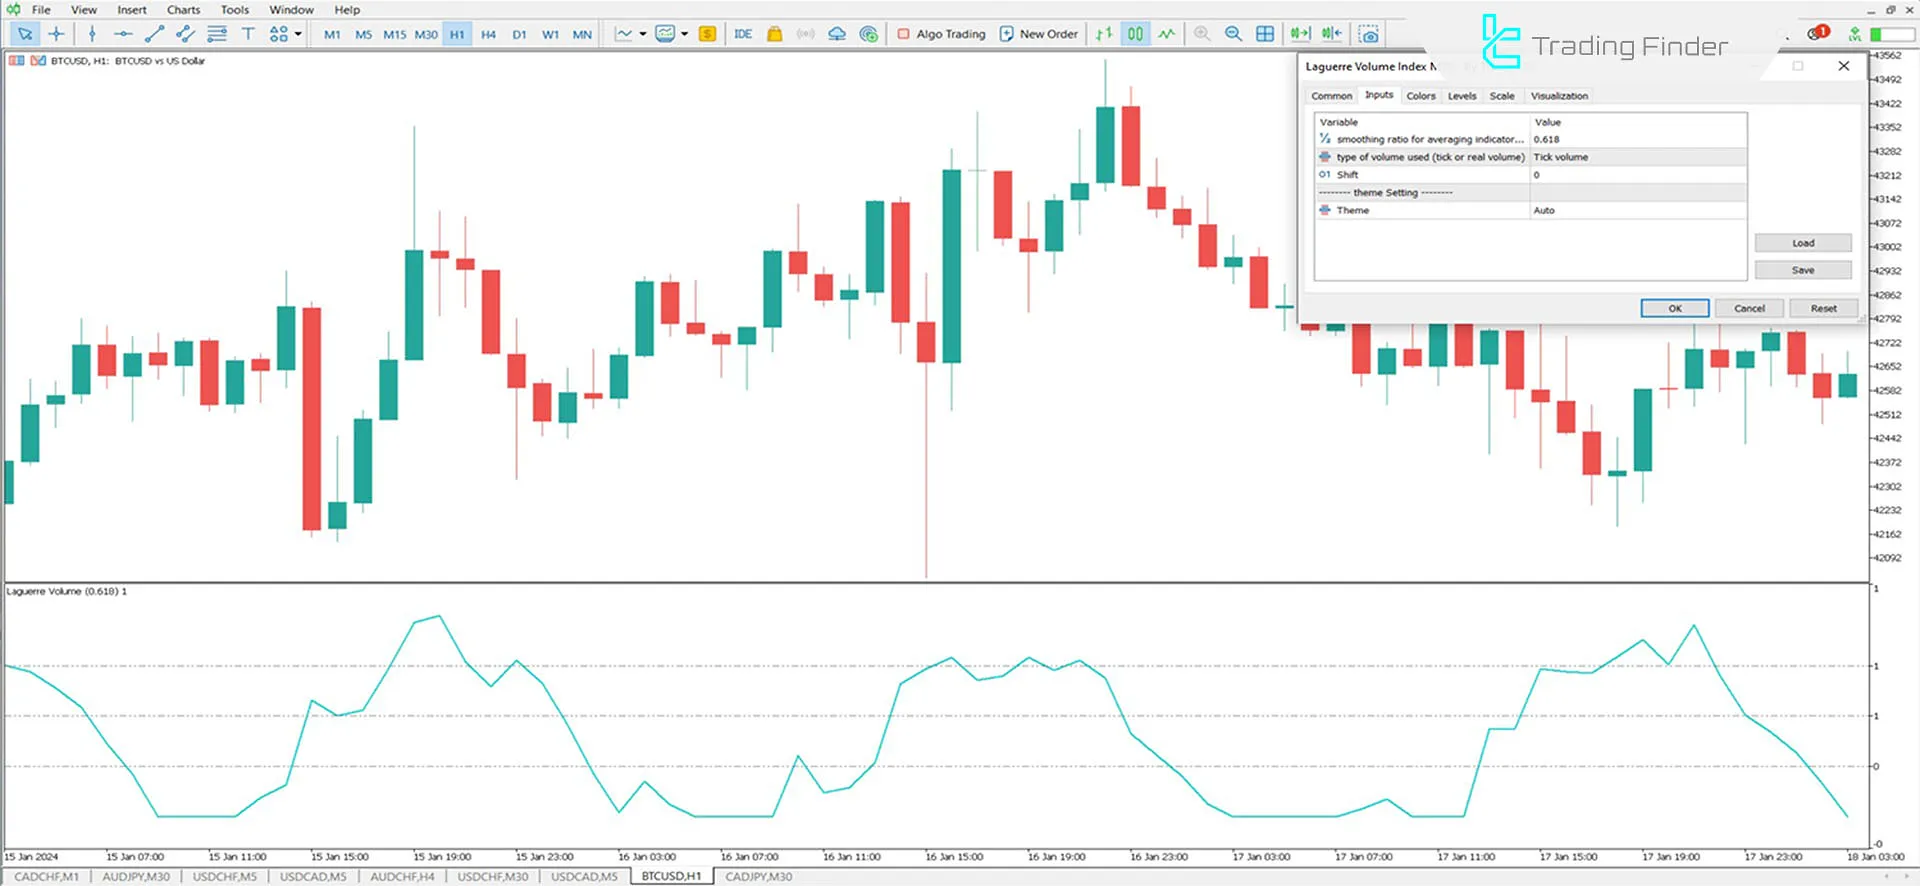
The image below provides a comprehensive overview of the indicator’s functionality and details:

- Gamma: Adjusts the sensitivity of the indicator to price changes
- Shift: Temporal adjustment of the indicator relative to price data
- Theme: Selection of the indicator’s background theme
Conclusion
The Laguerre Volume Index Oscillator (Laguerre Volume Index) is one of the advanced trading assist Indicators in MetaTrader 5, designed to identify overbought and oversold zones.
This indicator analyzes trade volume and strength, predicts potential trend changes, and determines suitable entry and exit points for trades.
Laguerre Volume Index MT5 PDF
Laguerre Volume Index MT5 PDF
Click to download Laguerre Volume Index MT5 PDFHow do traders use the signals from this indicator?
The upward crossover of the blue line above the 0.25 level is a buy signal, while the downward crossover below the 0.75 level is a sell signal.
Is the Laguerre Volume Index Indicator applicable in all markets?
Yes, this indicator can be used across all markets, including forex, stocks, commodities, and cryptocurrencies.


