![Leonardo Harmonic Pattern Indicator for MetaTrader 5 Download - [TradingFinder]](https://cdn.tradingfinder.com/image/335657/4-81-en-leonardo-harmonic-pattern-mt5-1.webp)
![Leonardo Harmonic Pattern Indicator for MetaTrader 5 Download - [TradingFinder] 0](https://cdn.tradingfinder.com/image/335657/4-81-en-leonardo-harmonic-pattern-mt5-1.webp)
![Leonardo Harmonic Pattern Indicator for MetaTrader 5 Download - [TradingFinder] 1](https://cdn.tradingfinder.com/image/335655/4-81-en-leonardo-harmonic-pattern-mt5-2png.webp)
![Leonardo Harmonic Pattern Indicator for MetaTrader 5 Download - [TradingFinder] 2](https://cdn.tradingfinder.com/image/335656/4-81-en-leonardo-harmonic-pattern-mt5-3.webp)
![Leonardo Harmonic Pattern Indicator for MetaTrader 5 Download - [TradingFinder] 3](https://cdn.tradingfinder.com/image/335658/4-81-en-leonardo-harmonic-pattern-mt5-4.webp)
On July 1, 2025, in version 2, alert/notification and signal functionality was added to this indicator
The Leonardo Harmonic Pattern Indicator is a specialized tool for analyzing harmonic structures. It is designed to detect potential price reversal zones based on Fibonacci ratios. Structurally, it resembles the Bat Pattern but shows notable differences in numerical levels and ratios, making it unique.
The Leonardo pattern comprises five price legs labeled XA, AB, BC, CD, and AD. These waves can help determine potential entry and exit zones if identified correctly in Technical analysis . Key ratios like 50%, 88.6%, and 261.8% play a critical role in the formation.
Leonardo Harmonic Pattern Indicator Table
The specifications of the Leonardo Harmonic Pattern Indicator are summarized in the table below:
Indicator Categories: | Support & Resistance MT5 Indicators Chart & Classic MT5 Indicators Harmonic MT5 Indicators |
Platforms: | MetaTrader 5 Indicators |
Trading Skills: | Intermediate |
Indicator Types: | Reversal MT5 Indicators |
Timeframe: | Multi-Timeframe MT5 Indicators |
Trading Style: | Intraday MT5 Indicators |
Trading Instruments: | Forex MT5 Indicators Crypto MT5 Indicators Stock MT5 Indicators Commodity MT5 Indicators Indices MT5 Indicators Forward MT5 Indicators Share Stock MT5 Indicators |
Indicator Overview
In most harmonic indicators, Fibonacci levels are generally similar. However, the Leonardo structure uses the following standard leg setup:
- XA: The initial price move, which can be any fluctuation and does not require special criteria
- AB: A corrective leg moving against XA, typically retracing about 50% of XA
- BC: Moves against AB and should be either 38.2% or 88.6% of AB
- CD: The final leg in the opposite direction of BC
- AD: The total distance from A to D must be 78.6% of XA for the pattern to be valid
The CD leg is calculated under two scenarios:
- If BC = 38.2% of AB → CD extends to 112.8% of BC
- If BC = 88.6% of AB → CD typically reaches 261.8% of BC
Uptrend Conditions
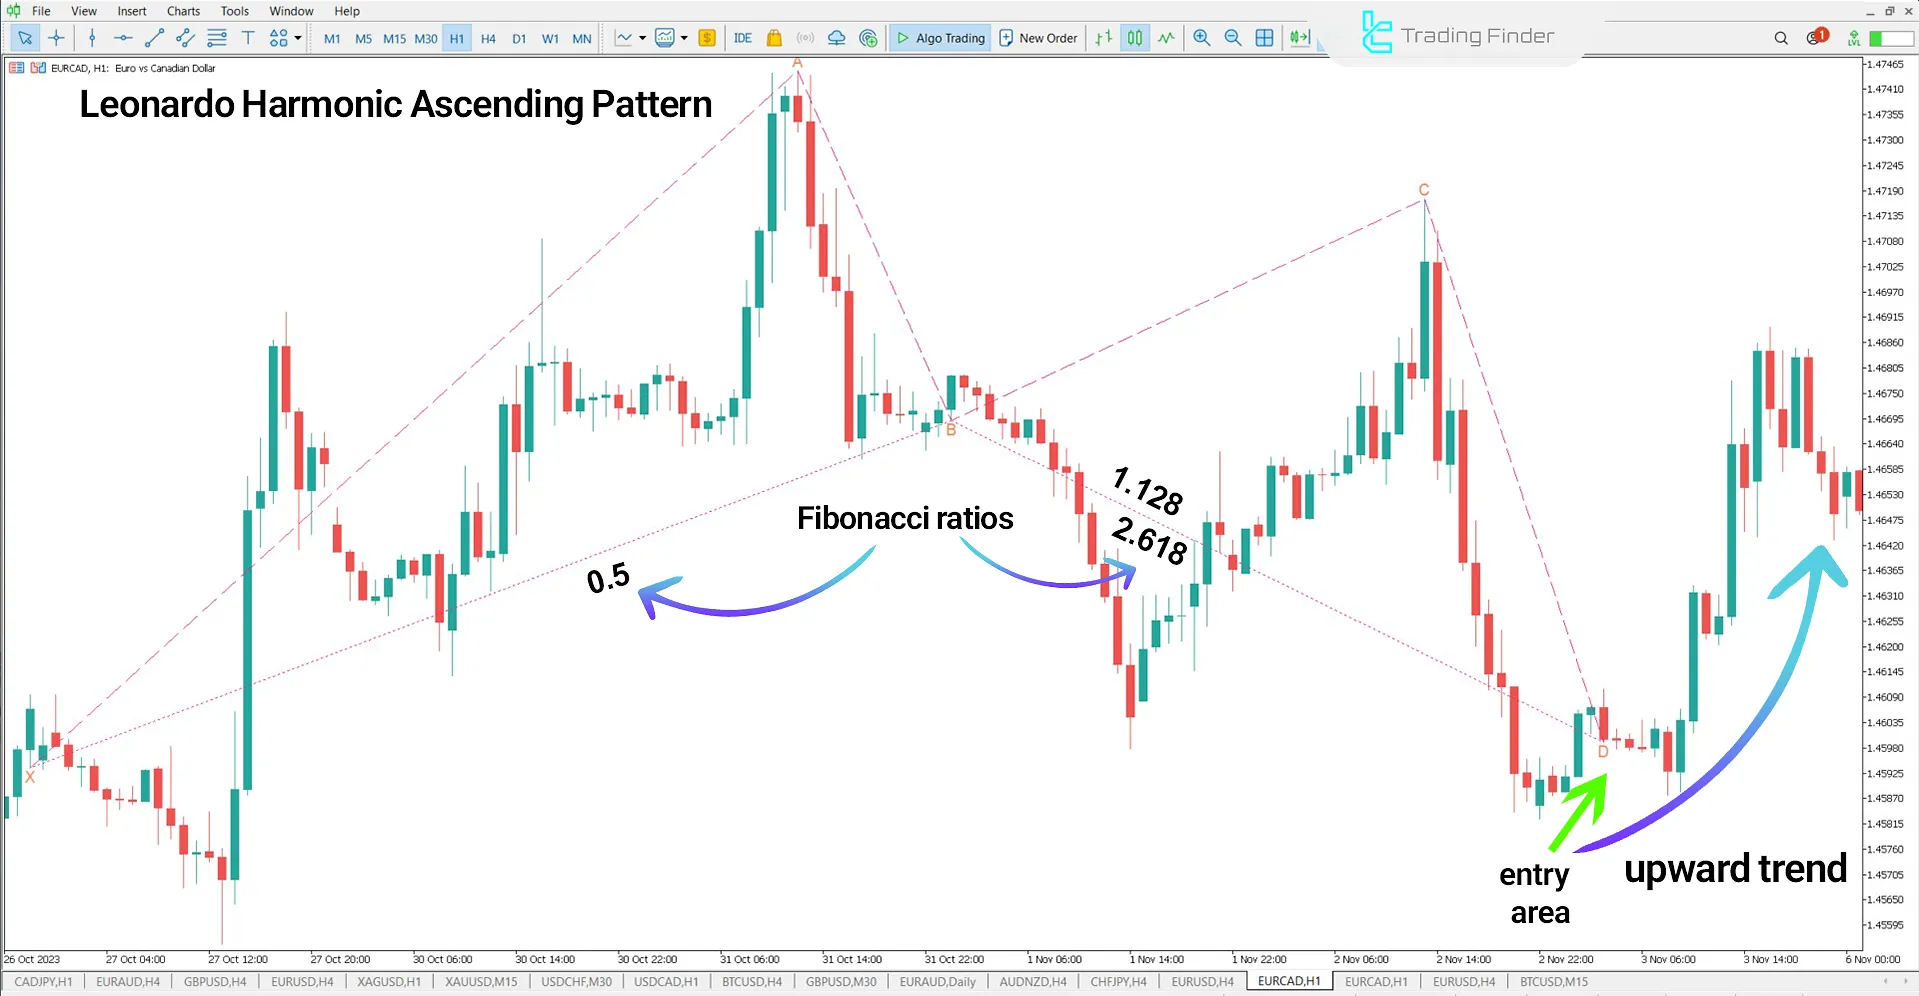
In the EUR/CAD currency pair chart, point D is marked as a significant zone within the Leonardo pattern after the complete formation of XA, AB, BC, and CD.
Positioning D within a sensitive Fibonacci area increases the probability of a reversal from bearish to bullish.

Downtrend Conditions
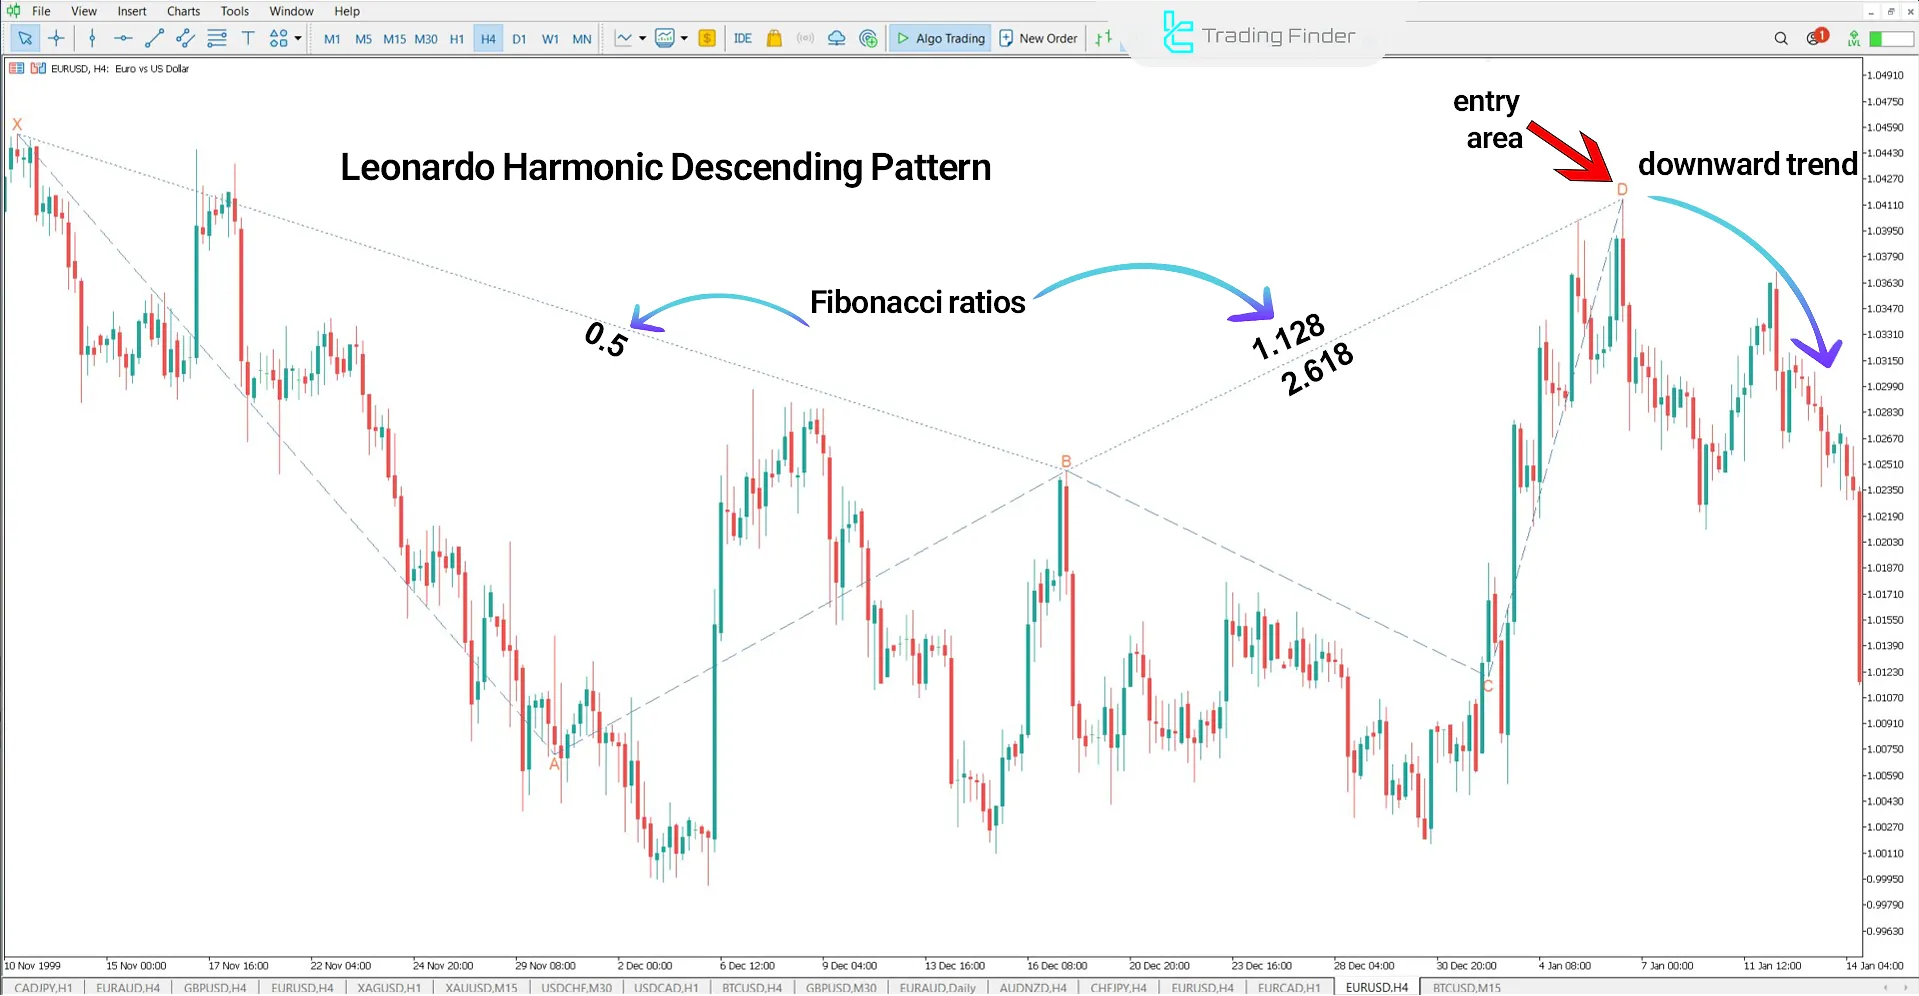
The Leonardo pattern is accurately identified on the EUR/USD chart. After the formation from XA to CD, point D is positioned in a key area considered a reversal zone.
The Fibonacci relationshipsbetween AB, BC, and CD confirm the structure's validity and suggest a higher probability for a bearish move from D.

Leonardo Harmonic Pattern Indicator Settings
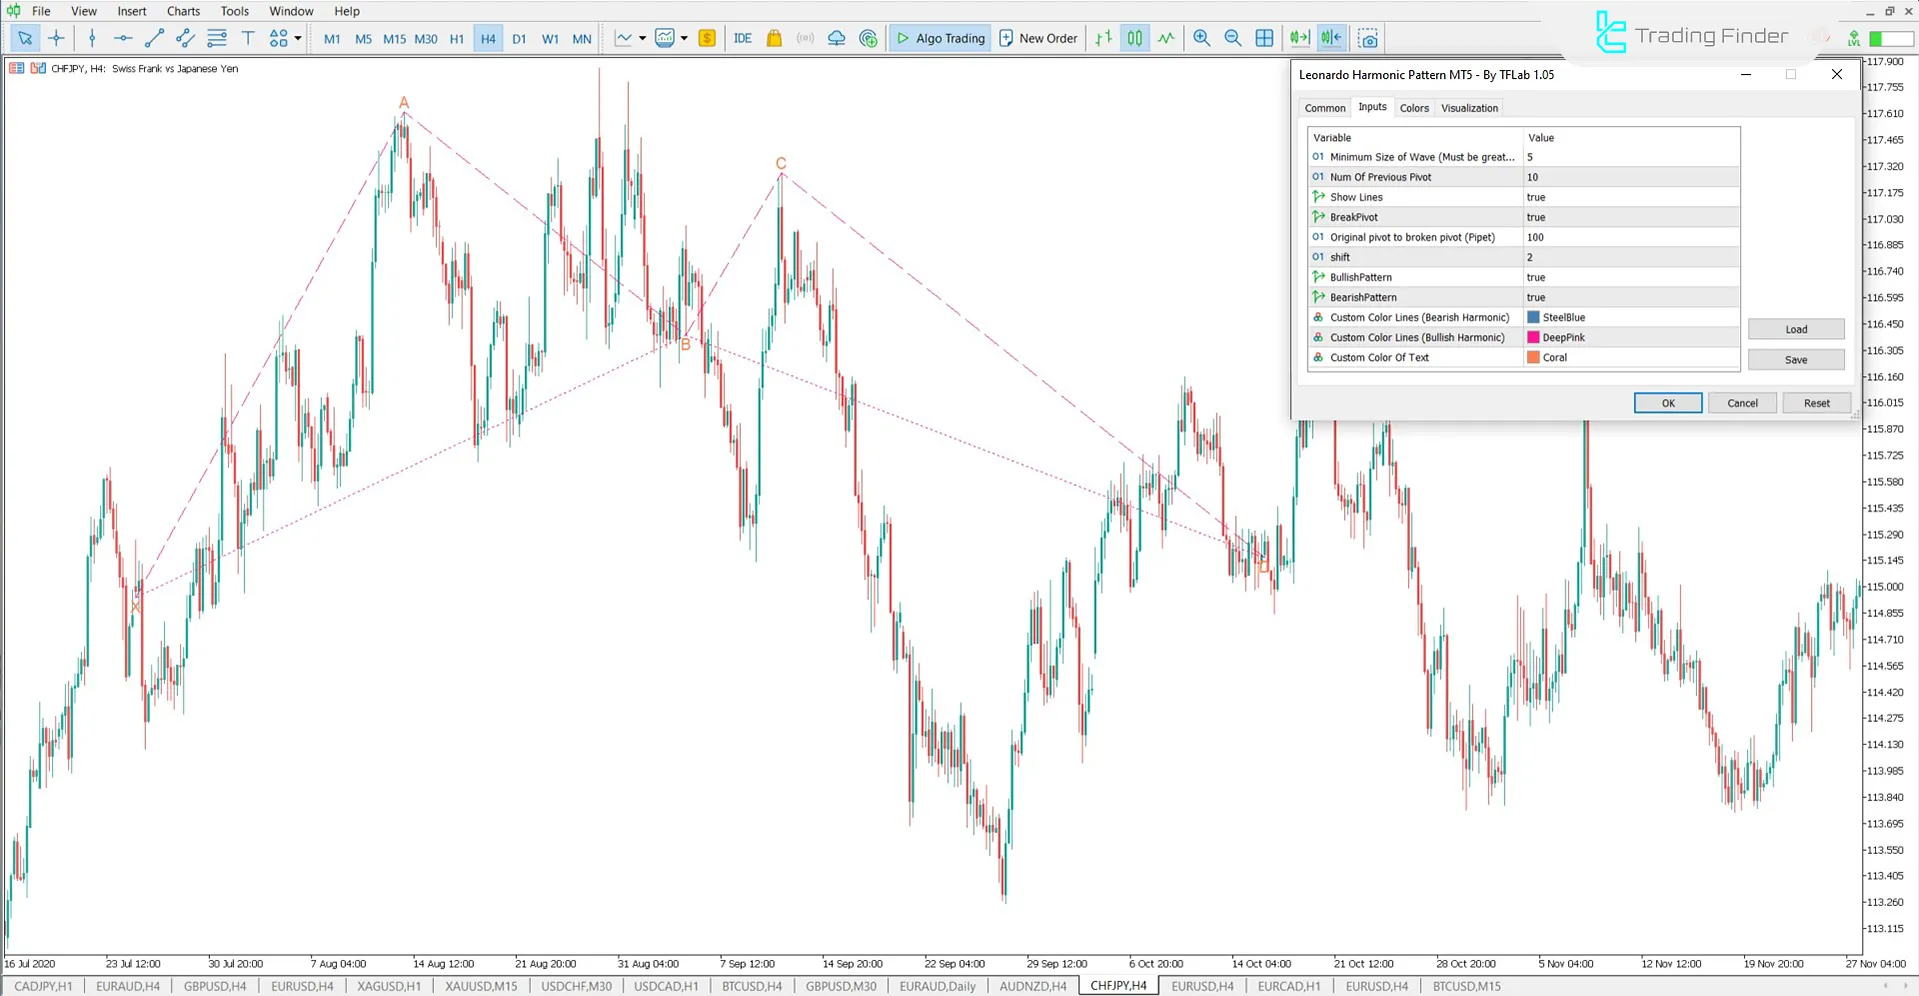
The image below illustrates the configurable parameters of the Leonardo Harmonic Pattern Indicator:

- Minimum Length Of Wave (candle): Minimum number of candles for wave detection
- Num Of Previous Candle: Number of past candles used in calculations
- Show Lines: Show or hide pattern lines
- BreakPivot: Check for pivot breaks
- Original pivot to broken pivot (Pipet): Distance in pipets between original and broken pivot
- Shift: Data offset in the chart
- BullishPattern: Enable bullish pattern detection
- BearishPattern: Enable bearish pattern detection
- Style Of Line: Line style selector
- Width Of Line: Thickness of displayed lines
- Custom Color Lines (Bearish Harmonic): Color for bearish pattern lines
- Custom Color Lines (Bullish Harmonic): Color for bullish pattern lines
- Custom Color Of Text: Text color setting
Conclusion
The Leonardo Harmonic Pattern Indicator, built on an accurate Fibonacci-based structure, allows for analyzing potential reversal formations across all timeframes.
While similar to the Bat Pattern, its specific retracement levels and high precision make it a distinctive tool for identifying market-sensitive zones in MetaTrader 5.
Leonardo Harmonic Pattern MT5 PDF
Leonardo Harmonic Pattern MT5 PDF
Click to download Leonardo Harmonic Pattern MT5 PDFWhat's the main difference between Leonardo's Harmonic and other harmonic indicators?
The primary difference lies in the unique Fibonacci levels and the indicator's precision in identifying point D as the key reversal zone. It shares structure with the Bat Pattern but differs in retracement logic.
Can both bullish and bearish patterns be viewed simultaneously?
Yes, simultaneous detection is possible by enabling both the BullishPattern and BearishPattern options.


