![Linear Regression Slope Indicator MetaTrader 5 – Free Download [TradingFinder]](https://cdn.tradingfinder.com/image/532843/2-138-en-linear-regression-slope-mt5-1.webp)
![Linear Regression Slope Indicator MetaTrader 5 – Free Download [TradingFinder] 0](https://cdn.tradingfinder.com/image/532843/2-138-en-linear-regression-slope-mt5-1.webp)
![Linear Regression Slope Indicator MetaTrader 5 – Free Download [TradingFinder] 1](https://cdn.tradingfinder.com/image/532841/2-138-en-linear-regression-slope-mt5-2.webp)
![Linear Regression Slope Indicator MetaTrader 5 – Free Download [TradingFinder] 2](https://cdn.tradingfinder.com/image/532835/2-138-en-linear-regression-slope-mt5-3.webp)
![Linear Regression Slope Indicator MetaTrader 5 – Free Download [TradingFinder] 3](https://cdn.tradingfinder.com/image/532838/2-138-en-linear-regression-slope-mt5-4.webp)
The Linear Regression Slope Indicator is a technical analysis tool that uses statistical and mathematical calculations to measure the slope of the linear regression line on price data.
This indicator displays changes in the rate of price growth as histogram bars. The longer the bars, the stronger the trend, while shorter bars indicate a weakening of market movement.
Linear Regression Slope Indicator Table
The general features of the Linear Regression Slope Indicator in MetaTrader 5 are shown in the table below:
Indicator Categories: | Oscillators MT5 Indicators Trading Assist MT5 Indicators Momentum Indicators in MT5 |
Platforms: | MetaTrader 5 Indicators |
Trading Skills: | Intermediate |
Indicator Types: | Reversal MT5 Indicators |
Timeframe: | Multi-Timeframe MT5 Indicators |
Trading Style: | Intraday MT5 Indicators |
Trading Instruments: | Forex MT5 Indicators Crypto MT5 Indicators Stock MT5 Indicators Commodity MT5 Indicators Indices MT5 Indicators Share Stock MT5 Indicators |
Linear Regression Slope Indicator at a Glance
The Linear Regression Slope Indicator is used to detect significant levels of trend reversal or breakout in markets such as foreign exchange (Forex) and cryptocurrency. This trading tool identifies three key points for entering trades:
- Point 1: Start of the main wave, which can be a recent significant high or low;
- Point 2: End of the corrective wave or the first significant change in price direction;
- Point 3: The second corrective move, where the trend may reverse or break.
The primary difference between the Zigzag indicator and this trading tool lies in the display of fluctuations and the identification of the Trigger Point, where a price break at level 2 triggers a significant shift in market momentum.
Indicator in an Uptrend
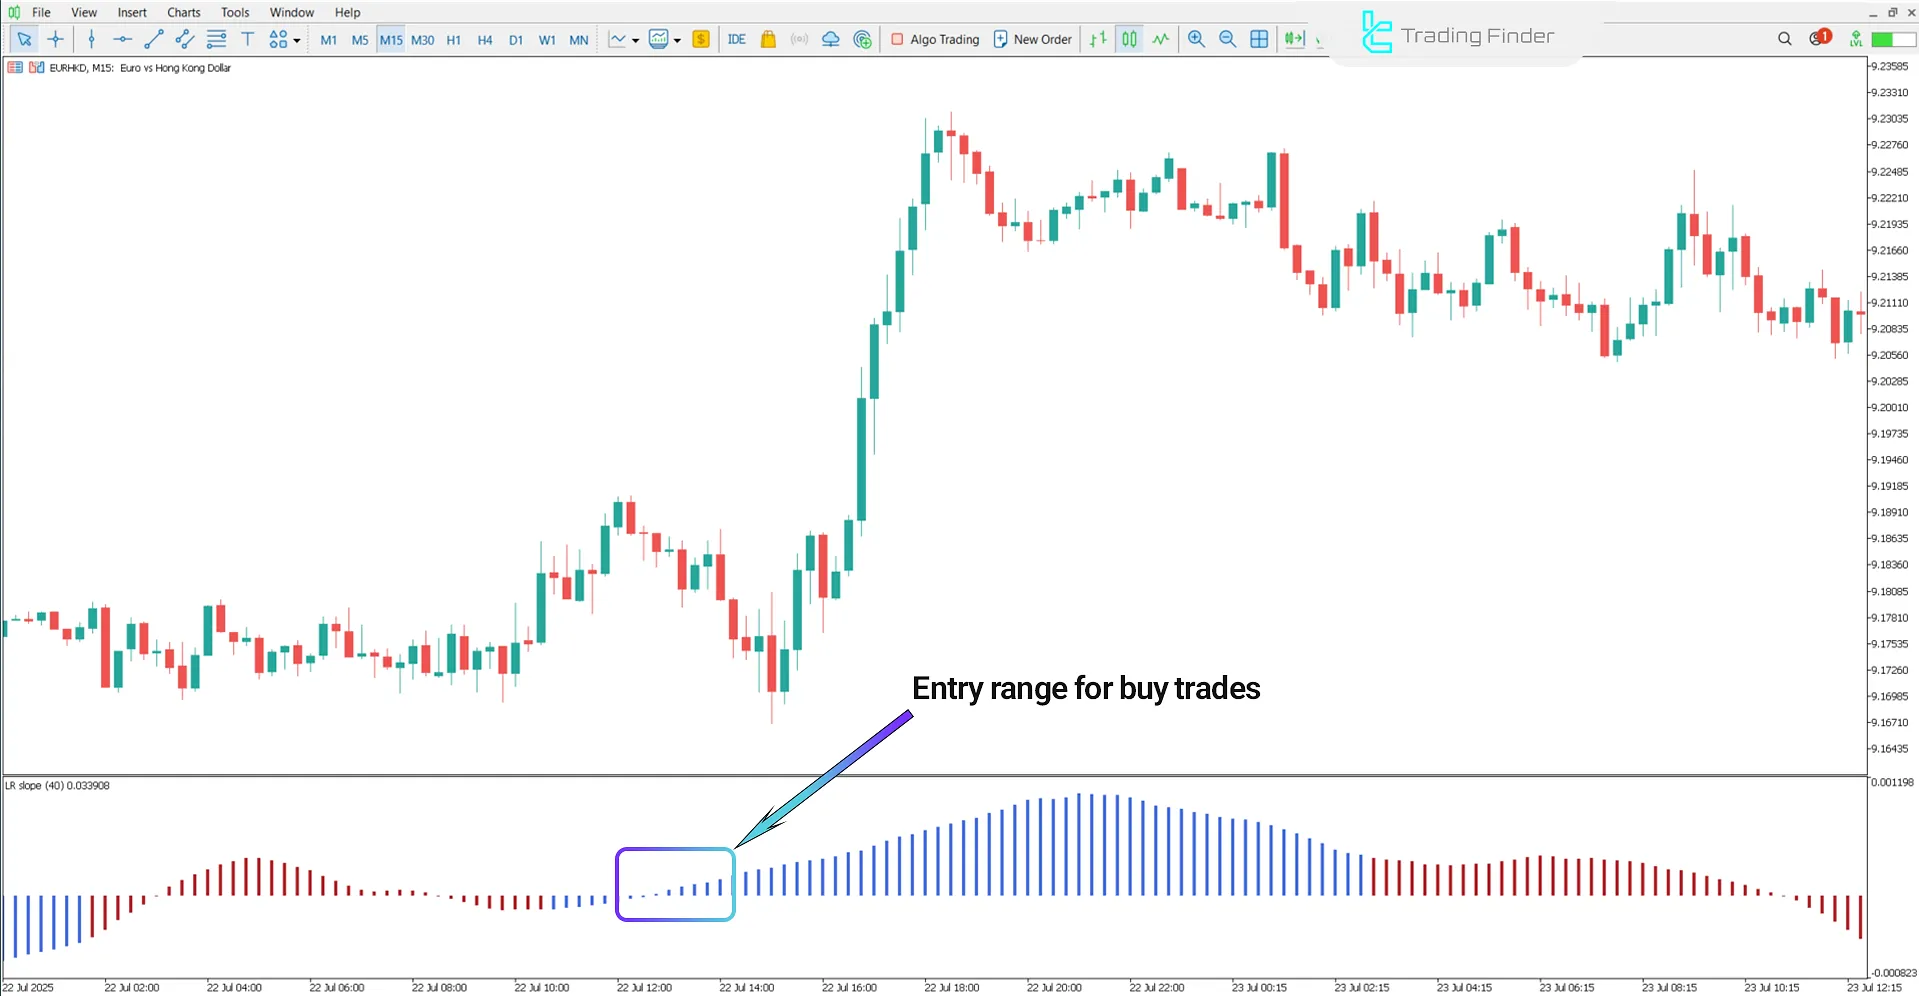
The price chart below shows the EUR/HKD currency pair on a 15-minute time frame.
When the linear regression slope is positive and continues to increase, it indicates strong upward momentum and rapid price growth in the 15-minute time frame.
A break of the slope from zero to positive typically signals the start of an uptrend, and its continued increase indicates an accelerating price movement, thereby suggesting an entry range for buy trades.

Indicator in a Downtrend
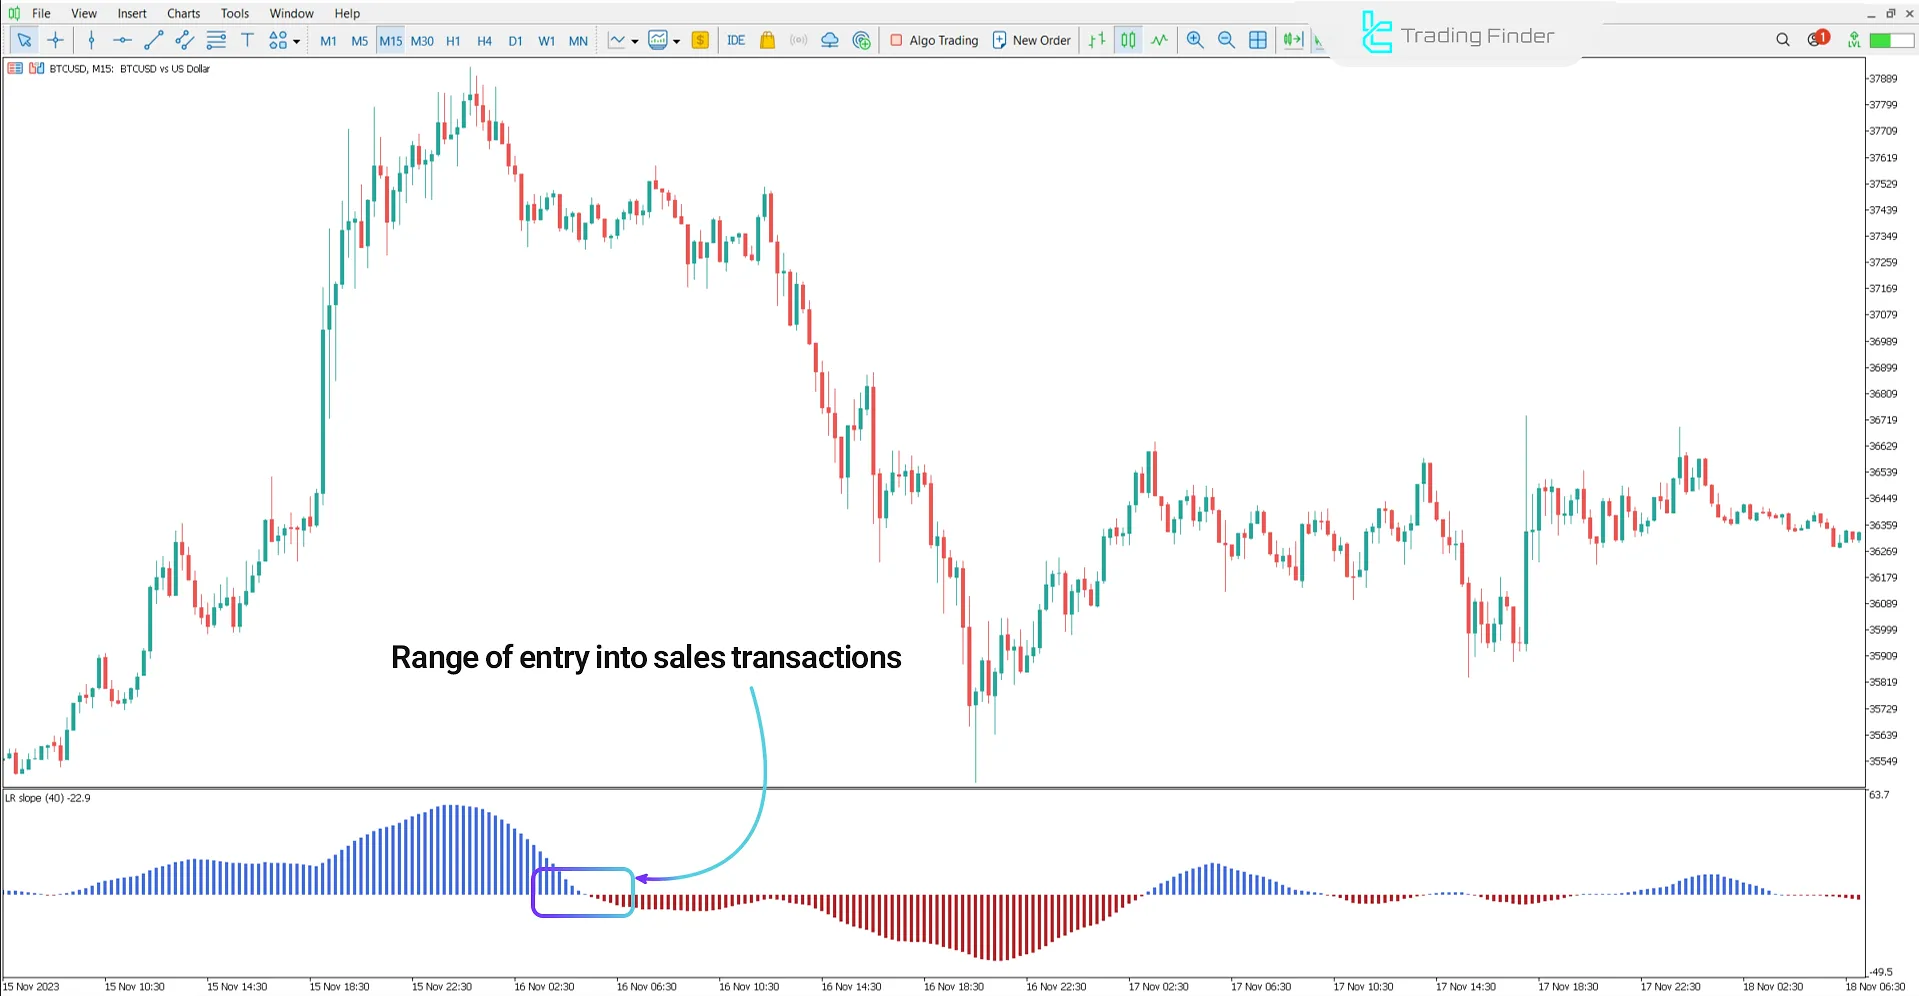
The image below shows the Bitcoin (BTC/USD) index on a 15-minute time frame.
When the linear regression slope is negative and decreasing, it indicates strong selling pressure and rapid price decline.
A break of the slope from zero to negative is typically considered a sign for the start of a downtrend, and its continued decrease confirms the ongoing price drop.
This signal is more reliable when accompanied by bearish candlestick patterns or high trading volumes.

Linear Regression Slope Indicator Settings
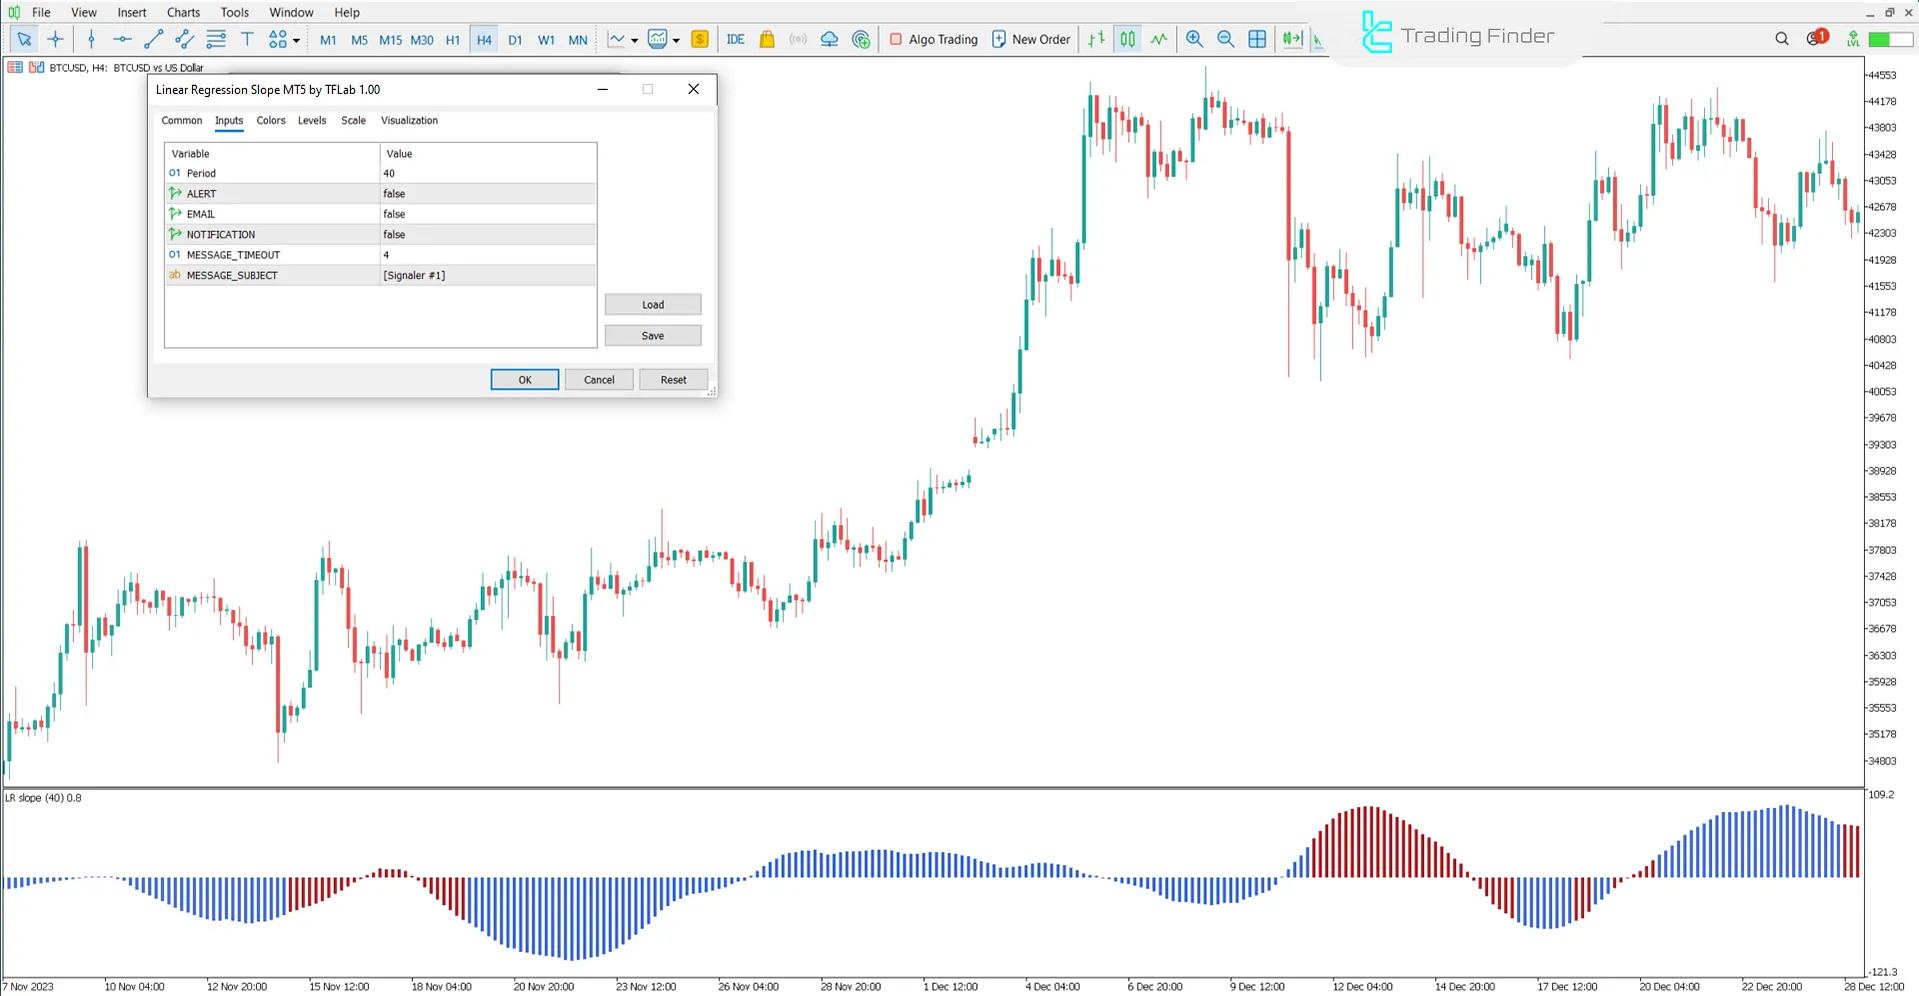
The image below displays the settings for the Linear Regression Slope Indicator in MetaTrader 5:

- Candles To Include In The Calculation: Number of candles to be included in the calculation
- Delay In The Channel: Delay in the channel
- Bars To Draw (0=No Limit): Number of bars to draw
- ALERT: Display alert
- EMAIL: Send email
- NOTIFICATION: Send notification
- MESSAGE_TIMEOUT: Message timeout period
- MESSAGE_SUBJECT: Subject of the message
Conclusion
The Linear Regression Slope Indicator, by measuring the slope of the regression line over a specified period, identifies the direction and strength of market momentum.
The results of this trading tool are displayed as a histogram, with bars above the zero line indicating an uptrend and bars below the zero line indicating a downtrend.
Linear Regression Slope Indicator MT5 PDF
Linear Regression Slope Indicator MT5 PDF
Click to download Linear Regression Slope Indicator MT5 PDFHow is the ranging market detected in the Linear Regression Slope Indicator?
In this trading tool, short bars and fluctuations near the zero line indicate a market with no clear trend.
What does the Linear Regression Slope Indicator exactly measure?
This indicator calculates the slope of the price regression line over a specific period and displays the direction and strength of market momentum.


