


![Liquidity Finder Levels Indicator (ICT) for MT5 Download - Free - [TradingFinder]](https://cdn.tradingfinder.com/image/107310/11-2-en-liquidity-finder-mt5.webp)
![Liquidity Finder Levels Indicator (ICT) for MT5 Download - Free - [TradingFinder] 1](https://cdn.tradingfinder.com/image/28985/11_02_en_liquidity-finder-mt5-02.avif)
![Liquidity Finder Levels Indicator (ICT) for MT5 Download - Free - [TradingFinder] 2](https://cdn.tradingfinder.com/image/28991/11_02_en_liquidity-finder-mt5-03.avif)
![Liquidity Finder Levels Indicator (ICT) for MT5 Download - Free - [TradingFinder] 3](https://cdn.tradingfinder.com/image/29001/11_02_en_liquidity-finder-mt5-04.avif)
The Liquidity Finder Indicator (LF) is a MetaTrader 5 (MT5) platform tool designed to identify Liquidity Levels in ICT and Smart Money concepts. The LF Indicator assists traders in identifying liquidity pools by drawing dynamic trend lines (Dynamic) and static trend lines (Static).
The blue trend lines represent liquidity highs, while the red lines indicate liquidity lows. Static trend lines appear on the chart as double-top or Double Bottom patterns.
Indicator Table (LF)
Indicator Categories: | Smart Money MT5 Indicators Currency Strength MT5 Indicators Liquidity Indicators MT5 Indicators ICT MT5 Indicators |
Platforms: | MetaTrader 5 Indicators |
Trading Skills: | Intermediate |
Indicator Types: | Leading MT5 Indicators Breakout MT5 Indicators |
Timeframe: | M1-M5 Timeframe MT5 Indicators M15-M30 Timeframe MT5 Indicators H1-H4 Timeframe MT5 Indicators |
Trading Style: | Intraday MT5 Indicators Scalper MT5 Indicators Day Trading MT5 Indicators |
Trading Instruments: | Forex MT5 Indicators Crypto MT5 Indicators Stock MT5 Indicators Indices MT5 Indicators Share Stock MT5 Indicators |
Liquidity Collection at the Highs
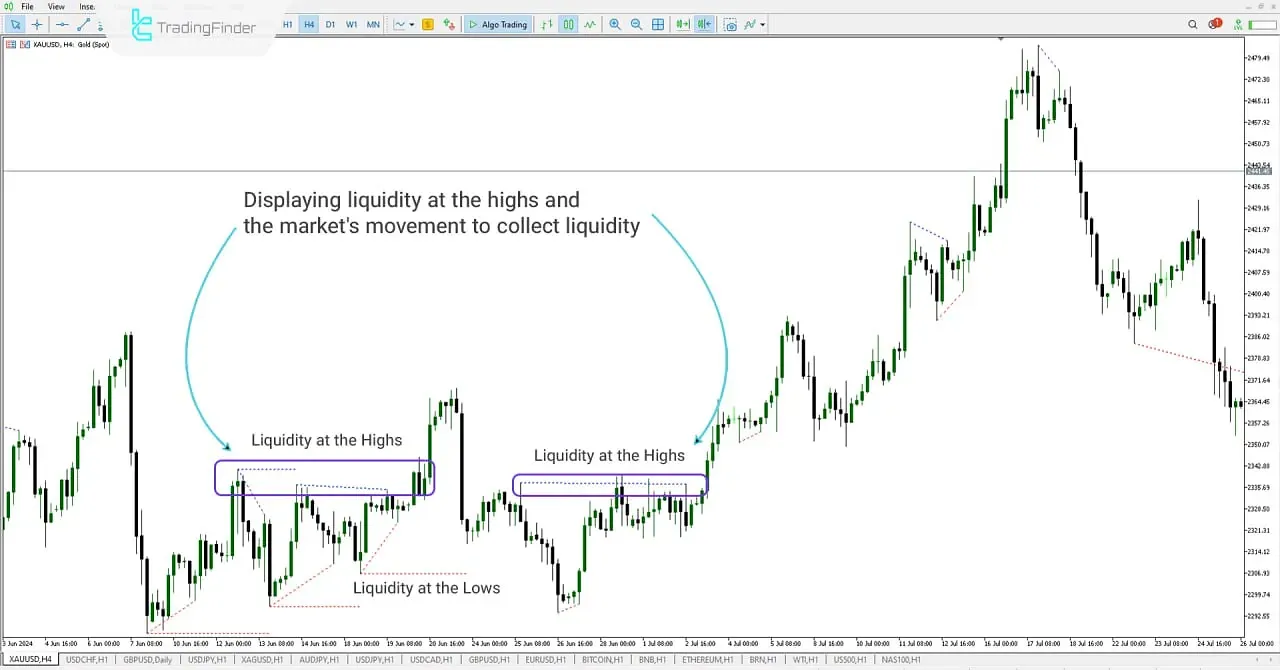
In the 4-hour (XAUUSD) chart, the LF indicator displays liquidity levels at the highs, forming a double-top pattern.
The market moved towards these levels at the price of 2306.93, and after a drop and collection of liquidity at the lows, it moved upward. After surpassing the 2335.69 price level, an upward trend began.
Liquidity Collection at the Lows
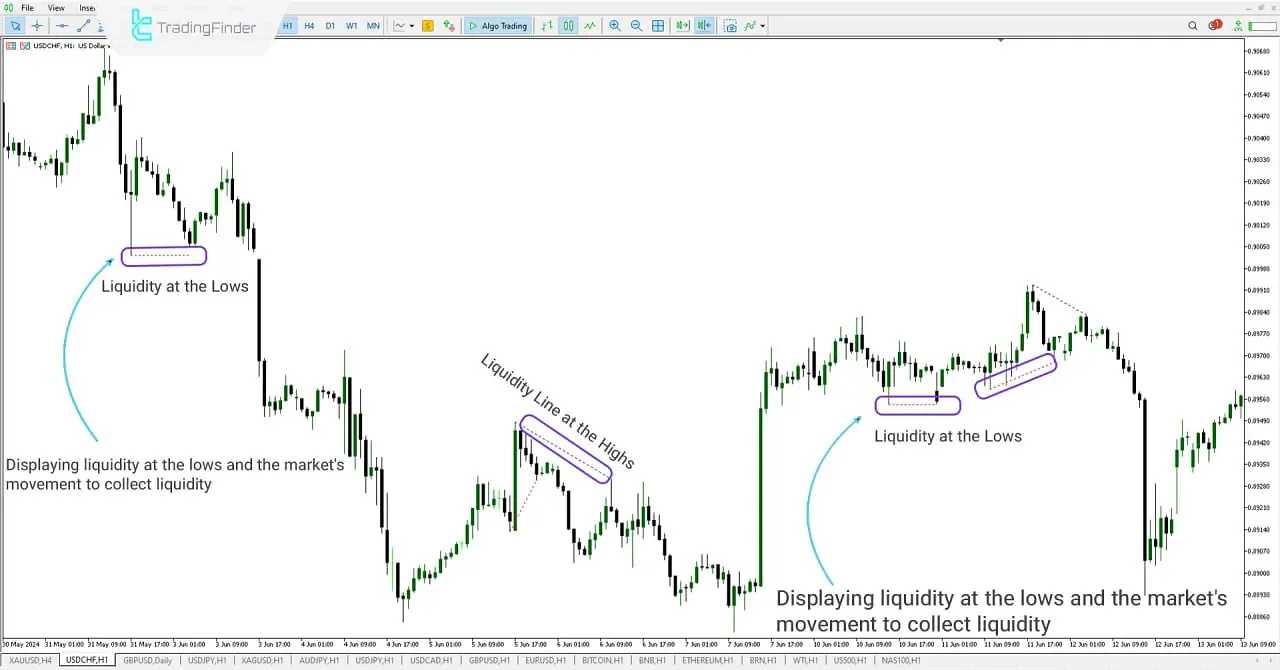
In the 1-hour (USD/CHF) chart, the LF indicator displays liquidity lows and lines, showing traders where market liquidity has accumulated and in which direction the market is likely to move to collect this liquidity.
The LF indicator helps analysts identify the direction and key points of liquidity collection.
Indicator settings
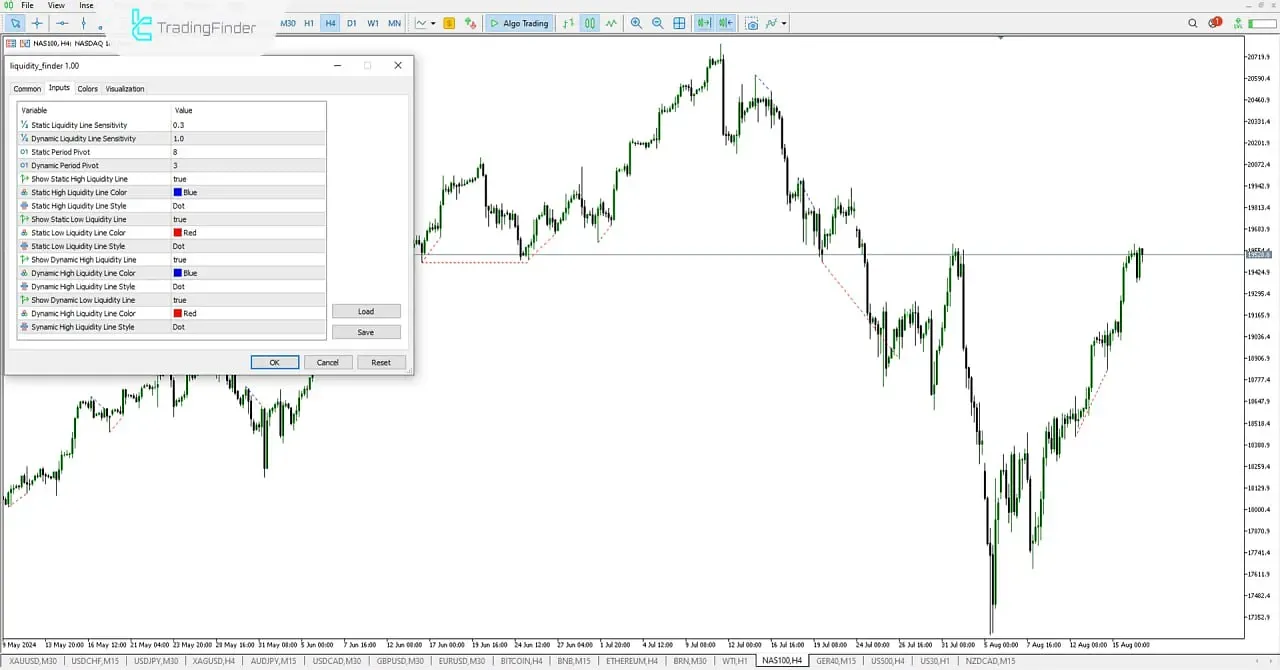
- Static Liquidity Line Sensitivity: Settings for Static Liquidity Line Sensitivity;
- Dynamic Liquidity Line Sensitivity: Settings for Dynamic Liquidity Line Sensitivity;
- Static Period Pivot: Settings for Static Pivot Period;
- Dynamic Period Pivot: Settings for Dynamic Pivot Period;
- Show Static High Liquidity Line: Settings for Displaying the Static High Liquidity Line;
- Static High Liquidity Line Color: Settings for Static High Liquidity Line Color;
- Static High Liquidity Line Style: Settings for Static High Liquidity Line Style;
- Show Static Low Liquidity Line: Settings for Displaying the Static Low Liquidity Line;
- Static Low Liquidity Line Color: Settings for Static Low Liquidity Line Color;
- Static Low Liquidity Line Style: Settings for Static Low Liquidity Line Style;
- Show Dynamic High Liquidity Line: Settings for Displaying the Dynamic High Liquidity Line;
- Dynamic High Liquidity Line Color: Settings for Dynamic High Liquidity Line Color;
- Dynamic High Liquidity Line Style: Settings for Dynamic High Liquidity Line Style;
- Show Dynamic Low Liquidity Line: Settings for Displaying the Dynamic Low Liquidity Line;
- Dynamic Low Liquidity Line Color: Settings for Dynamic Low Liquidity Line Color;
- Dynamic High Liquidity Line Style: Settings for Dynamic High Liquidity Line Style.
Summary
The Liquidity Finder Indicator (LF) is a tool that displays liquidity levels and lines on the chart for ICT and Smart Money traders, helping them identify liquidity zones.
The LF Indicator assists analysts in better identifying the locations of market orders and optimizing their trading decisions based on this information.
Liquidity Finder Levels ICT MT5 PDF
Liquidity Finder Levels ICT MT5 PDF
Click to download Liquidity Finder Levels ICT MT5 PDFWhat areas does the LF indicator display?
This indicator displays market order ranges and liquidity areas for traders on the chart.
Is the Liquidity Finder indicator suitable for all traders?
Yes, this indicator is suitable for all traders. However, the LF indicator is most commonly used by traders who follow the ICT and Smart Money trading styles.


