![Moving Average Rainbow Indicator MT5 Download – Free – [TradingFinder]](https://cdn.tradingfinder.com/image/476284/13-177-en-ma-rainbow-mt5-01.webp)
![Moving Average Rainbow Indicator MT5 Download – Free – [TradingFinder] 0](https://cdn.tradingfinder.com/image/476284/13-177-en-ma-rainbow-mt5-01.webp)
![Moving Average Rainbow Indicator MT5 Download – Free – [TradingFinder] 1](https://cdn.tradingfinder.com/image/476281/13-177-en-ma-rainbow-mt5-02.webp)
![Moving Average Rainbow Indicator MT5 Download – Free – [TradingFinder] 2](https://cdn.tradingfinder.com/image/476280/13-177-en-ma-rainbow-mt5-03.webp)
![Moving Average Rainbow Indicator MT5 Download – Free – [TradingFinder] 3](https://cdn.tradingfinder.com/image/476285/13-177-en-ma-rainbow-mt5-04.webp)
The Rainbow Moving Average Indicator (MA Rainbow) comprises a combination of eight moving averages with varying periods, used to determine price direction, identify trend reversals, and analyze trend strength.
The relative position of the price to these moving averages can serve as a guide for identifying suitable buy and sell entry points.
Specification Table of the Rainbow Moving Average Indicator
The specifications of the MA Rainbow Indicator are as follows:
Indicator Categories: | Trading Assist MT5 Indicators Bands & Channels MT5 Indicators |
Platforms: | MetaTrader 5 Indicators |
Trading Skills: | Intermediate |
Indicator Types: | Overbought & Oversold MT5 Indicators Reversal MT5 Indicators |
Timeframe: | Multi-Timeframe MT5 Indicators |
Trading Style: | Swing Trading MT5 Indicators Scalper MT5 Indicators Day Trading MT5 Indicators |
Trading Instruments: | Forex MT5 Indicators Crypto MT5 Indicators Stock MT5 Indicators |
Rainbow MA Indicator at a Glance
The Rainbow Moving Average Indicator is not only useful for analyzing bullish and bearish trends but also performs well in identifying overbought and oversold zones.
By identifying these zones, one can anticipate a potential trend reversal and open trades against the current trend when appropriate.
Buy Trade Setup
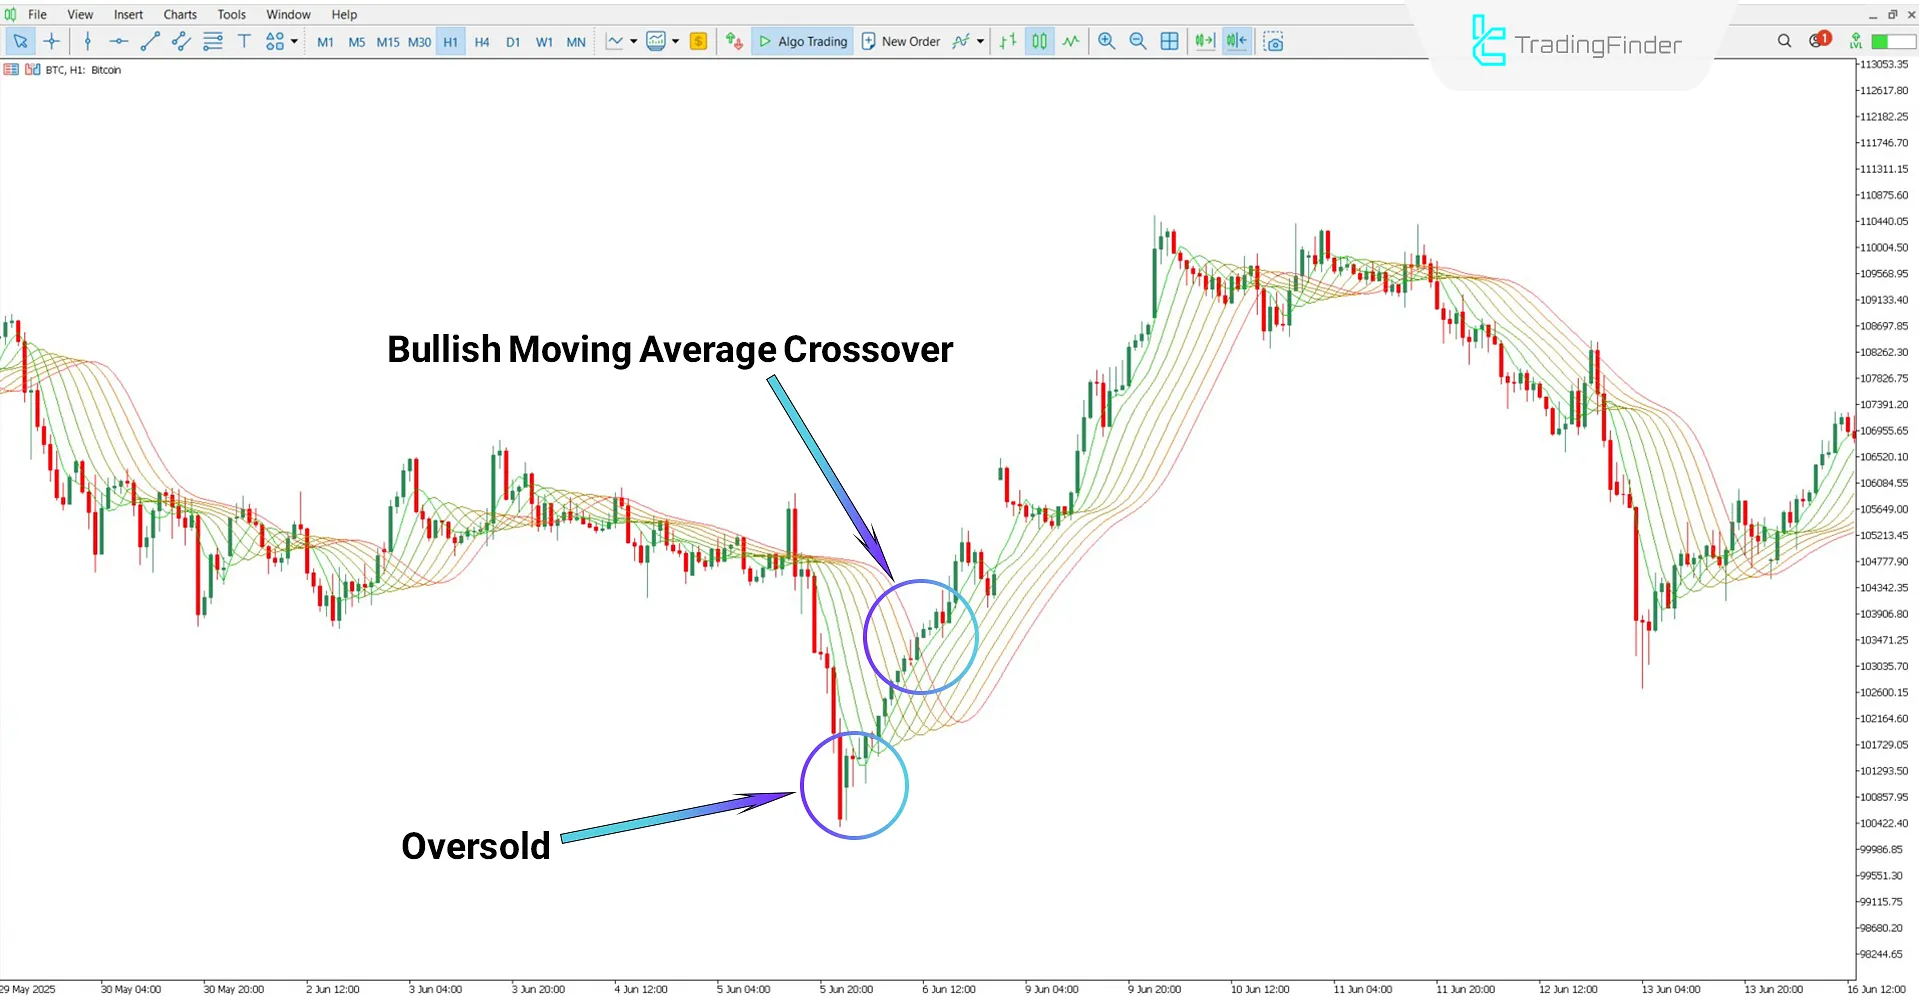
Based on the Bitcoin (BTC) chart in the 1-hour timeframe, the price has dropped to the lowest level of the moving averages, indicated by the green line, which suggests an oversold area.
If the price reverses from this area and successfully breaks upward through the moving average lines, it can be considered a signal for entering a buy trade.

Sell Trade Setup
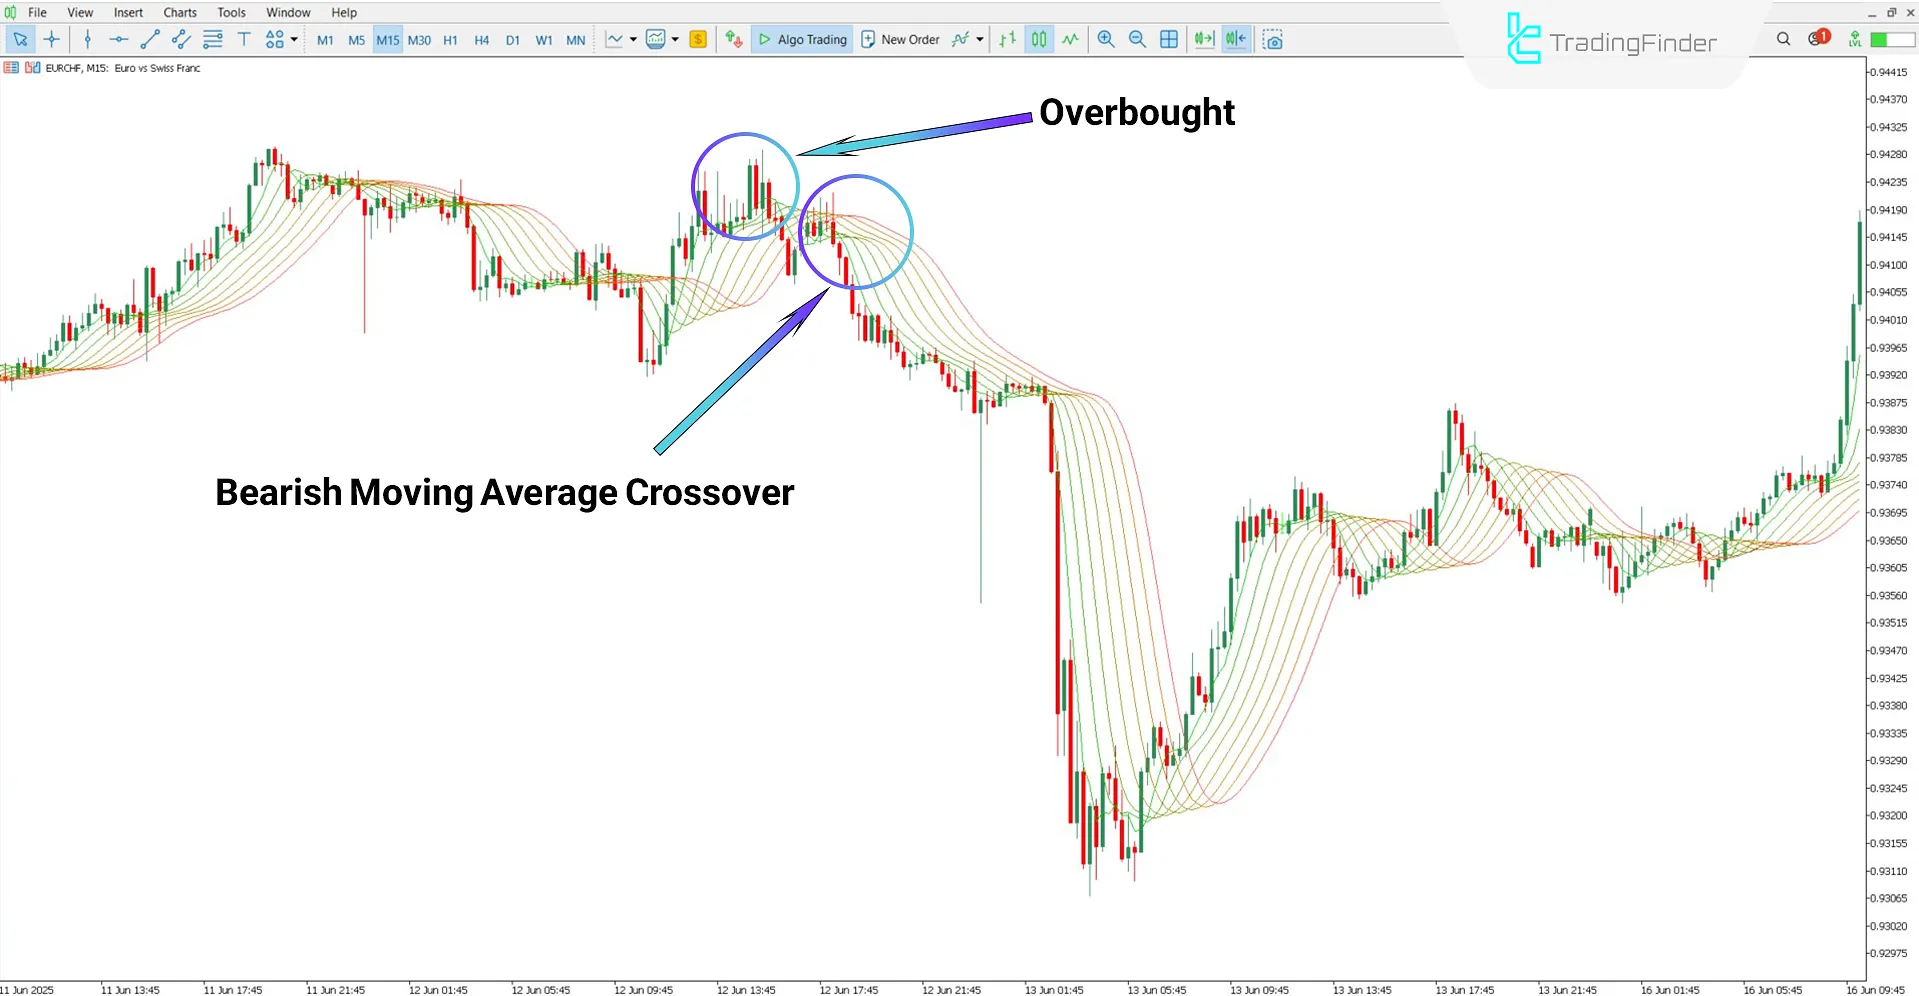
According to the EUR/CHF chart in the 15-minute timeframe, the price first enters the overbought zone, then reverses downward and breaks below the moving averages.
In such conditions, a retest of the moving averages can be considered a sell trade opportunity.

Rainbow Moving Average Indicator Settings
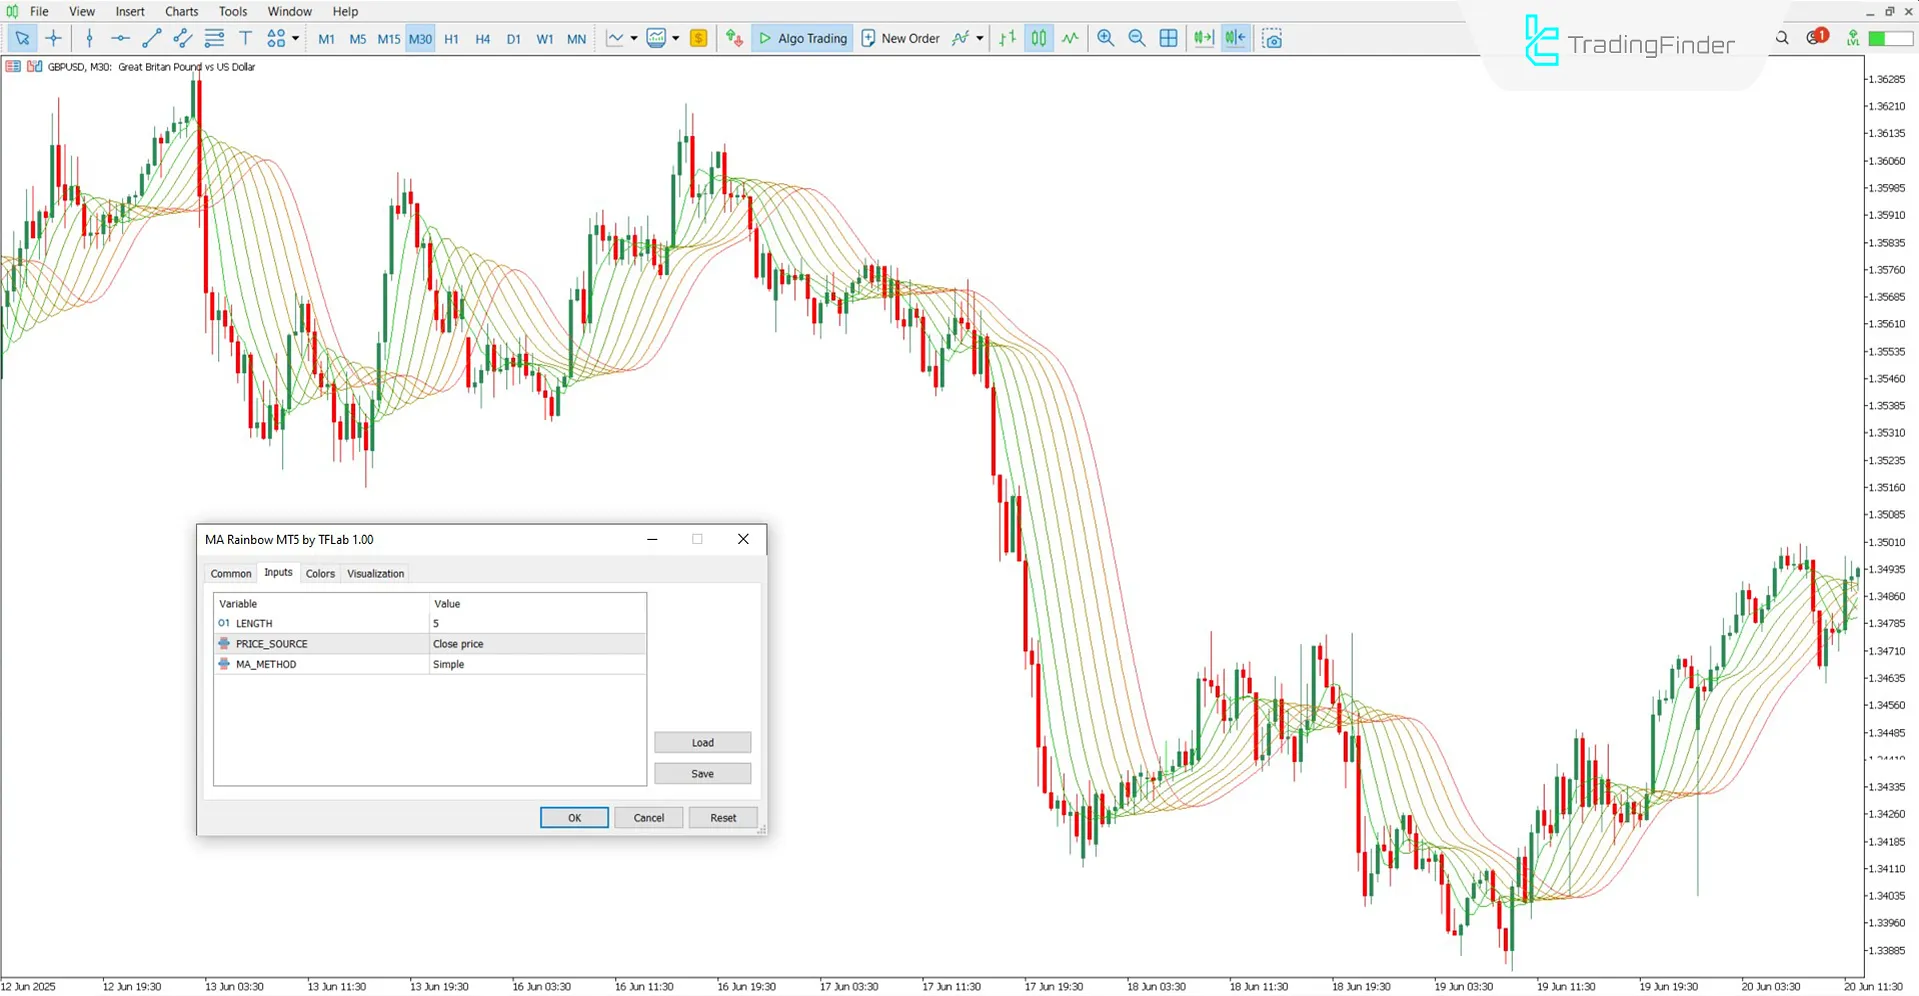
The settings of the Rainbow Moving Average Indicator are as follows:

- LENGTH: Number of candles used for calculating the moving average
- PRICE_SOURCE: Specifies which part of the candle is used for calculations
- MA_METHOD: Type of moving average to be used
Conclusion
The Rainbow Moving Average Indicator has been developed to reflect directional trend changes in MetaTrader 5. This trading tool not only displays the price trend but also identifies overbought and oversold zones, which can be considered potential entry opportunities.
Moreover, under normal market conditions, the price crossing through the moving averages may indicate trend continuation and serve as an entry signal in the market’s direction.
Moving Average Rainbow Indicator MT5 PDF
Moving Average Rainbow Indicator MT5 PDF
Click to download Moving Average Rainbow Indicator MT5 PDFHow does the MA Rainbow Indicator show market trends?
When the colored lines diverge and align directionally, bullish or bearish trends become recognizable.
Which markets is this indicator suitable for?
The Rainbow Moving Average Indicator can be used across all markets without any limitations.


