![MACD 2 Color Histogram Indicator MT5 Download – Free – [TradingFinder]](https://cdn.tradingfinder.com/image/505747/13-191-en-macd-2-color-histogram-mt5-01.webp)
![MACD 2 Color Histogram Indicator MT5 Download – Free – [TradingFinder] 0](https://cdn.tradingfinder.com/image/505747/13-191-en-macd-2-color-histogram-mt5-01.webp)
![MACD 2 Color Histogram Indicator MT5 Download – Free – [TradingFinder] 1](https://cdn.tradingfinder.com/image/505748/13-191-en-macd-2-color-histogram-mt5-02.webp)
![MACD 2 Color Histogram Indicator MT5 Download – Free – [TradingFinder] 2](https://cdn.tradingfinder.com/image/505744/13-191-en-macd-2-color-histogram-mt5-03.webp)
![MACD 2 Color Histogram Indicator MT5 Download – Free – [TradingFinder] 3](https://cdn.tradingfinder.com/image/505743/13-191-en-macd-2-color-histogram-mt5-04.webp)
The MACD 2 Color Histogram indicator is designed to analyze price momentum strength and identify optimal entry points for trades.
This tool displays market momentum changes through histograms in two different colors; green bars indicate bullish trend strength, while red bars signal a weakening or strengthening bearish trend.
MACD 2 Color Histogram Oscillator Specifications Table
The specifications of the MACD 2 Color Histogram indicator are as follows.
Indicator Categories: | Oscillators MT5 Indicators Signal & Forecast MT5 Indicators Currency Strength MT5 Indicators |
Platforms: | MetaTrader 5 Indicators |
Trading Skills: | Elementary |
Indicator Types: | Reversal MT5 Indicators |
Timeframe: | Multi-Timeframe MT5 Indicators |
Trading Style: | Swing Trading MT5 Indicators Scalper MT5 Indicators Day Trading MT5 Indicators |
Trading Instruments: | Forex MT5 Indicators Crypto MT5 Indicators Stock MT5 Indicators |
MACD 2 Color Histogram Indicator at a Glance
In the MACD 2 Color Histogram oscillator, entry and exit signals are generated based on the crossover point of the MACD line with the signal line.
When the MACD line crosses above the signal line, this is considered a buy signal. Conversely, a downward crossover may indicate the start of a bearish trend.
Buy Trade
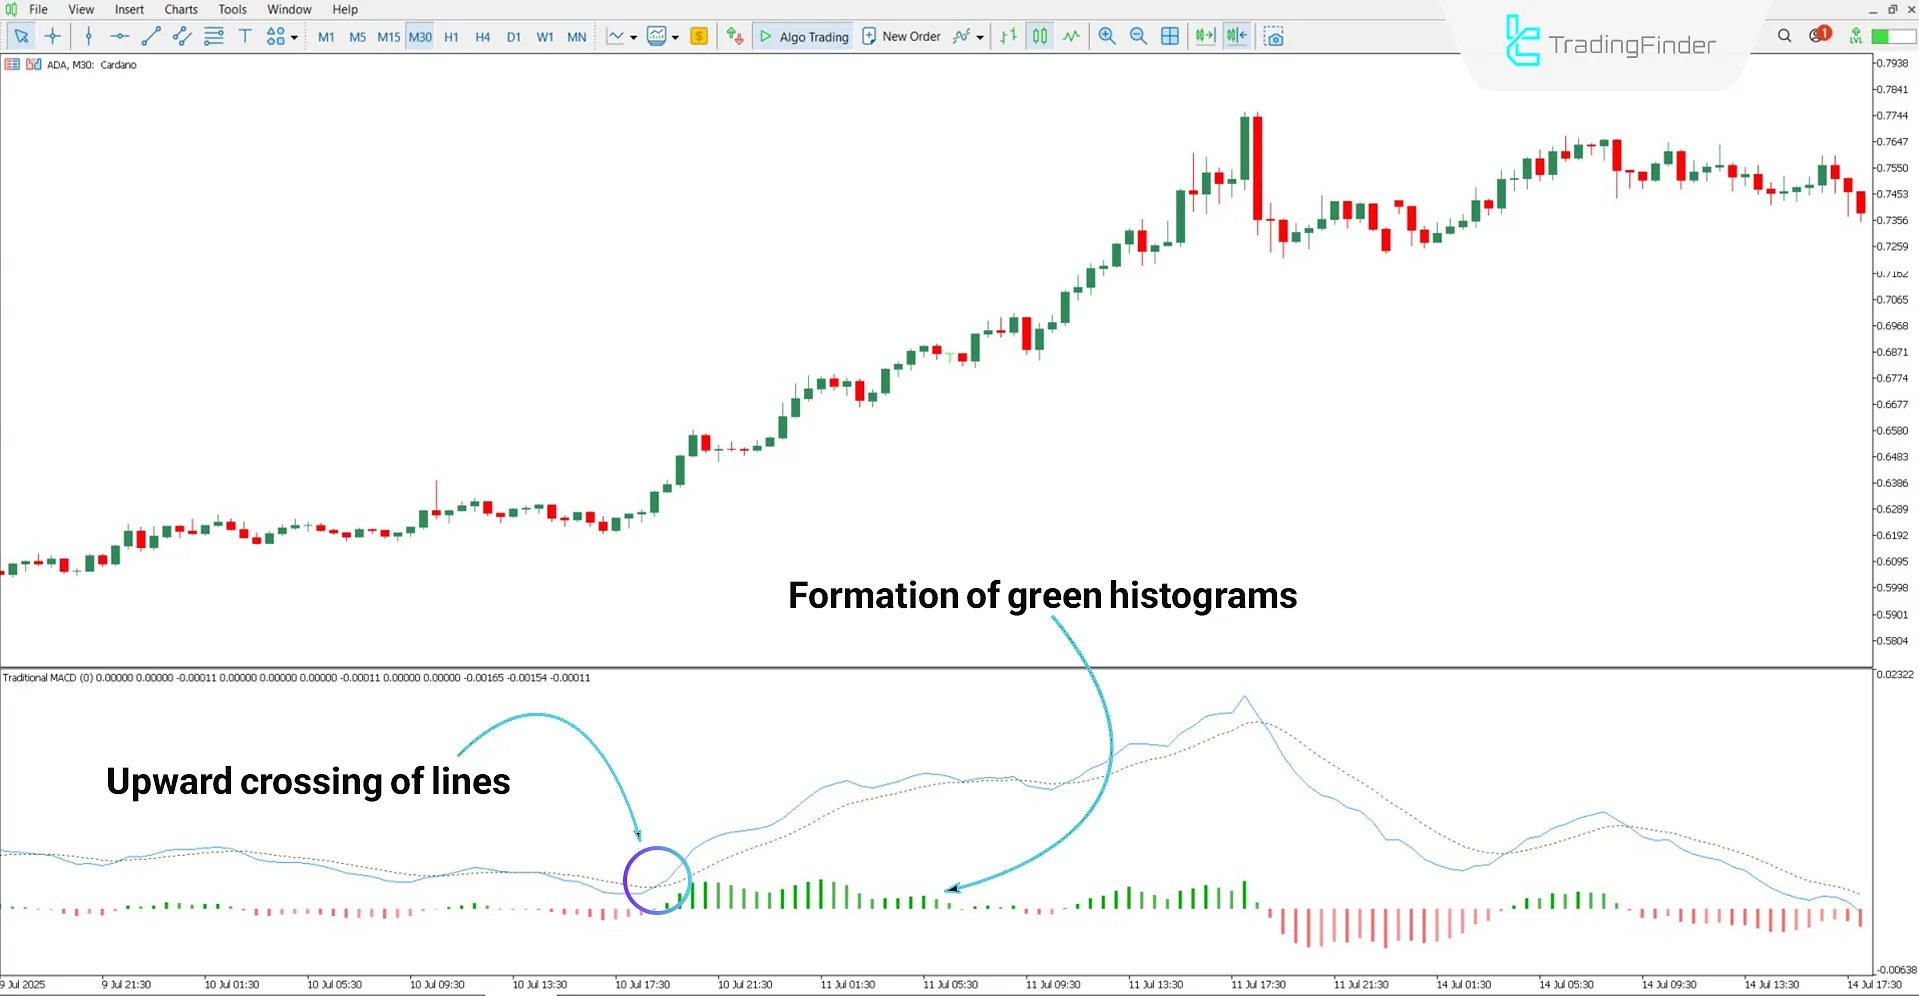
On the 30-minute chart of the cryptocurrency Cardano (ADA), when the MACD line crosses above the signal line, favorable conditions for entering a buy position are created.
Subsequently, the appearance of green histograms signals increasing bullish momentum and confirms the trend’s strength.

Sell Trade
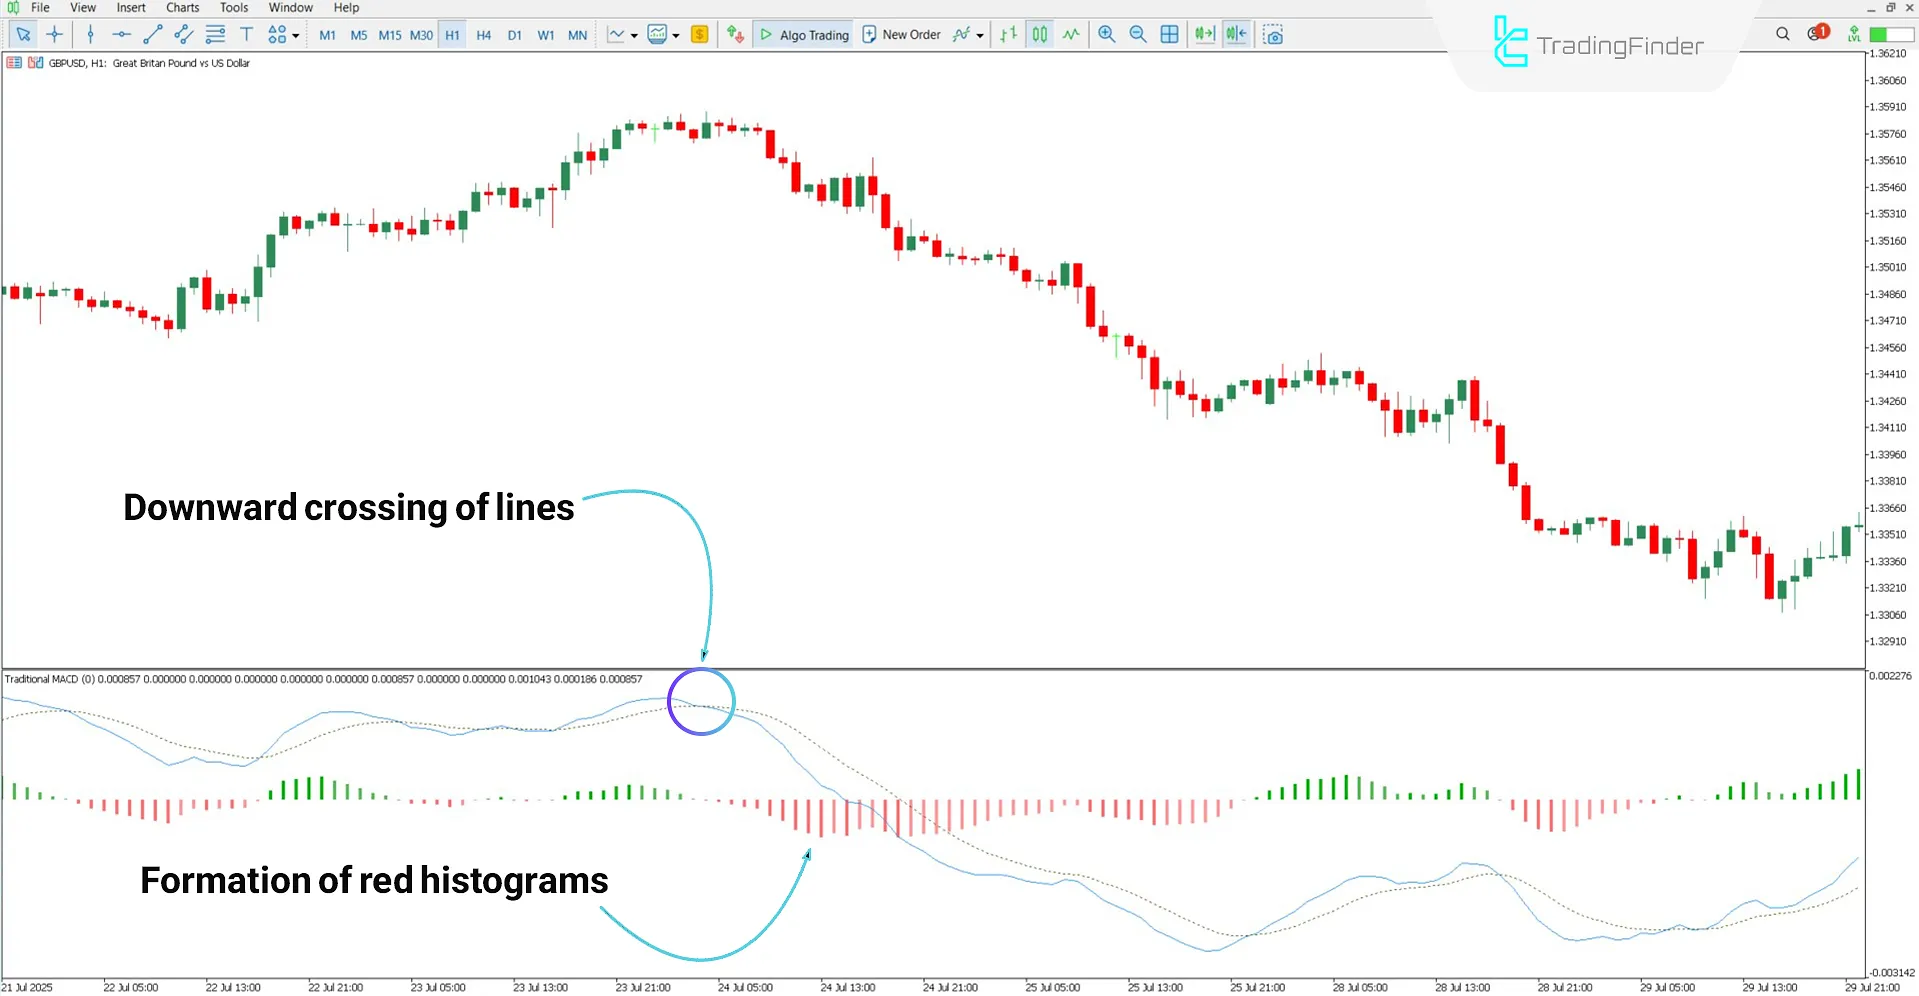
Based on the GBP/USD 1-hour chart, the downward crossover of the MACD line with the signal line is considered a sell entry signal.
Furthermore, the continued formation of red histograms may indicate sustained selling pressure and the persistence of a bearish trend.

MACD 2 Color Histogram Indicator Settings
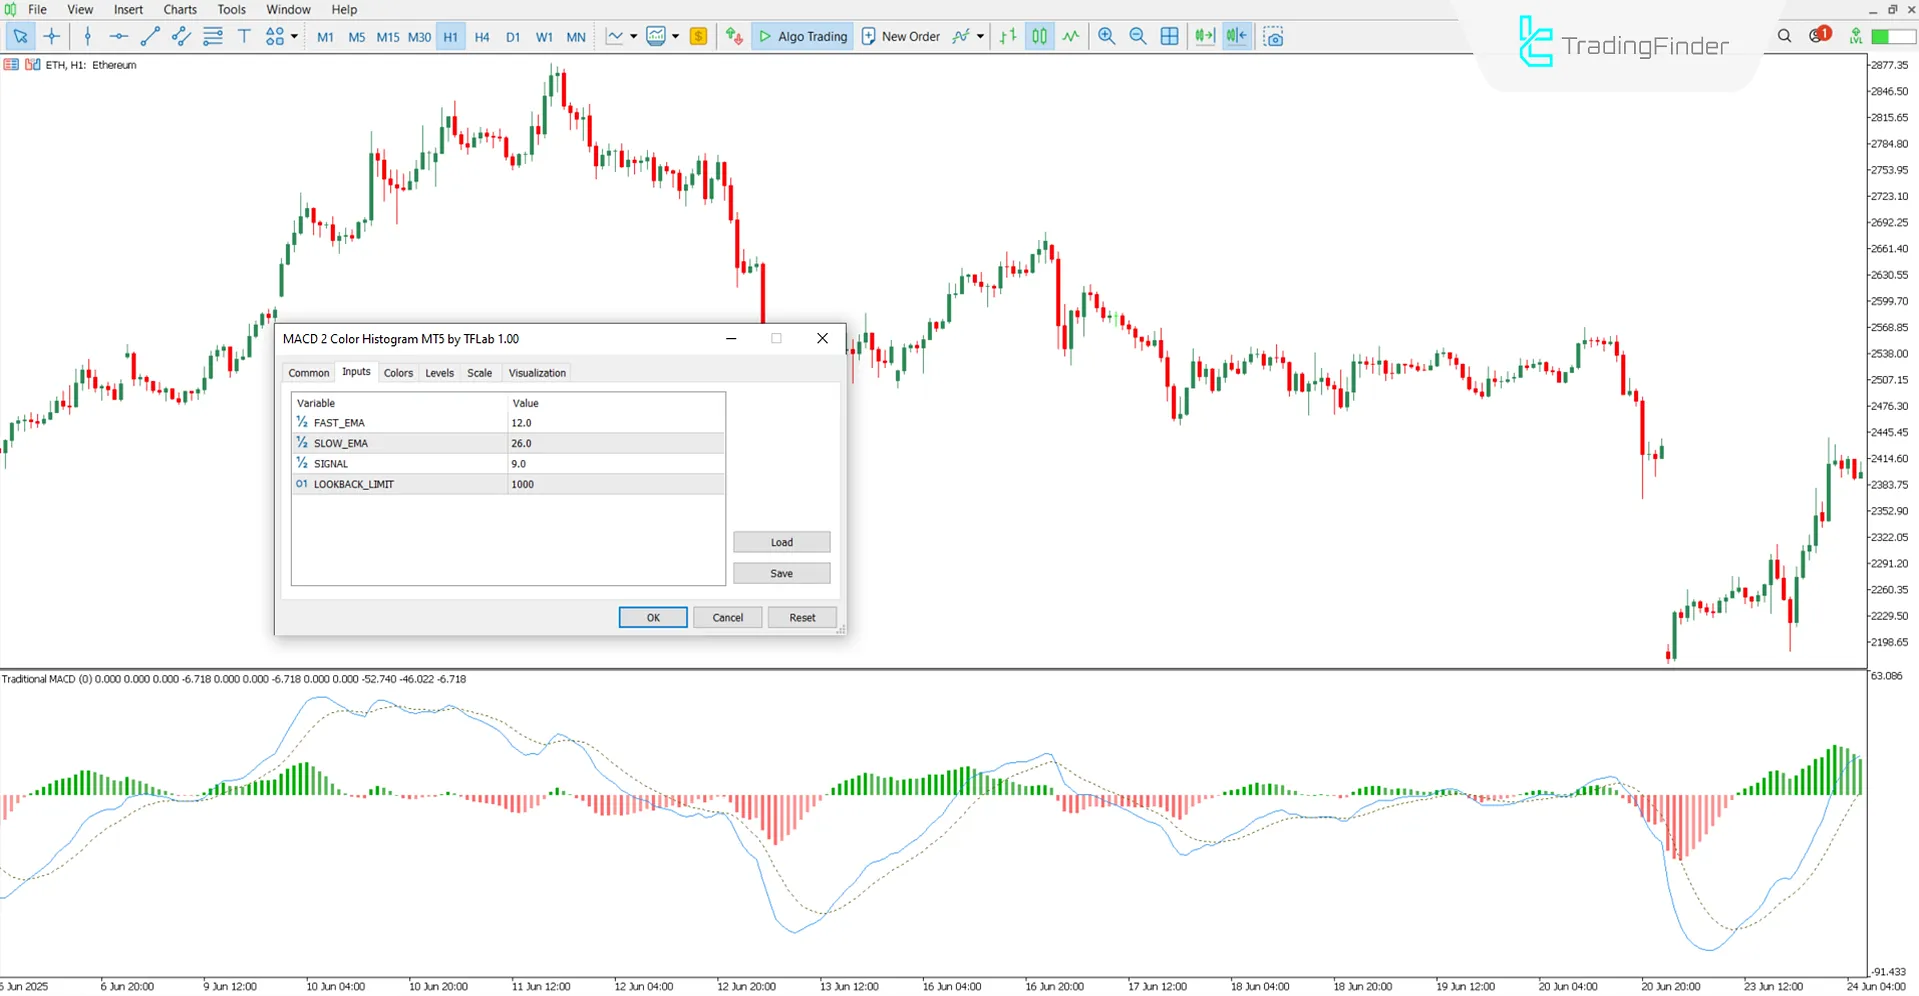
The MACD 2 Color Histogram oscillator settings are as follows:

- FAST_EMA: Fast moving average calculations
- SLOW_EMA: Slow-moving average calculations
- SIGNAL: Exponential moving average calculations for the signal line
- LOOKBACK_LIMIT: Lookback range limiter for display or calculation
Conclusion
The MACD 2 Color Histogram oscillator uses changes in histogram bar colors to indicate market momentum and show the likely direction of the trend (bullish or bearish).
The crossover point of the MACD line with the signal line plays a key role in identifying entry points for buy or sell trades.
Additionally, this tool offers customization; traders can adjust fast, slow, and other moving average parameters to match their strategies.
MACD 2 Color Histogram Indicator MT5 PDF
MACD 2 Color Histogram Indicator MT5 PDF
Click to download MACD 2 Color Histogram Indicator MT5 PDFCan this indicator be used on 5-minute or 15-minute timeframes?
Yes, this is a multi-timeframe indicator and can be used on all timeframes.
What does the consecutive formation of green bars mean?
The consecutive formation of green histograms indicates bullish trend momentum.


