![MACD 2 Line Oscillator for MT5 Download - Free [TradingFinder]](https://cdn.tradingfinder.com/image/168286/13-10-en-macd2l-mt5-1.webp)
![MACD 2 Line Oscillator for MT5 Download - Free [TradingFinder] 0](https://cdn.tradingfinder.com/image/168286/13-10-en-macd2l-mt5-1.webp)
![MACD 2 Line Oscillator for MT5 Download - Free [TradingFinder] 1](https://cdn.tradingfinder.com/image/168285/13-10-en-macd2l-mt5-2.webp)
![MACD 2 Line Oscillator for MT5 Download - Free [TradingFinder] 2](https://cdn.tradingfinder.com/image/168287/13-10-en-macd2l-mt5-3.webp)
![MACD 2 Line Oscillator for MT5 Download - Free [TradingFinder] 3](https://cdn.tradingfinder.com/image/168288/13-10-en-macd2l-mt5-4.webp)
The MACD 2 Line Indicator (MACD 2 LINE) is a powerful and advanced version of the "MACD" indicator in Meta Trader 5.
This trading tool displays two moving averages (EMAs) in blue and red colors and a volume histogram in a separate panel from the price chart.
Additionally, drawing a zero line helps to identify overbought and oversold zones.
Specifications Table for the 2 Line MACD Indicator
The tool's specification table provides a comprehensive overview of its features:
Indicator Categories: | Oscillators MT5 Indicators Signal & Forecast MT5 Indicators Currency Strength MT5 Indicators MACD Indicators for MetaTrader 5 |
Platforms: | MetaTrader 5 Indicators |
Trading Skills: | Intermediate |
Indicator Types: | Reversal MT5 Indicators |
Timeframe: | Multi-Timeframe MT5 Indicators |
Trading Style: | Day Trading MT5 Indicators |
Trading Instruments: | Forex MT5 Indicators Crypto MT5 Indicators Stock MT5 Indicators Commodity MT5 Indicators Indices MT5 Indicators Forward MT5 Indicators Share Stock MT5 Indicators |
MACD 2 Line Indicator Overview
The MACD 2 Line Indicator uses moving averages (EM As) and a volume histogram to provide entry and exit signals.
The moving averages include a fast line in blue and a slow line in red. Histogram bars above the zero line indicate buying pressure. If the bars are below the zero line, the trend is bearish.
Uptrend Conditions
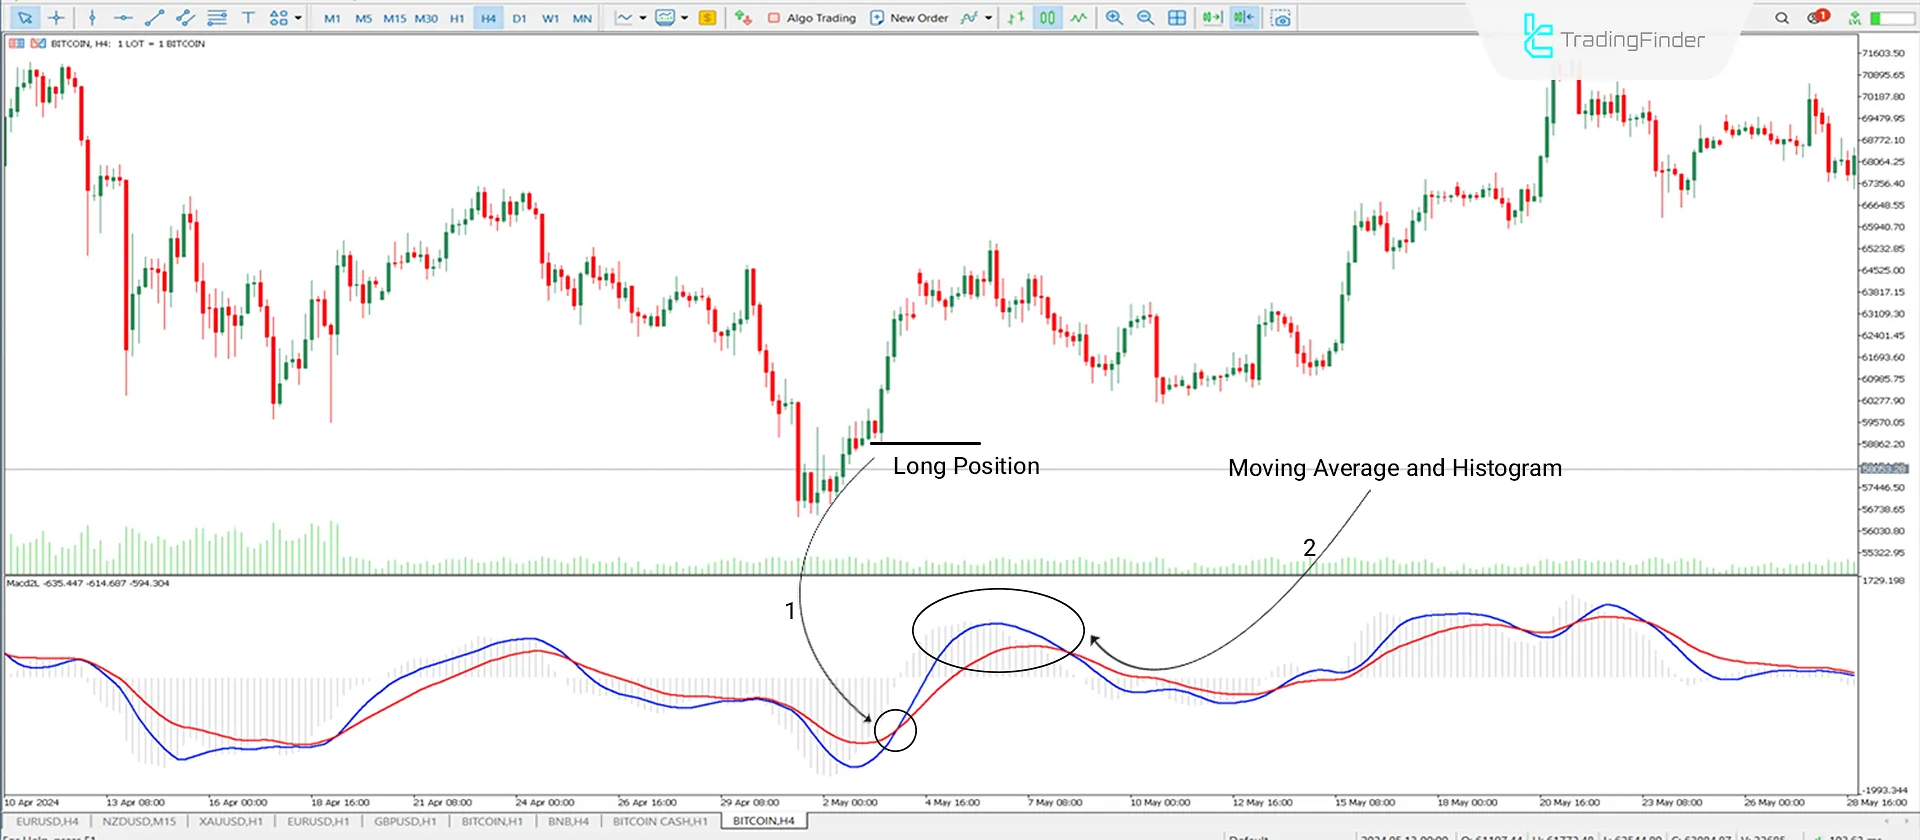
According to Arrow 1 on the 4-hour price chart of Bitcoin (BTC), the fast line (Fast EMA) crosses above the slow line (Slow EMA) and oscillates above the zero line.
The crossing of the fast line above the slow line signals the beginning of an uptrend.
Arrow 2 indicates the volume and formation of histogram bars above the zero line. If the histogram remains overbought, traders can stay in long positions.

Downtrend Conditions
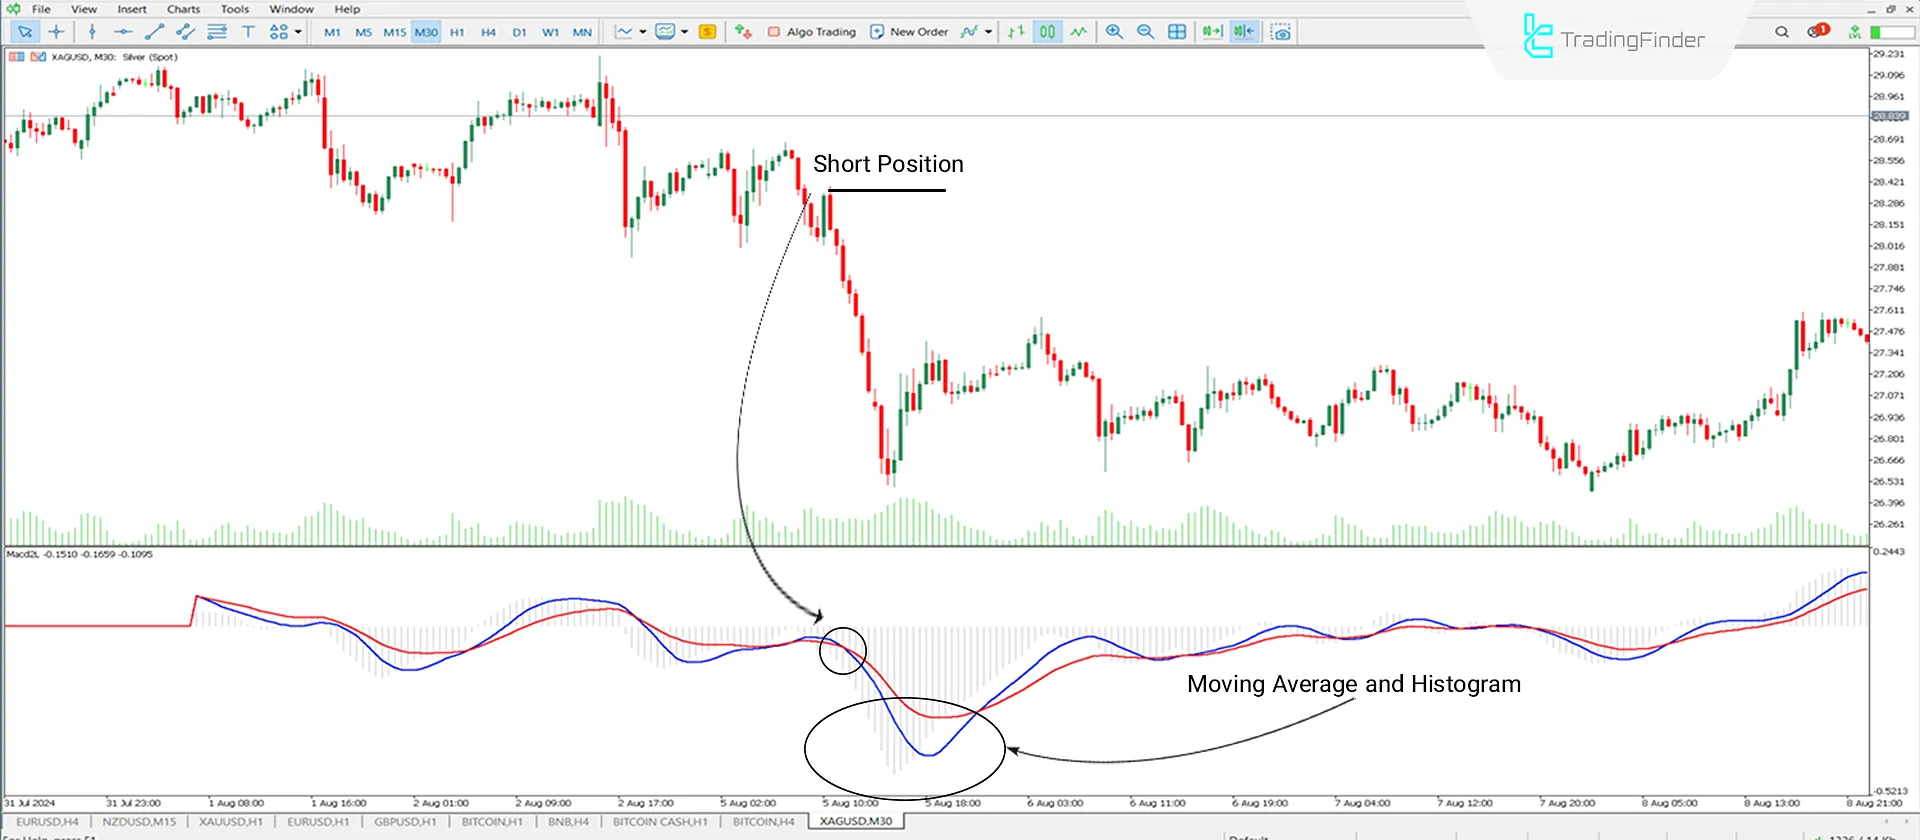
According to Arrow 1 on the 30-minute price chart of Silver against the US Dollar (XAG/USD), the fast line (Fast EMA) crosses below the slow line (Slow EMA) and falls below the zero line.
The crossing of the fast line below the slow line indicates a downtrend. Based on Arrow 2, the histogram volume below the zero line is in the oversold area.

Indicator Settings
Users can use this section to customize the functionality of the tool:

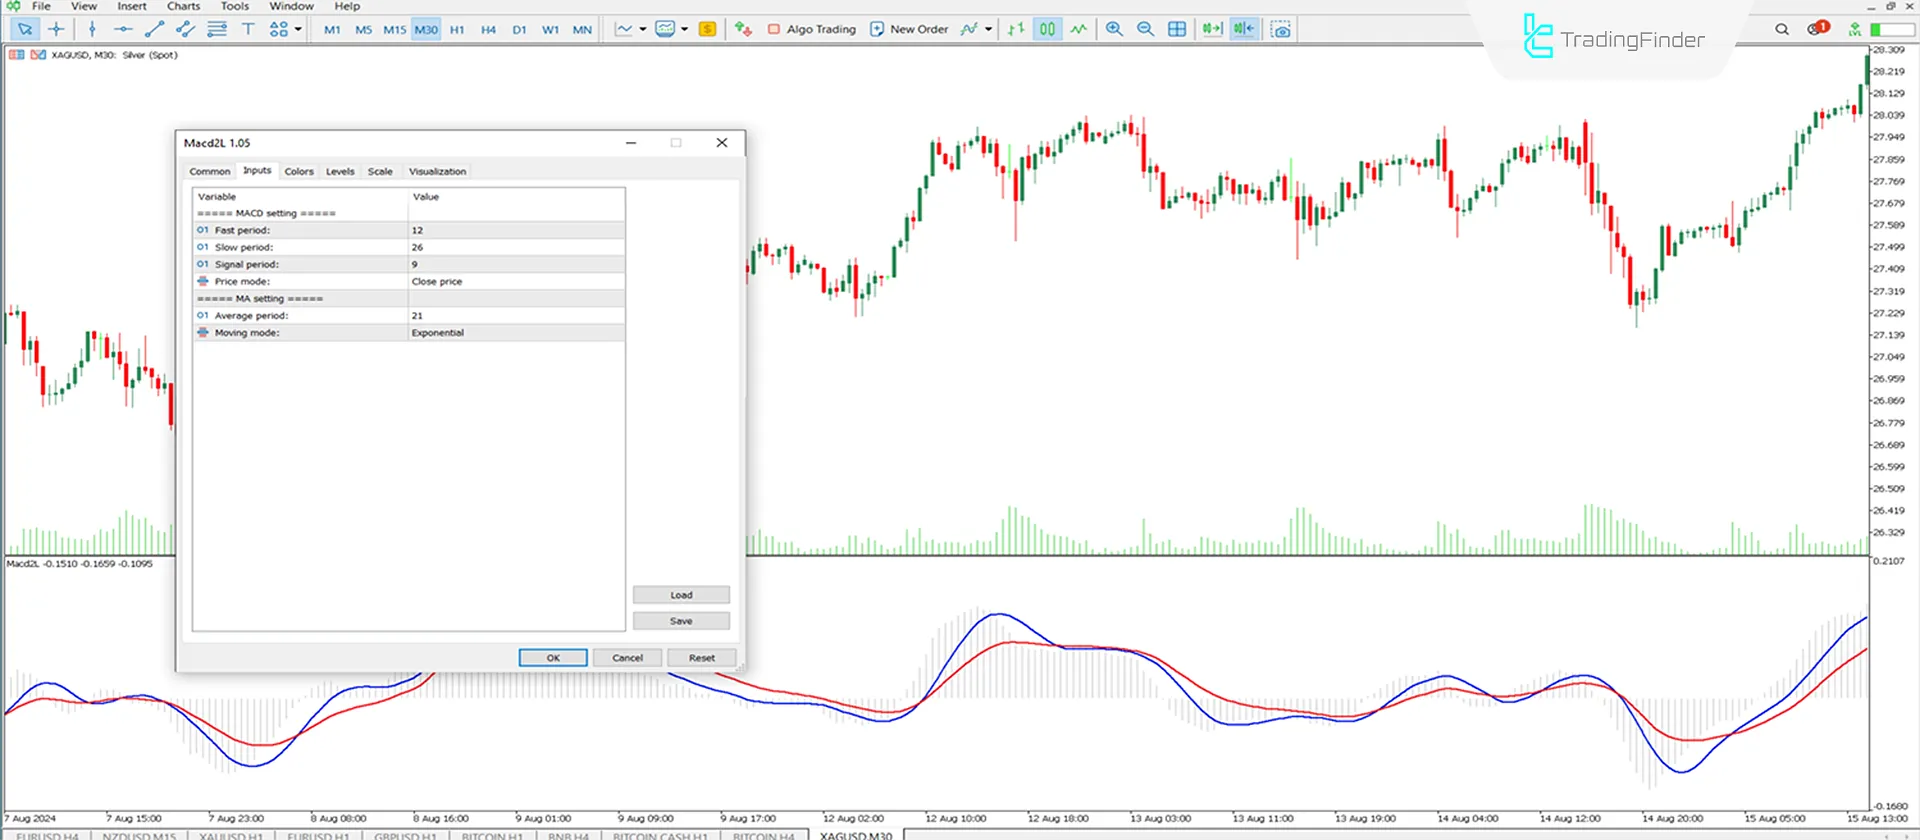
- Fast Period: The fast-moving average line is set to 12;
- Slow Period: The slow-moving average line is set to 26;
- Signal Period: The exponential moving average (EMA) is set to 9;
- Price Mode: The moving average is calculated based on the closing prices of the candles;
- Average Period: The number of candles considered for calculating the moving average is 21;
- Moving Mode: Settings related to the type of moving average.
Conclusion
The MACD 2 Line Indicator and other technical tools enhance traders' precision in trading strategy and price chart analysis.
By providing information such as moving average line crossings and overbought and oversold volume, this oscillator helps traders identify optimal entry and exit points.
MACD 2 Line Oscillator MT5 PDF
MACD 2 Line Oscillator MT5 PDF
Click to download MACD 2 Line Oscillator MT5 PDFIs the MACD 2 Line Indicator suitable for all skill levels?
This indicator is not generally complicated; however, familiarity with basic technical concepts is necessary to understand its functionality.
How can the MACD 2 Line Indicator be used in an uptrend?
The histogram shows volumes above the zero line when the fast line crosses the slow line.
Thank you for providing access to this indicator


