![MACD 4 Color Indicator for MetaTrader 5 Download - Free - [Trading Finder]](https://cdn.tradingfinder.com/image/95707/13-25-en-macd-4c-mt5-1.webp)
![MACD 4 Color Indicator for MetaTrader 5 Download - Free - [Trading Finder] 0](https://cdn.tradingfinder.com/image/95707/13-25-en-macd-4c-mt5-1.webp)
![MACD 4 Color Indicator for MetaTrader 5 Download - Free - [Trading Finder] 1](https://cdn.tradingfinder.com/image/95720/13-25-en-macd-4c-mt5-2.webp)
![MACD 4 Color Indicator for MetaTrader 5 Download - Free - [Trading Finder] 2](https://cdn.tradingfinder.com/image/95718/13-25-en-macd-4c-mt5-3.webp)
![MACD 4 Color Indicator for MetaTrader 5 Download - Free - [Trading Finder] 3](https://cdn.tradingfinder.com/image/95731/13-25-en-macd-4c-mt5-4.webp)
The MACD 4 Color Indicator (MACD 4C) is useful for detecting trend direction and strength on the MetaTrader 5 platform. This indicator is an advanced version of the MACD indicator.
The MACD 4 Color displays not only trend direction but also trend strength using four different colors based on the slope of the moving averages.
Indicator Table
The table below shows the specifications of the MACD 4 Color indicator:
Indicator Categories: | Oscillators MT5 Indicators Volatility MT5 Indicators Currency Strength MT5 Indicators |
Platforms: | MetaTrader 5 Indicators |
Trading Skills: | Elementary |
Indicator Types: | Non-Repaint MT5 Indicators |
Timeframe: | Multi-Timeframe MT5 Indicators |
Trading Style: | Swing Trading MT5 Indicators Day Trading MT5 Indicators |
Trading Instruments: | Forex MT5 Indicators Crypto MT5 Indicators Forward MT5 Indicators |
MACD 4 Color Indicator Overview
In an uptrend, the MACD 4 Color Indicator shows trend strength with light green and trend weakness with dark red.
Conversely, in a downtrend, trend strength is shown in dark red, and trend weakness in light red in the histogram. Using this oscillator alongside other trading tools gives traders a broader view of price movements and changes.
MACD 4 Color in an Uptrend
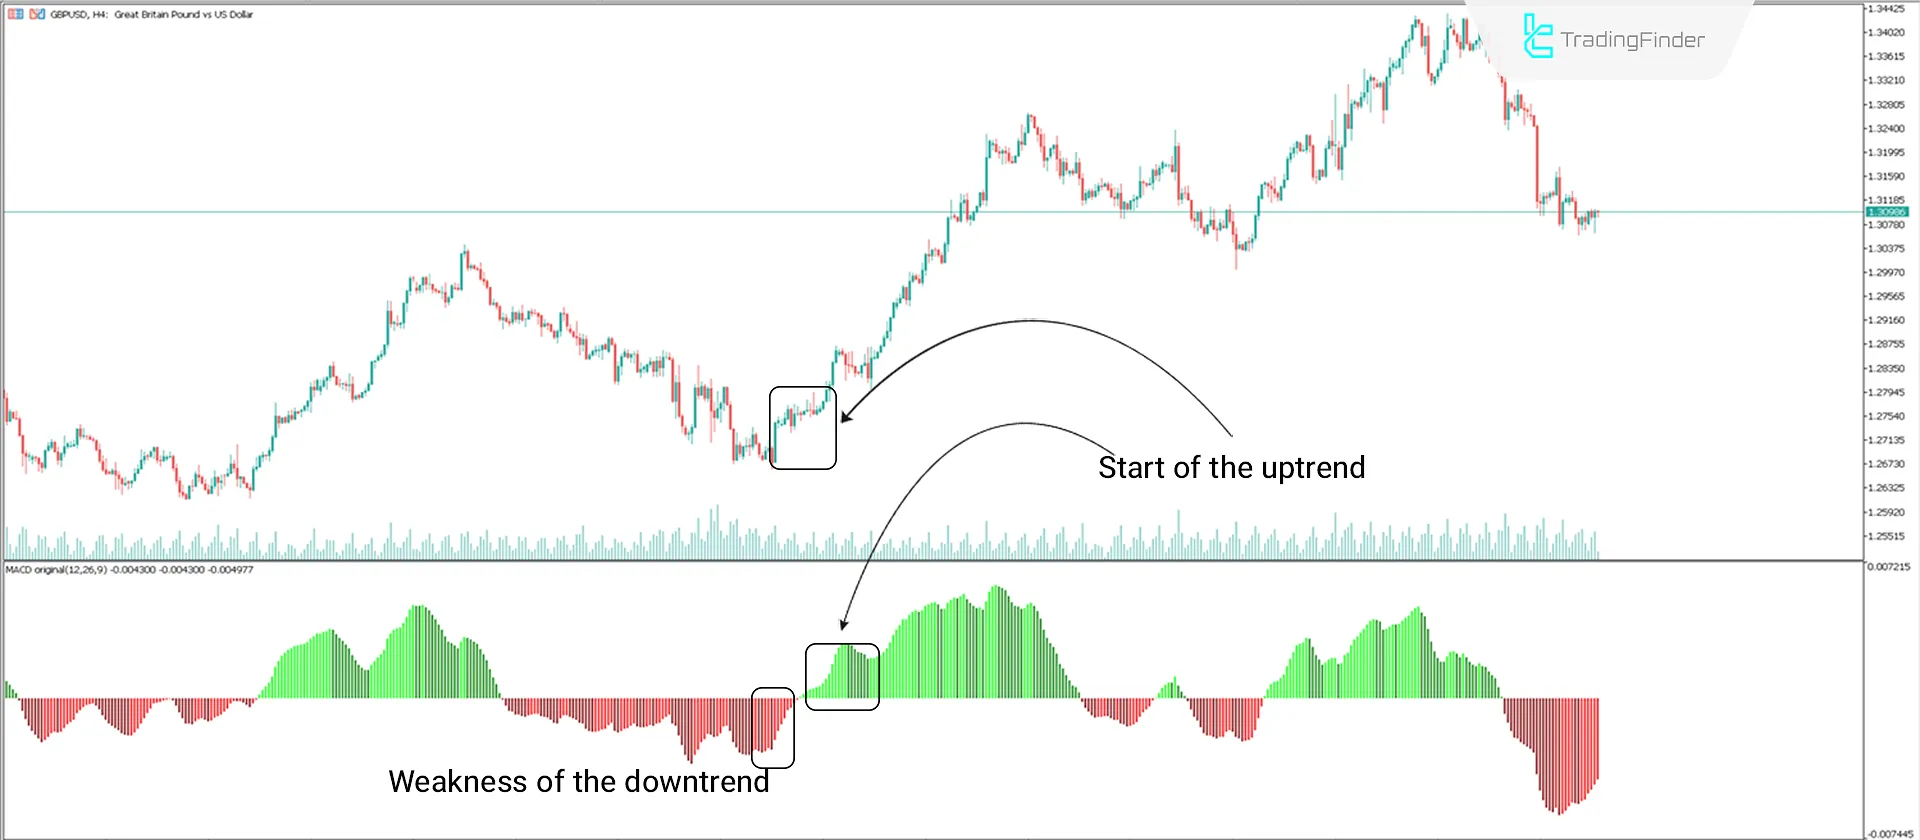
The price chart of the GBP/USD currency pair in a 4-hour time frame shows how the MACD 4 Color Indicator performs in an uptrend.
According to the image, the weakness of the downtrend is drawn in light red in the histogram, and then the indicator starts showing the uptrend in light green. After the uptrend ends, the histogram clearly shows the weakness of the uptrend in dark green.

MACD 4 Color in a Downtrend
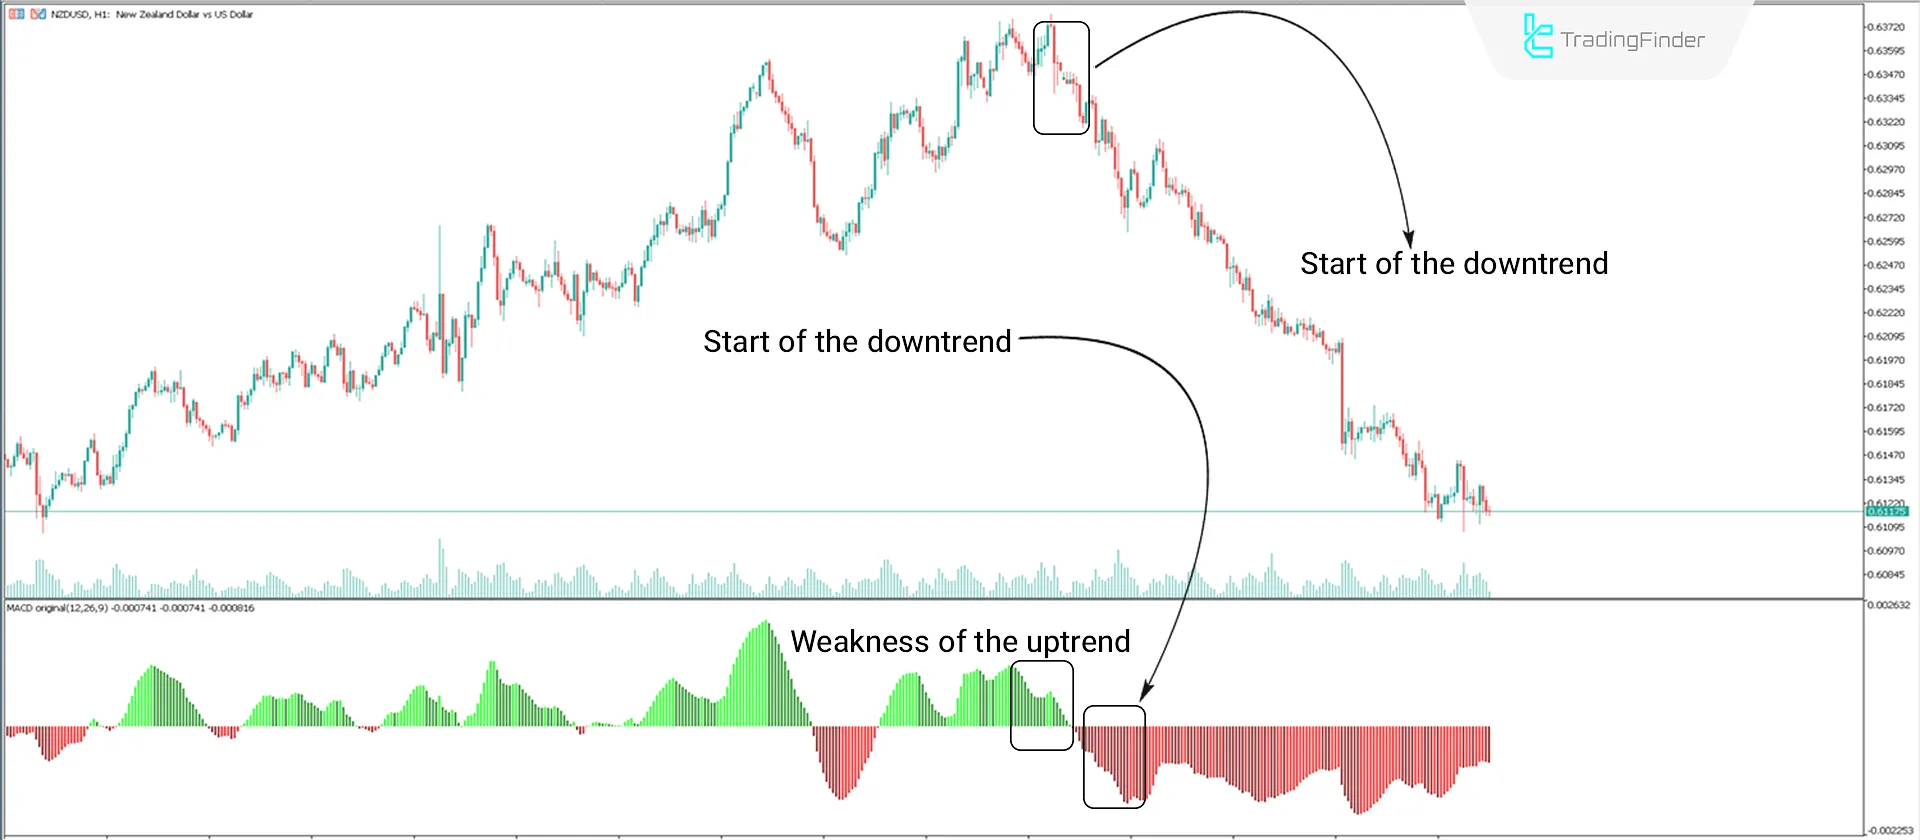
The price chart of the USD/CAD currency pair in a 1-hour time frame shows how the MACD 4 Color Indicator performs in a downtrend. According to the image, the weakness of the uptrend is drawn in dark green in the histogram, and then the indicator shows the downtrend in dark red.

Indicator Settings
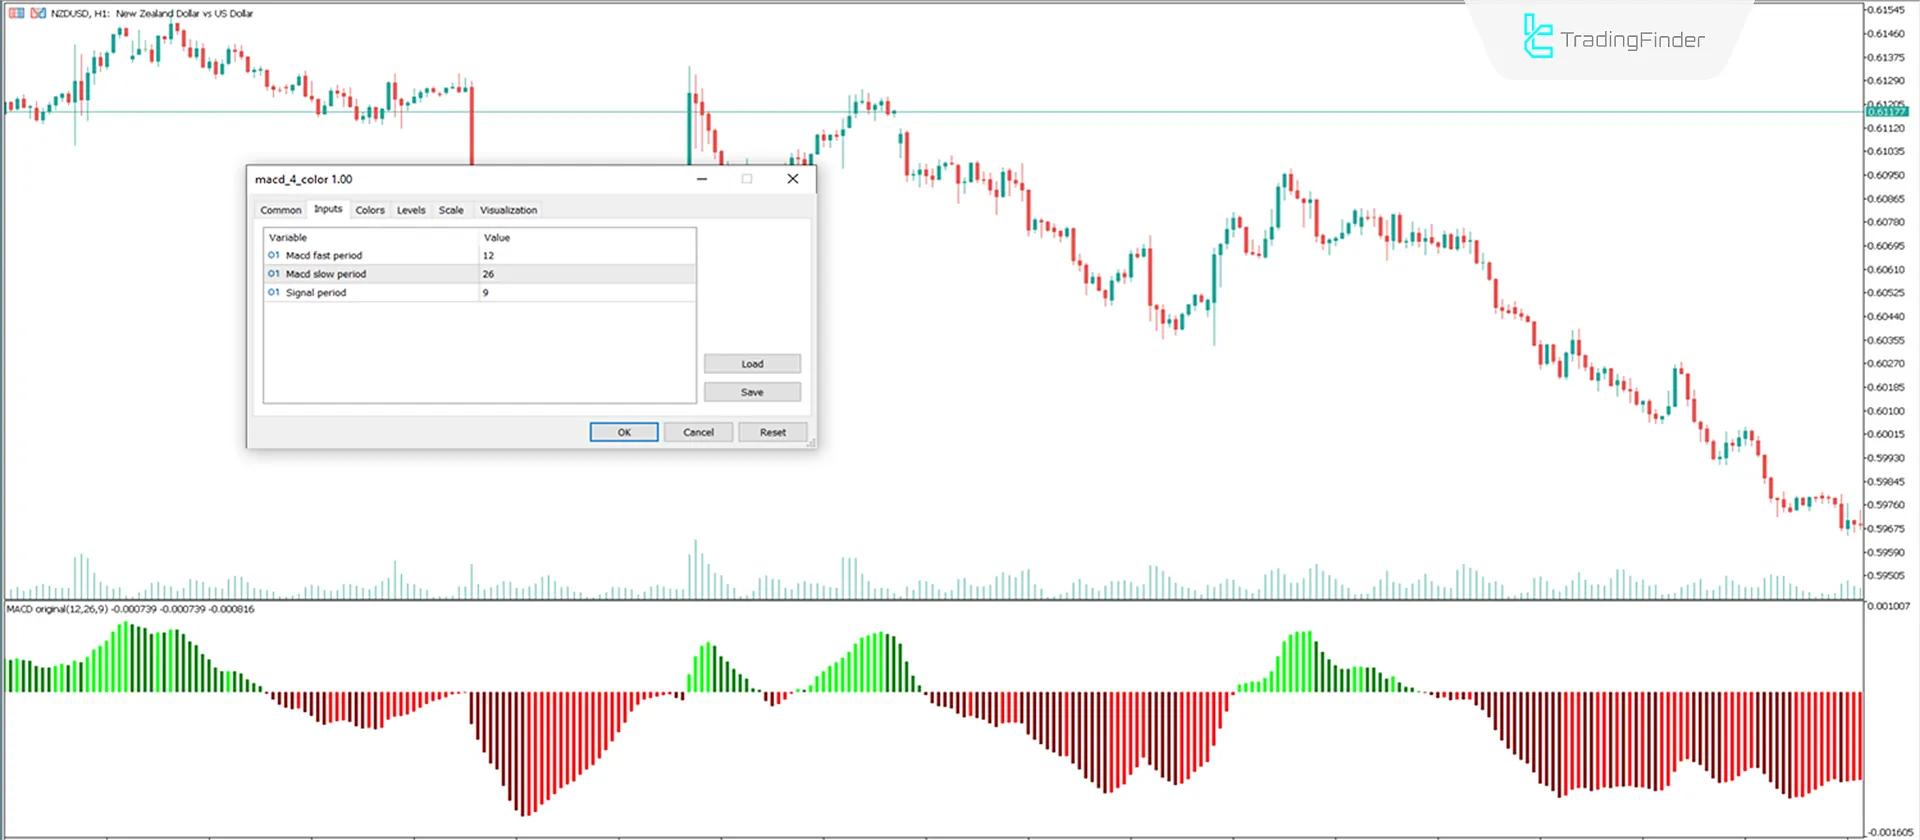
The image below shows the settings section of the MACD 4 Color indicator:

- MACD Fast Period: Exponential Moving Average fast period set to 12;
- MACD Slow Period: Exponential Moving Average slow period set to 26;
- Signal Period: Simple Moving Average signal period set to 9.
Summary
The MACD 4 Color Indicator (MACD 4C) in MetaTrader 5 effectively detects trend direction and strength. This MT5 volatility indicator is much more advanced than the standard MACD and is especially suitable for traders using convergence and divergence strategies.
With the use of 4 different colors in the histogram, the indicator clearly shows the strength of the trend. This tool can be used in all trading strategies and offers flexibility for traders.
MACD 4 Color MT5 PDF
MACD 4 Color MT5 PDF
Click to download MACD 4 Color MT5 PDFWhat is the difference between MACD 4 Color Indicator and the traditional MACD?
This indicator also shows the strength of the trend using four colors.
Which time frames is this indicator suitable for?
This indicator can be used in all time frames.
This indicator is very useful and excellent, and I thank you for creating and publishing it. There is a problem or bug in setting the color and displaying the signal line on this indicator, so that in the settings we can see the signal color and its display, but this edit is not applied and the signal line cannot be displayed.
Please contact the support team to have this issue reviewed.
Thank you In the color setting and display section of this indicator, there is no option to activate and change the color of the MACD Line and MACD Signal sections. It would be much more useful if there was an option to display and change the color.
Thank you for your feedback. Please contact the support team to have this issue reviewed.


