![MACD and Volume Indicator for MetaTrader 5 Download – Free - [TFlab]](https://cdn.tradingfinder.com/image/335501/2-13-en-macd-and-volume-mt5-1.webp)
![MACD and Volume Indicator for MetaTrader 5 Download – Free - [TFlab] 0](https://cdn.tradingfinder.com/image/335501/2-13-en-macd-and-volume-mt5-1.webp)
![MACD and Volume Indicator for MetaTrader 5 Download – Free - [TFlab] 1](https://cdn.tradingfinder.com/image/335513/2-13-en-macd-and-volume-mt5-2.webp)
![MACD and Volume Indicator for MetaTrader 5 Download – Free - [TFlab] 2](https://cdn.tradingfinder.com/image/335512/2-13-en-macd-and-volume-mt5-3.webp)
![MACD and Volume Indicator for MetaTrader 5 Download – Free - [TFlab] 3](https://cdn.tradingfinder.com/image/467419/2-13-en-macd-and-volume-mt5-4.webp)
The MACD (Moving Average Convergence Divergence) and Volume indicators combine essential technical analysis concepts. This indicator provides significant insights into trend strength or weakness and potential trend reversals by analyzing the convergence and divergence of moving averages.
MACD and Volume Indicator Specifications Table
The general specifications of the MACD and Volume Indicator are presented in the table below.
Indicator Categories: | Oscillators MT5 Indicators Volatility MT5 Indicators Currency Strength MT5 Indicators MACD Indicators for MetaTrader 5 |
Platforms: | MetaTrader 5 Indicators |
Trading Skills: | Intermediate |
Indicator Types: | Range MT5 Indicators Reversal MT5 Indicators |
Timeframe: | Multi-Timeframe MT5 Indicators |
Trading Style: | Intraday MT5 Indicators |
Trading Instruments: | Forex MT5 Indicators Crypto MT5 Indicators Stock MT5 Indicators Forward MT5 Indicators Share Stock MT5 Indicators Binary Options MT5 Indicators |
Uptrend Conditions
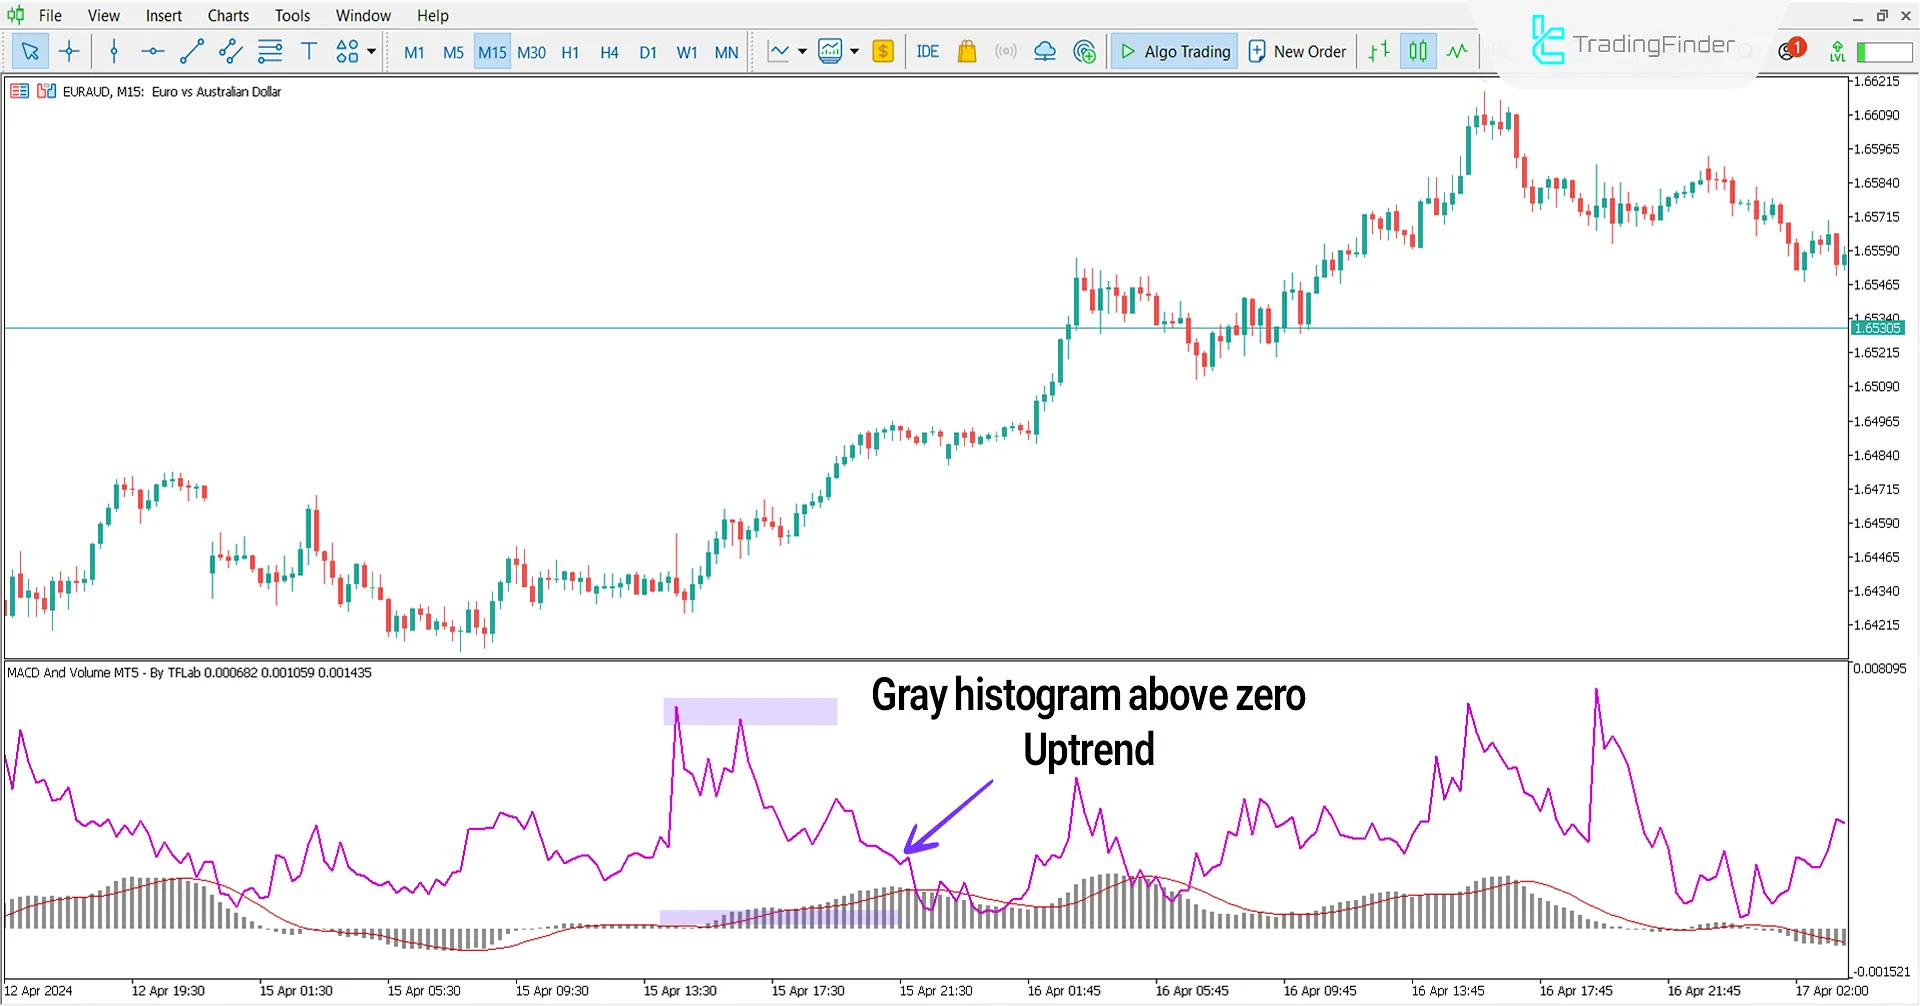
The following price chart illustrates the EUR/AUD currency pair in a 15 minute timeframe. When the histogram bars move above the zero line, and the volume oscillator also signals divergence, it indicates strong bullish momentum and can be considered a signal for Entry.

Downtrend Conditions
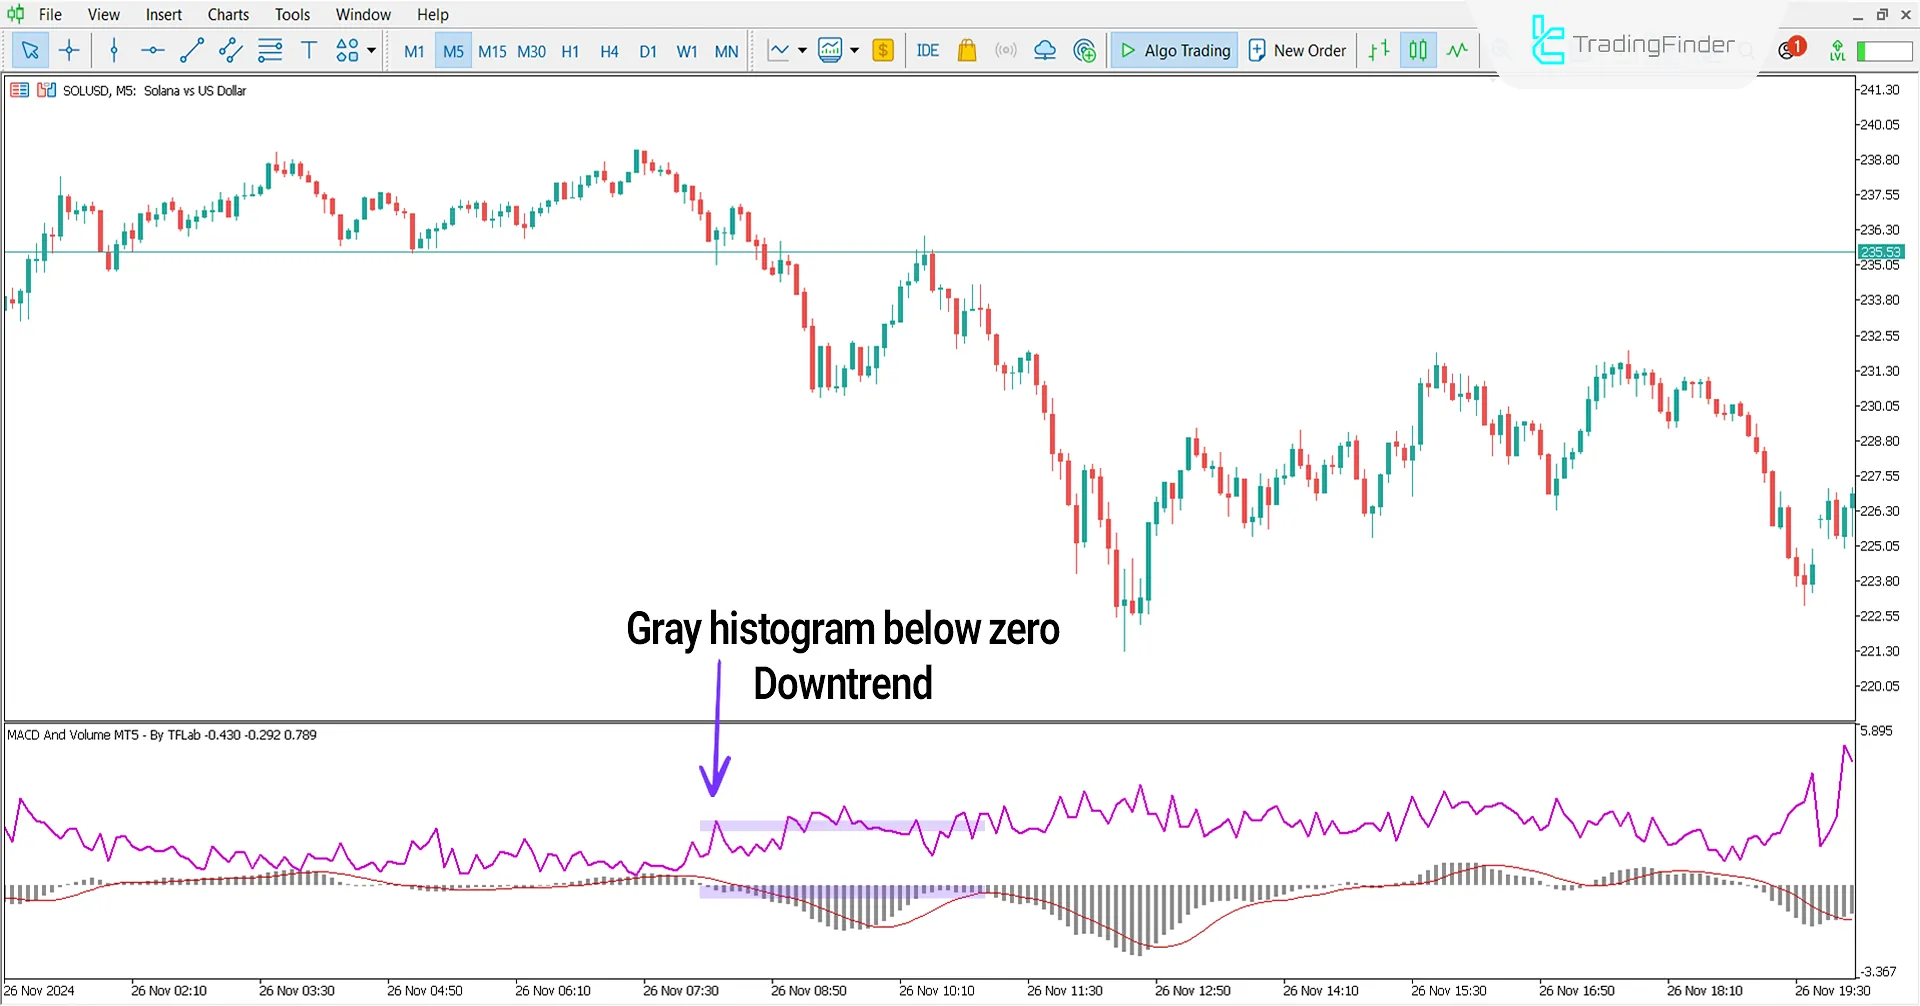
The following price chart displays Solana (SOL/USD) in a 5 minute timeframe. When the histogram bars drop below the zero line, and the volume oscillator also signals divergence, it can be taken as a signal to Sell.

Indicator Settings
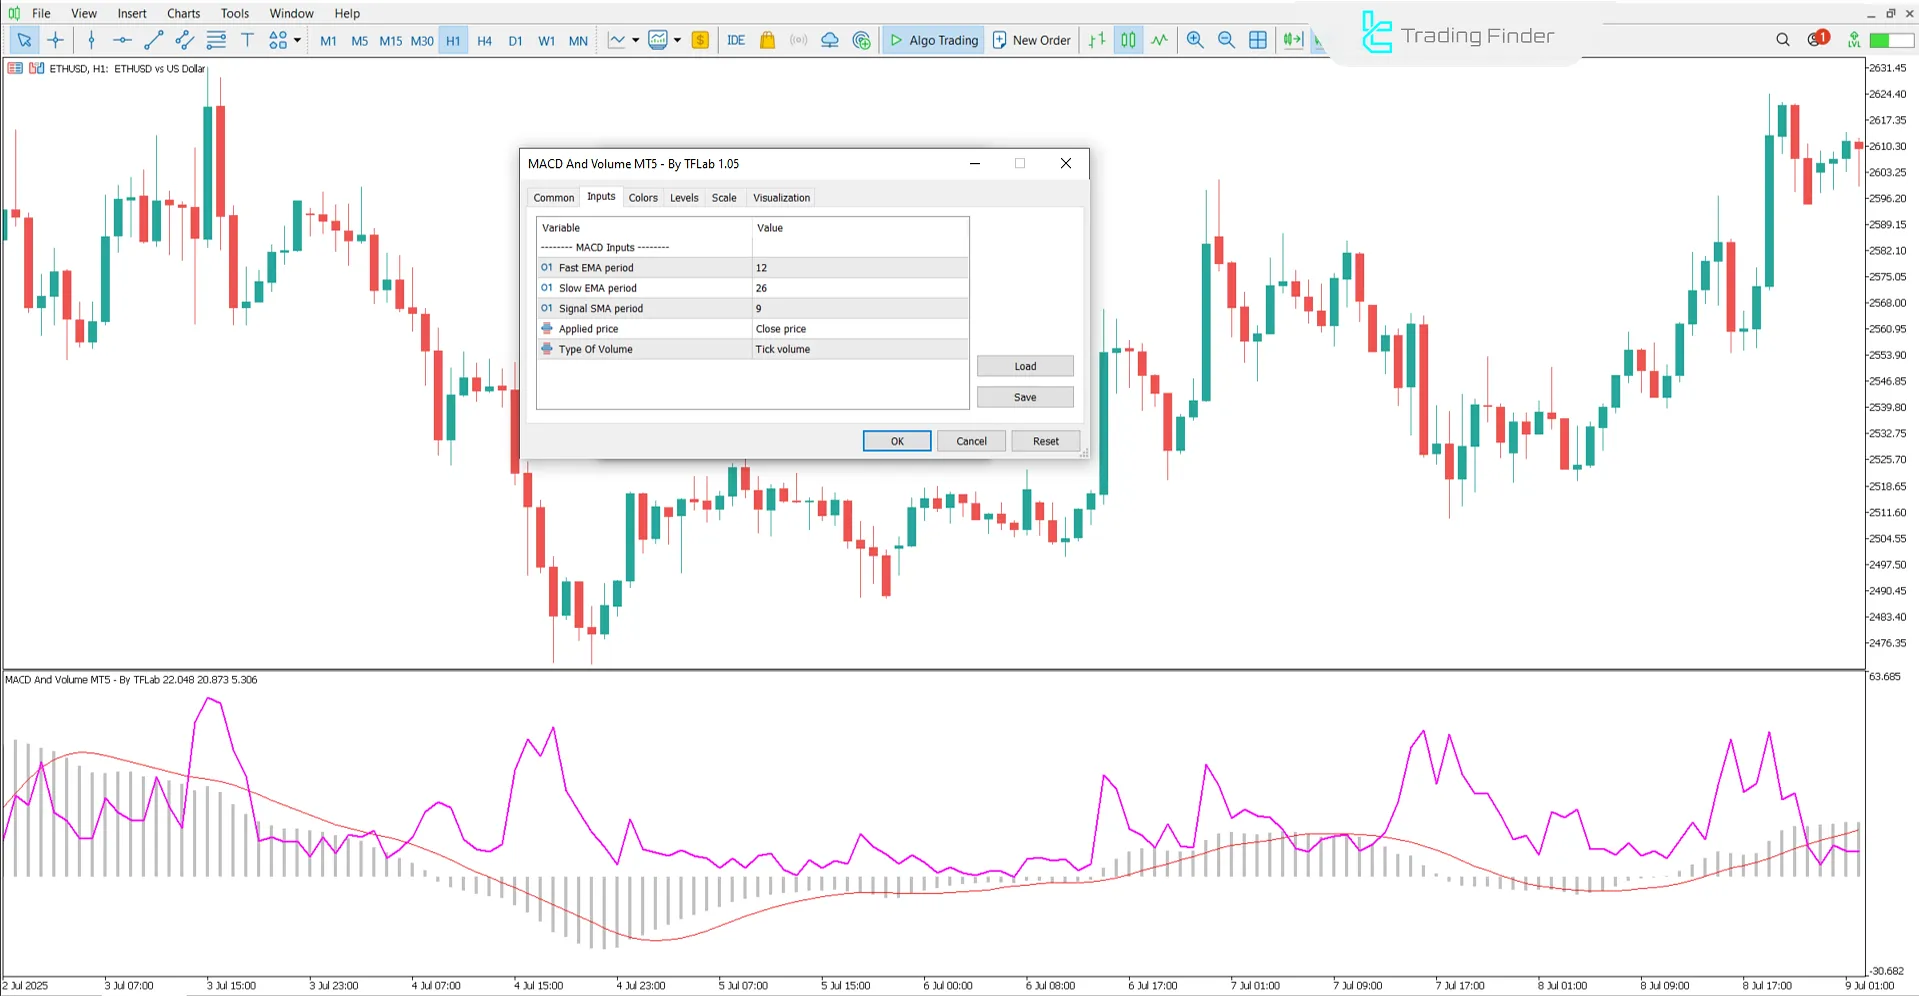
Image below shows a list of all customizable options for the MACD and Volume Indicator in MetaTrader 5 :

- Fast EMA period: Fast EMA period to 12;
- Slow EMA period: Slow EMA period to 26;
- Signal SMA period: Signal SMA period to 9;
- Applied price: Applied price;
- Type of volume: Type of volume;
- Theme: Display Theme.
Conclusion
The MACD and Volume indicators are critical tools in technical analysis. While MACD identifies price movement and trend strength, the volume component confirms trend continuation. The combination of these indicators enhances analysis accuracy and trend identification.
MACD Volume MT5 PDF
MACD Volume MT5 PDF
Click to download MACD Volume MT5 PDFDoes MACD and Volume indicator only provide entry signals?
No, this tool can also identify trend strengths, weaknesses, and changes.
What timeframes does MACD and Volume indicator support?
This indicator applies to all timeframes.


