![MACD RSI Oscillator for MT5 Download – Free – [TradingFinder]](https://cdn.tradingfinder.com/image/323725/13-97-en-macd-rsi-mt5-01.webp)
![MACD RSI Oscillator for MT5 Download – Free – [TradingFinder] 0](https://cdn.tradingfinder.com/image/323725/13-97-en-macd-rsi-mt5-01.webp)
![MACD RSI Oscillator for MT5 Download – Free – [TradingFinder] 1](https://cdn.tradingfinder.com/image/323727/13-97-en-macd-rsi-mt5-02.webp)
![MACD RSI Oscillator for MT5 Download – Free – [TradingFinder] 2](https://cdn.tradingfinder.com/image/323726/13-97-en-macd-rsi-mt5-03.webp)
![MACD RSI Oscillator for MT5 Download – Free – [TradingFinder] 3](https://cdn.tradingfinder.com/image/323724/13-97-en-macd-rsi-mt5-04.webp)
The MACD and Relative Strength indicator is a combined oscillator based on the two concepts of MACD and the Relative Strength Index (RSI) in technical analysis. This trading tool is designed to detect divergences and provide trend based trading signals.
Using histogram volume changes and crossovers between Fast EMA and Slow EMA, the MACD RSI indicator helps identify optimal trade entry and exit points.
MACD and Relative Strength Indicator Specifications Table
The table below outlines the technical specifications of the MACD and RSI Indicators:
Indicator Categories: | Oscillators MT5 Indicators Volatility MT5 Indicators Currency Strength MT5 Indicators MACD Indicators for MetaTrader 5 RSI Indicators for MetaTrader 5 |
Platforms: | MetaTrader 5 Indicators |
Trading Skills: | Intermediate |
Indicator Types: | Reversal MT5 Indicators |
Timeframe: | Multi-Timeframe MT5 Indicators |
Trading Style: | Day Trading MT5 Indicators |
Trading Instruments: | Forex MT5 Indicators Crypto MT5 Indicators Stock MT5 Indicators Indices MT5 Indicators Forward MT5 Indicators Share Stock MT5 Indicators Binary Options MT5 Indicators |
MACD and Relative Strength Indicator at a Glance
The MACD tool analyzes the convergence and divergence of moving averages. In contrast, the Relative Strength Index (RSI) primarily identifies overbought and oversold zones.
Combining these two tools into one indicator simplifies market evaluation and facilitates identifying trading opportunities.
Key signals generated by this hybrid include histogram formations in the positive or negative zone and crossovers between exponential moving averages (EMA).
Buy Position
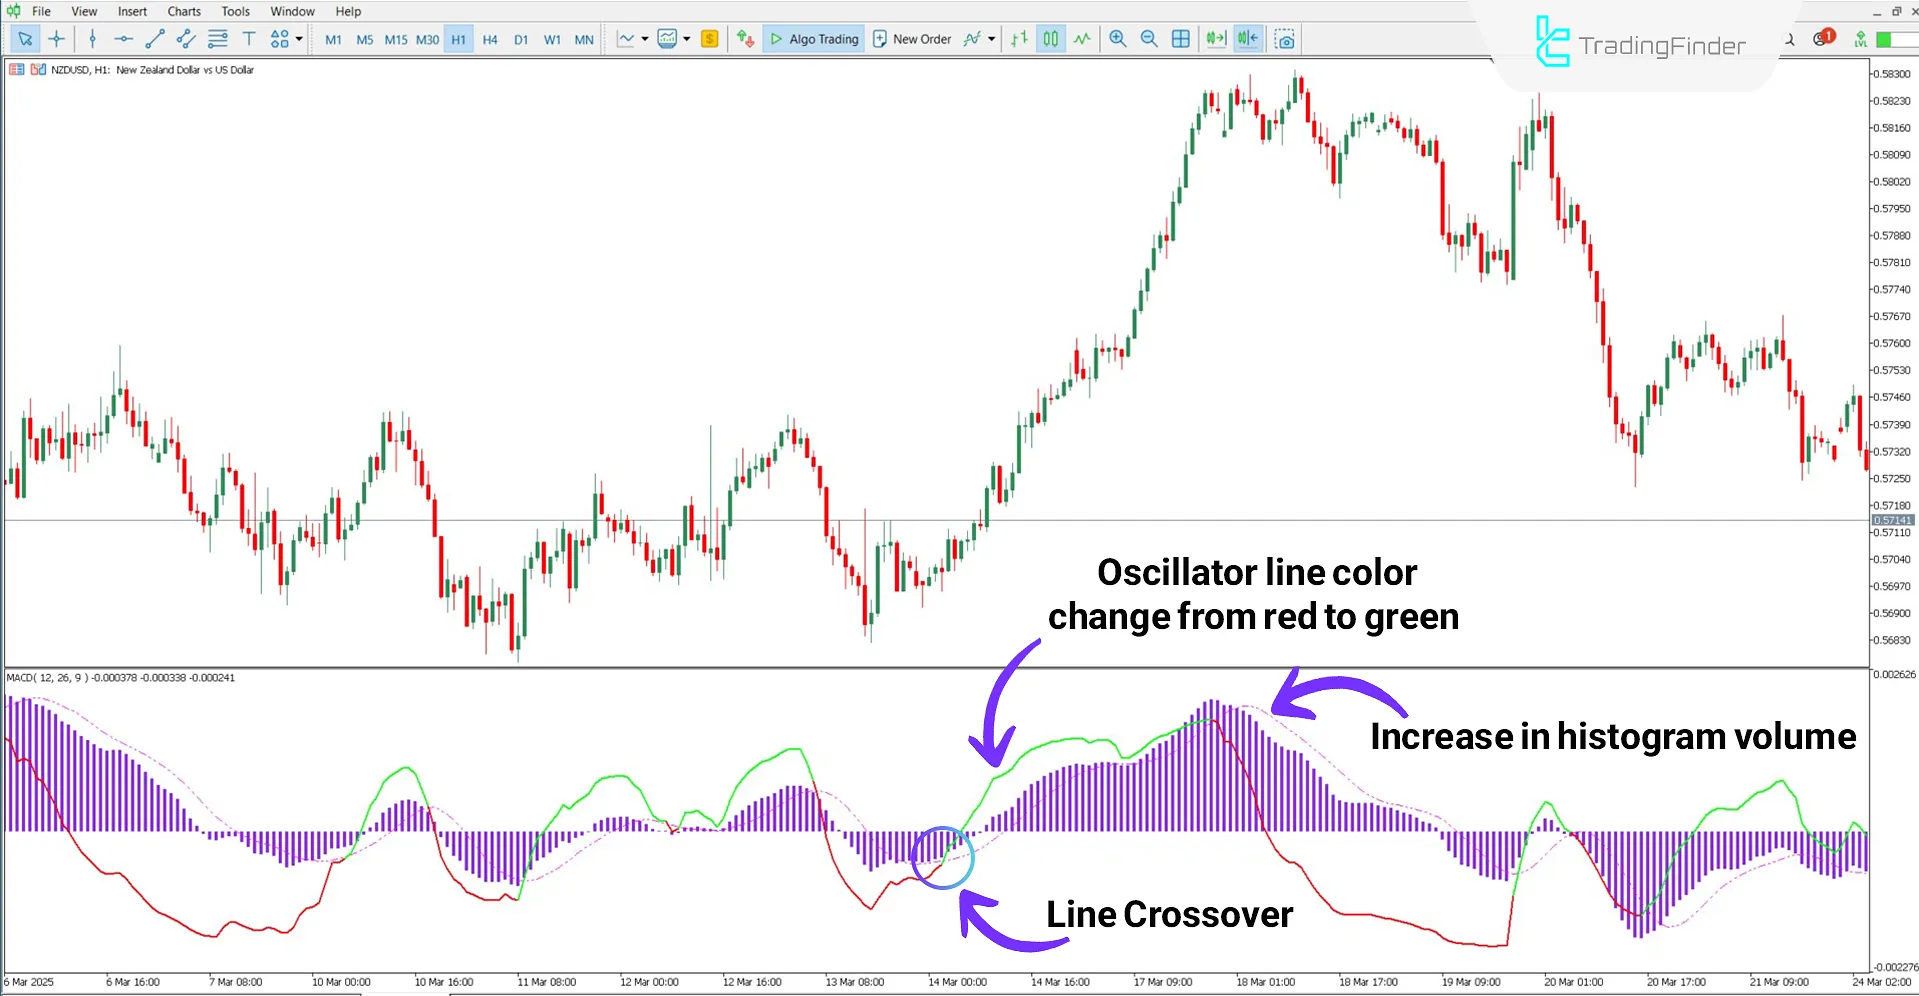
On the 1-hour chart of NZD/USD, the red line crosses above the pink dashed line and turns green. Simultaneously, histogram volume gradually decreases in the negative zone and increases in the positive zone.
Under such conditions, following the line crossover, the histogram’s phase transition from negative to positive is considered a favorable entry point for a buy trade.

Sell Position
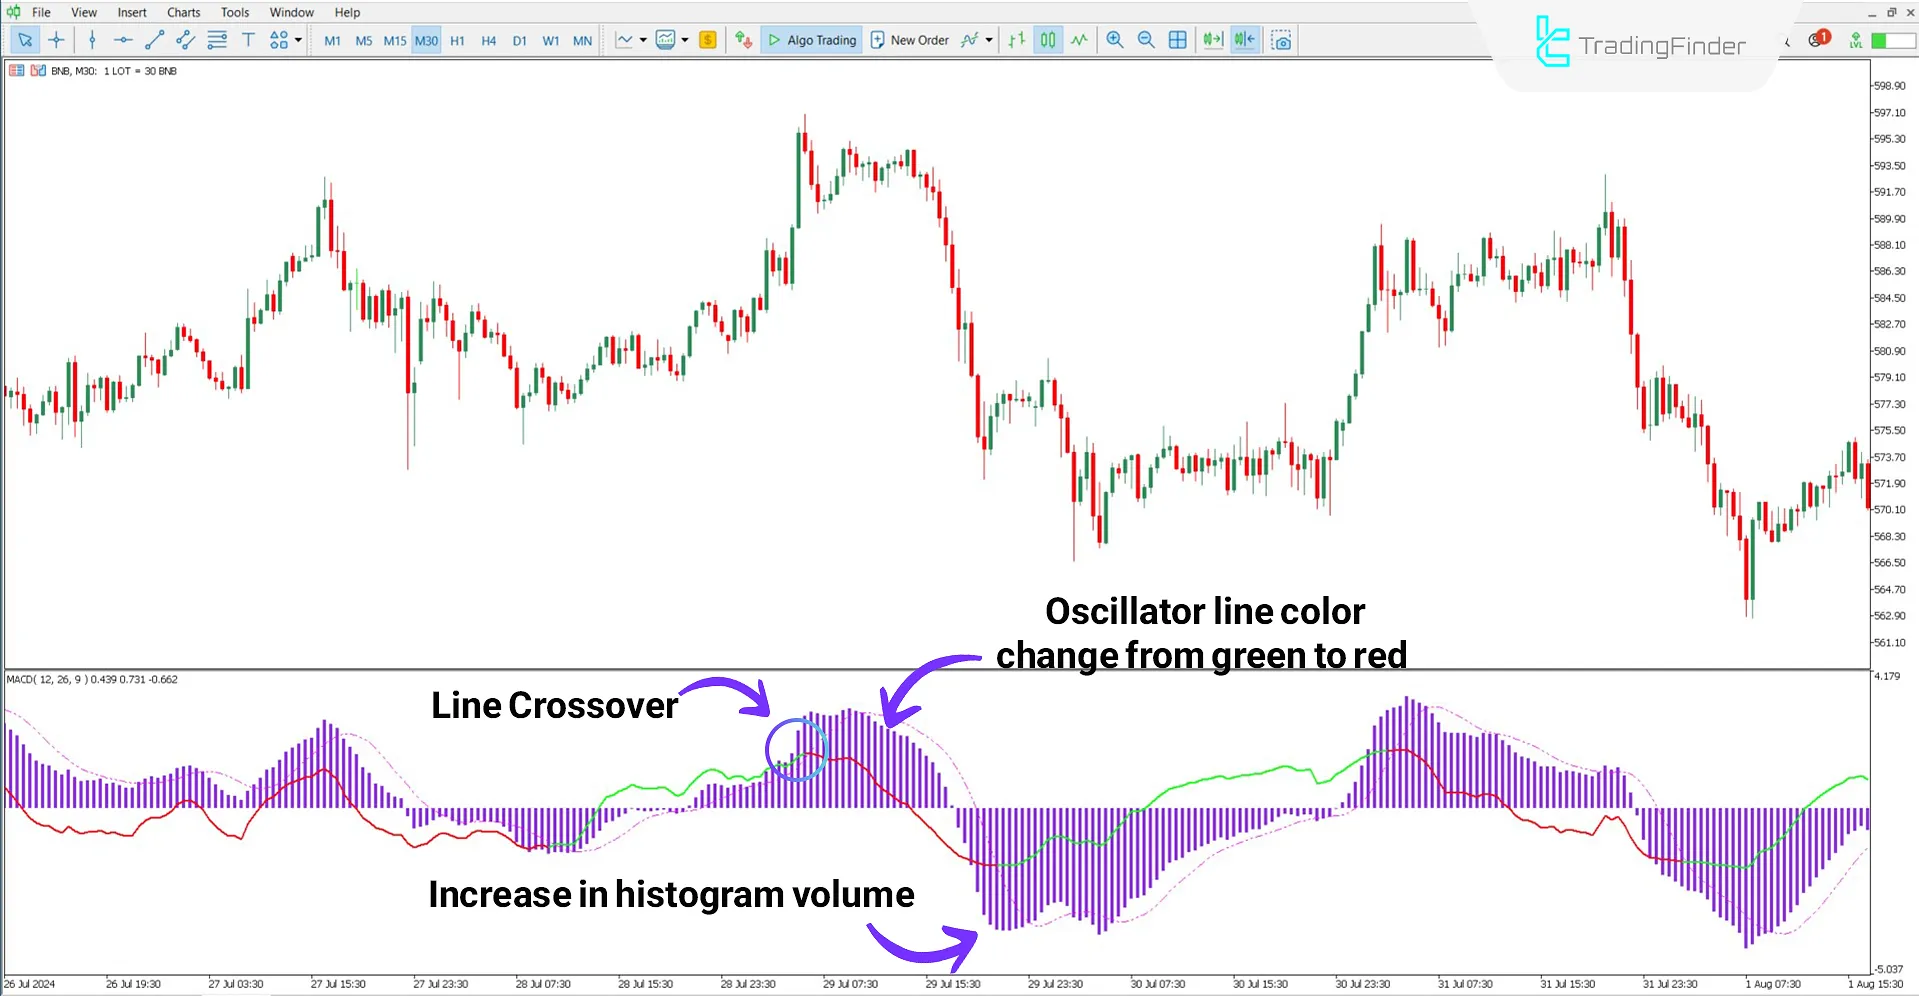
According to the 30-minute Binance Coin (BNB) chart, the green line crosses below the pink dashed line, turning red, indicating a trend reversal signal.
Additionally, the histogram shift from the positive to the negative zone confirms the beginning of a bearish move and reinforces the possibility of a continued downtrend.

MACD and RSI Indicator Settings
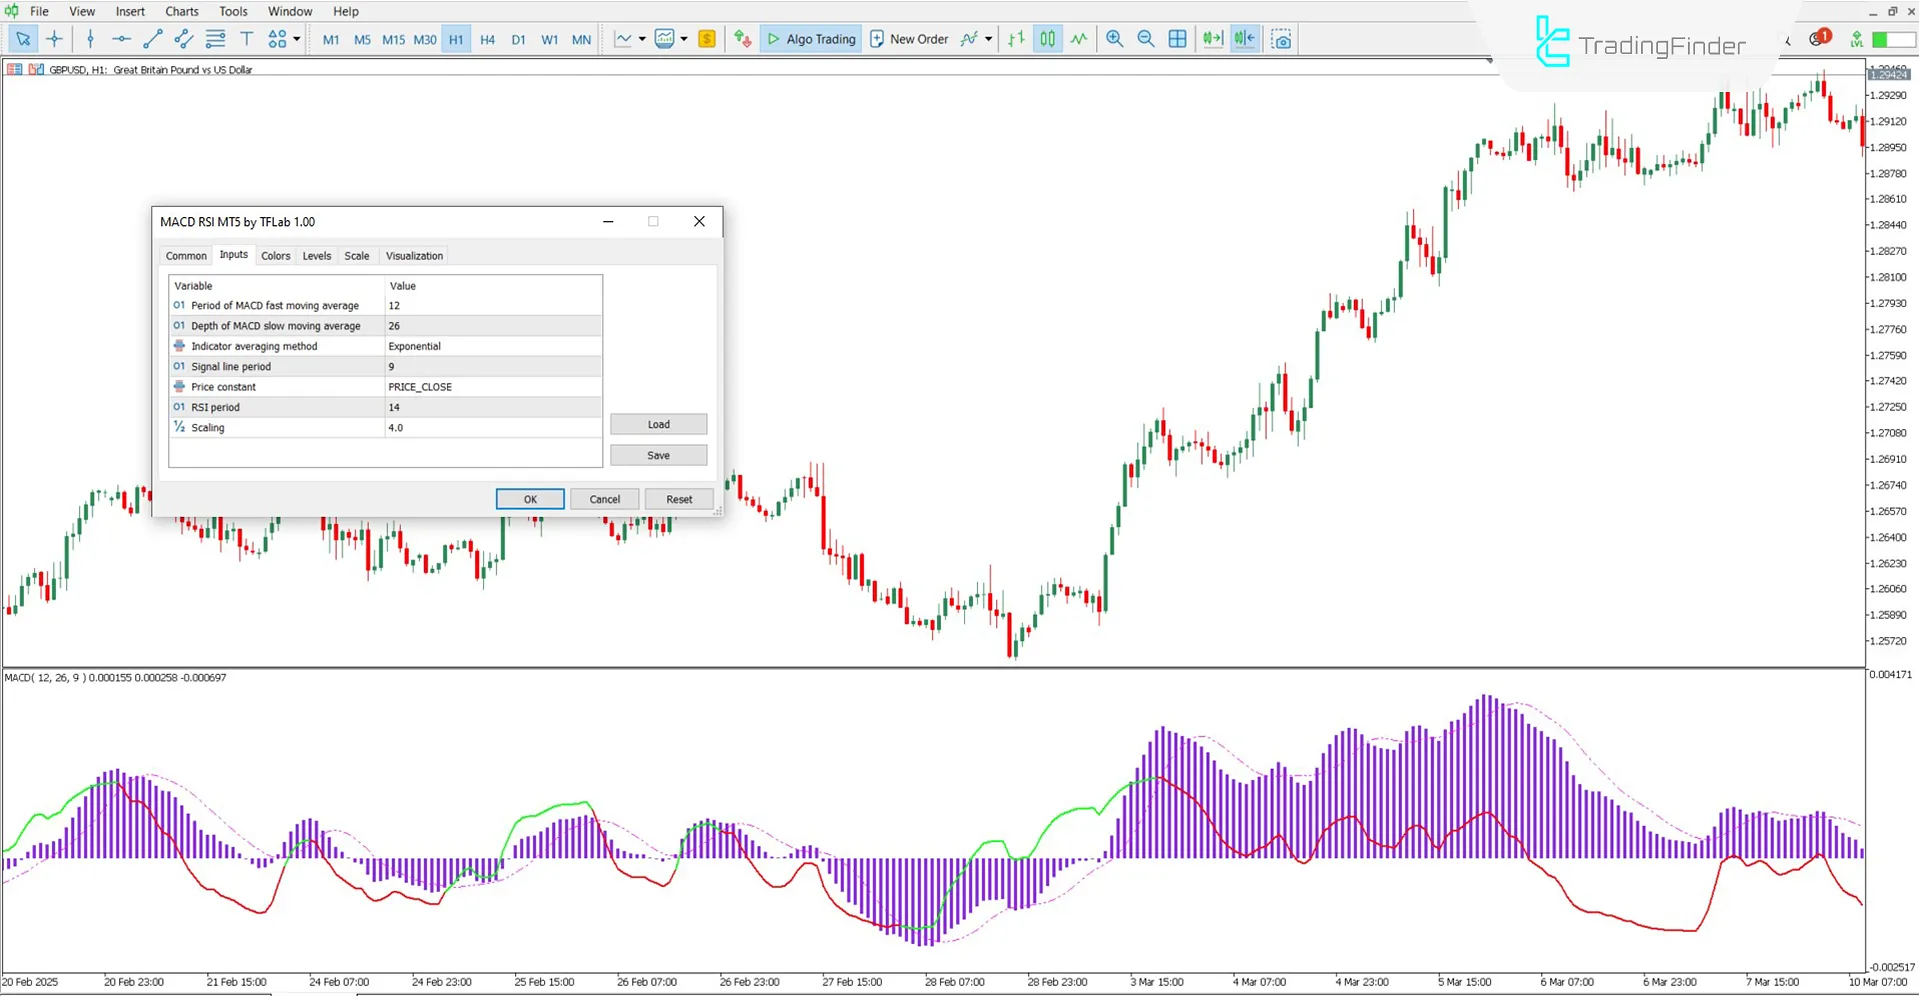
The image below presents the adjustable settings in the MACD and RSI indicators:

- Fast EMA: Period for calculating the fast exponential moving average
- Slow EMA: Period for calculating the slow exponential moving average
- Signal SMA: Period for calculating the signal line (simple moving average)
- RSI Period: Calculation period for the RSI
- Caliber: Defines the delay level for divergence signal detection
Conclusion
The MACD RSI indicator combines the analytical power of both MACD and RSI, allowing precise detection of potential price reversals and trade entry setups.
Unlike traditional models, this MT5 volatility indicator calculates the RSI values and then applies the MACD algorithm. This approach provides a smoother and more intuitive representation of Forex market momentum.
MACD RSI Oscillator MT5 PDF
MACD RSI Oscillator MT5 PDF
Click to download MACD RSI Oscillator MT5 PDFWhich timeframe is suitable for the MACD and RSI Indicators?
This is a multi-time frame indicator and can be used across all timeframes.
What is the advantage of combining MACD and RSI?
The combination offers a more comprehensive view of market trends, momentum, and potential price reversal zones.


