![MACD Tape Oscillator for MT5 Download – Free – [TradingFinder]](https://cdn.tradingfinder.com/image/511181/13-193-en-macd-tape-mt5-01.webp)
![MACD Tape Oscillator for MT5 Download – Free – [TradingFinder] 0](https://cdn.tradingfinder.com/image/511181/13-193-en-macd-tape-mt5-01.webp)
![MACD Tape Oscillator for MT5 Download – Free – [TradingFinder] 1](https://cdn.tradingfinder.com/image/511179/13-193-en-macd-tape-mt5-02.webp)
![MACD Tape Oscillator for MT5 Download – Free – [TradingFinder] 2](https://cdn.tradingfinder.com/image/511182/13-193-en-macd-tape-mt5-03.webp)
![MACD Tape Oscillator for MT5 Download – Free – [TradingFinder] 3](https://cdn.tradingfinder.com/image/511180/13-193-en-macd-tape-mt5-04.webp)
The MACD Tape indicator is designed to display the strength of the trend and the direction of market momentum through the color changes of histograms.
The shift in bar colors from blue to red or orange indicates a change in buying and selling pressure and a possible trend reversal.
Specifications Table of the MACD Tape Oscillator
The specifications of the MACD Tape indicator are as follows:
Indicator Categories: | Oscillators MT5 Indicators Signal & Forecast MT5 Indicators Momentum Indicators in MT5 |
Platforms: | MetaTrader 5 Indicators |
Trading Skills: | Elementary |
Indicator Types: | Reversal MT5 Indicators |
Timeframe: | Multi-Timeframe MT5 Indicators |
Trading Style: | Swing Trading MT5 Indicators Scalper MT5 Indicators Day Trading MT5 Indicators |
Trading Instruments: | Forex MT5 Indicators Crypto MT5 Indicators Stock MT5 Indicators Commodity MT5 Indicators Indices MT5 Indicators Share Stock MT5 Indicators |
MACD Tape Indicator at a Glance
The MACD Tape oscillator identifies the moment of crossover between the MACD line and the signal line as an entry or exit point, and marks it with colored arrows on the chart.
A blue arrow indicates a potential buy position, while a yellow arrow serves as a sell warning.
Buy Signal
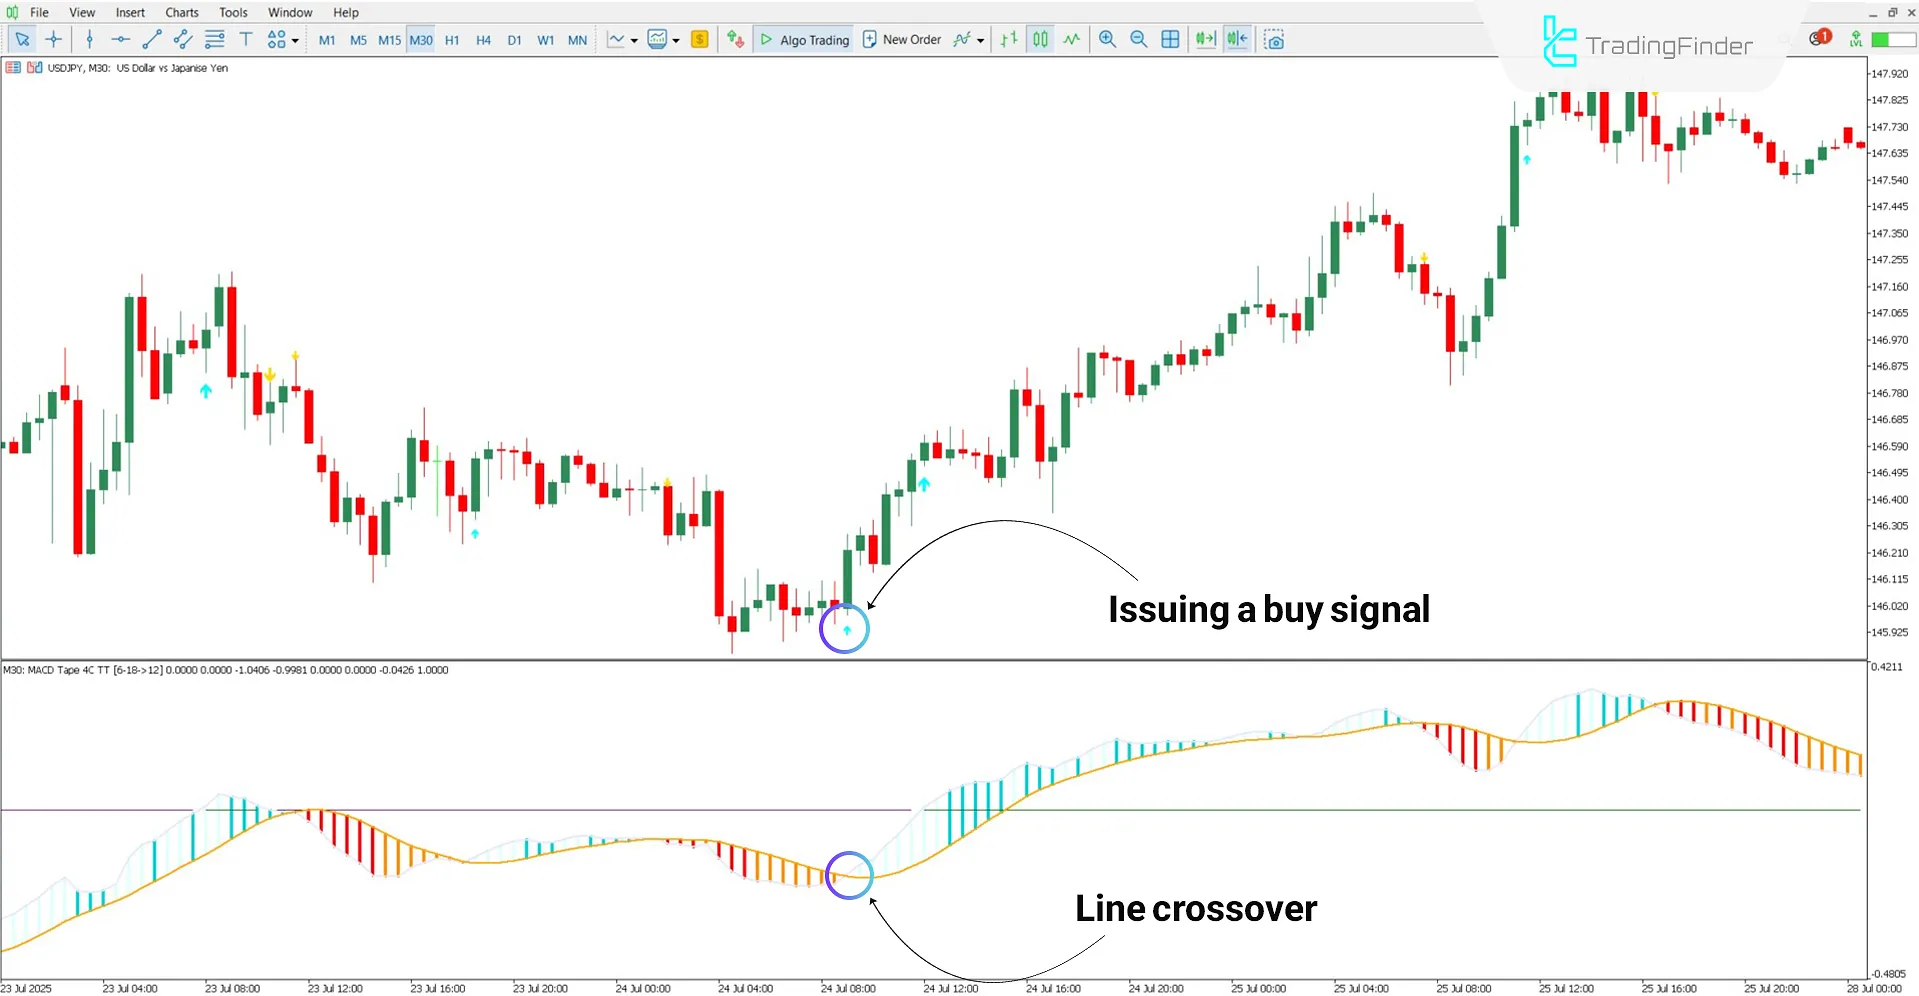
In the example of the USD/JPY currency pair on the 30-minute timeframe, the "MACD Tape" indicator successfully identified a bullish crossover between the MACD line and the signal line, and at an appropriate point, issued a buy signal.
Following this signal, the appearance of consecutive light blue histograms indicated increased positive momentum and strengthening of the upward trend.

Sell Signal
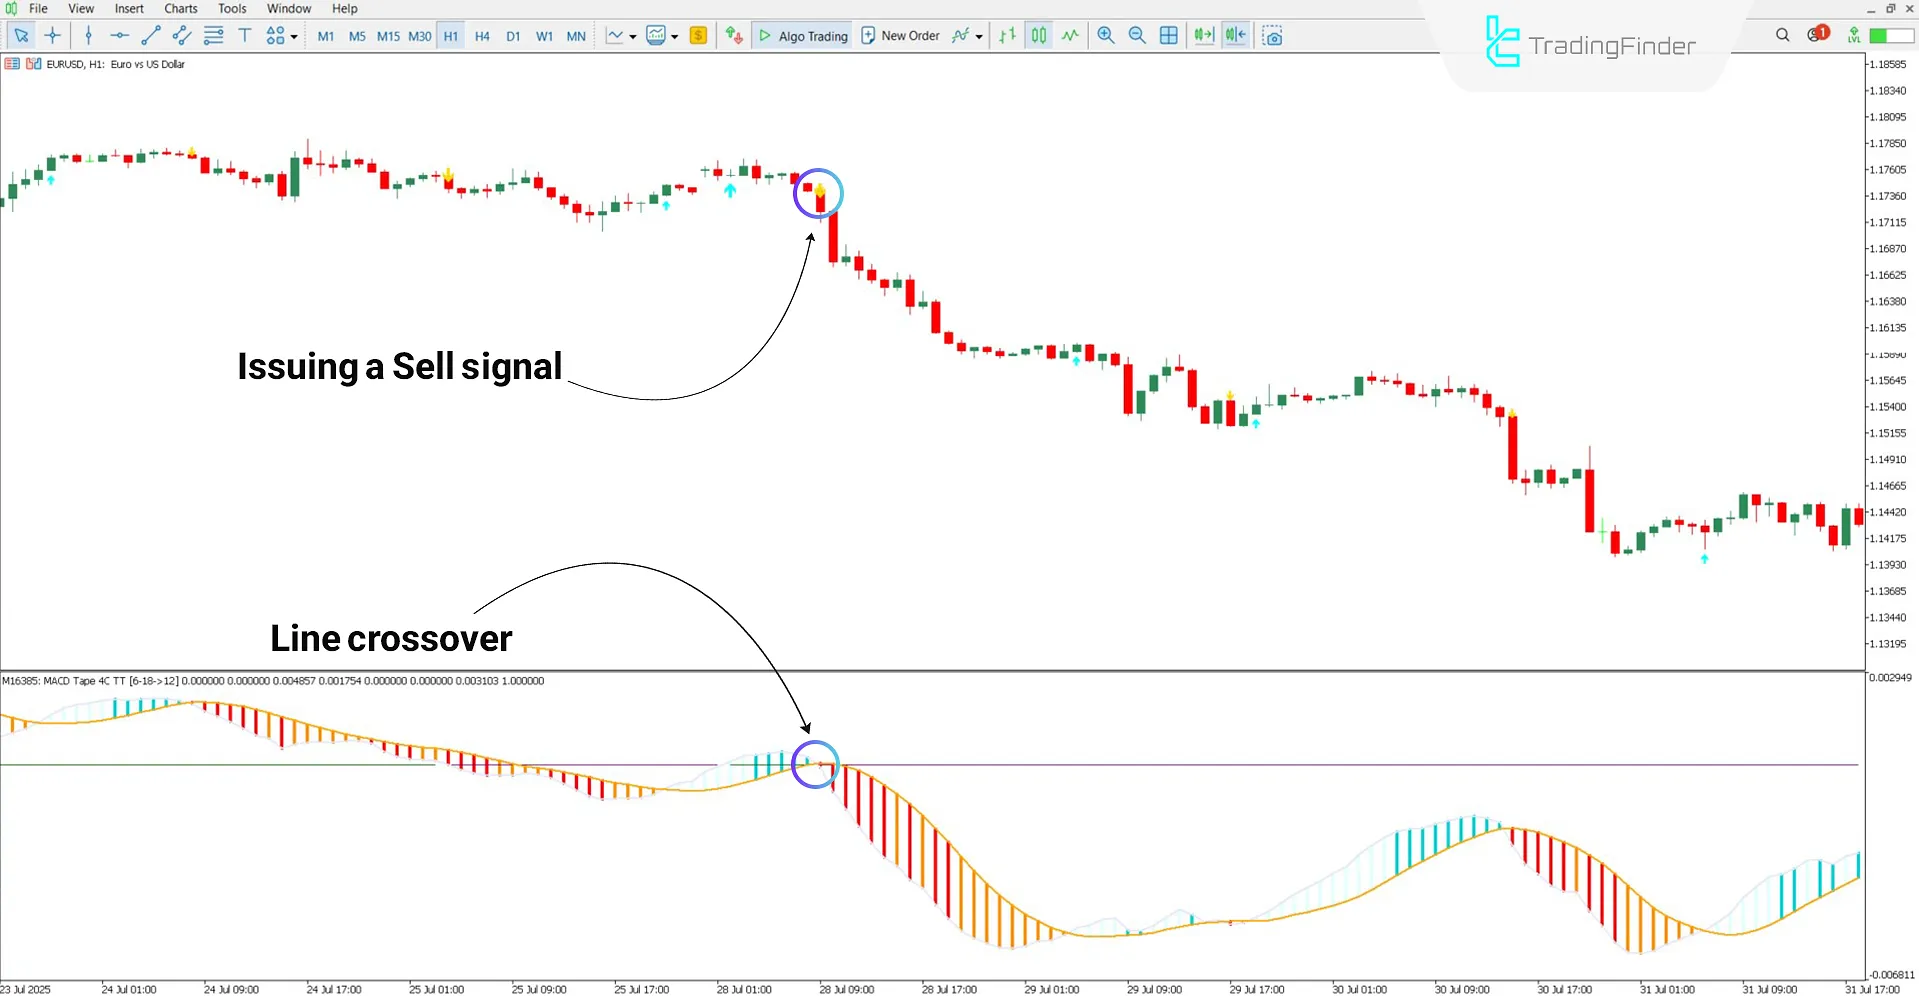
According to the 1-hour EUR/USD currency pair chart, after identifying a bearish crossover between the MACD line and the signal line, the indicator issued a sell signal with a yellow arrow.
At the same time as this signal, the appearance of red and orange histograms following the price movement indicated an increase in selling pressure and the strength of the bearish trend.

MACD Tape Indicator Settings
The settings of the MACD Tape oscillator are as follows:

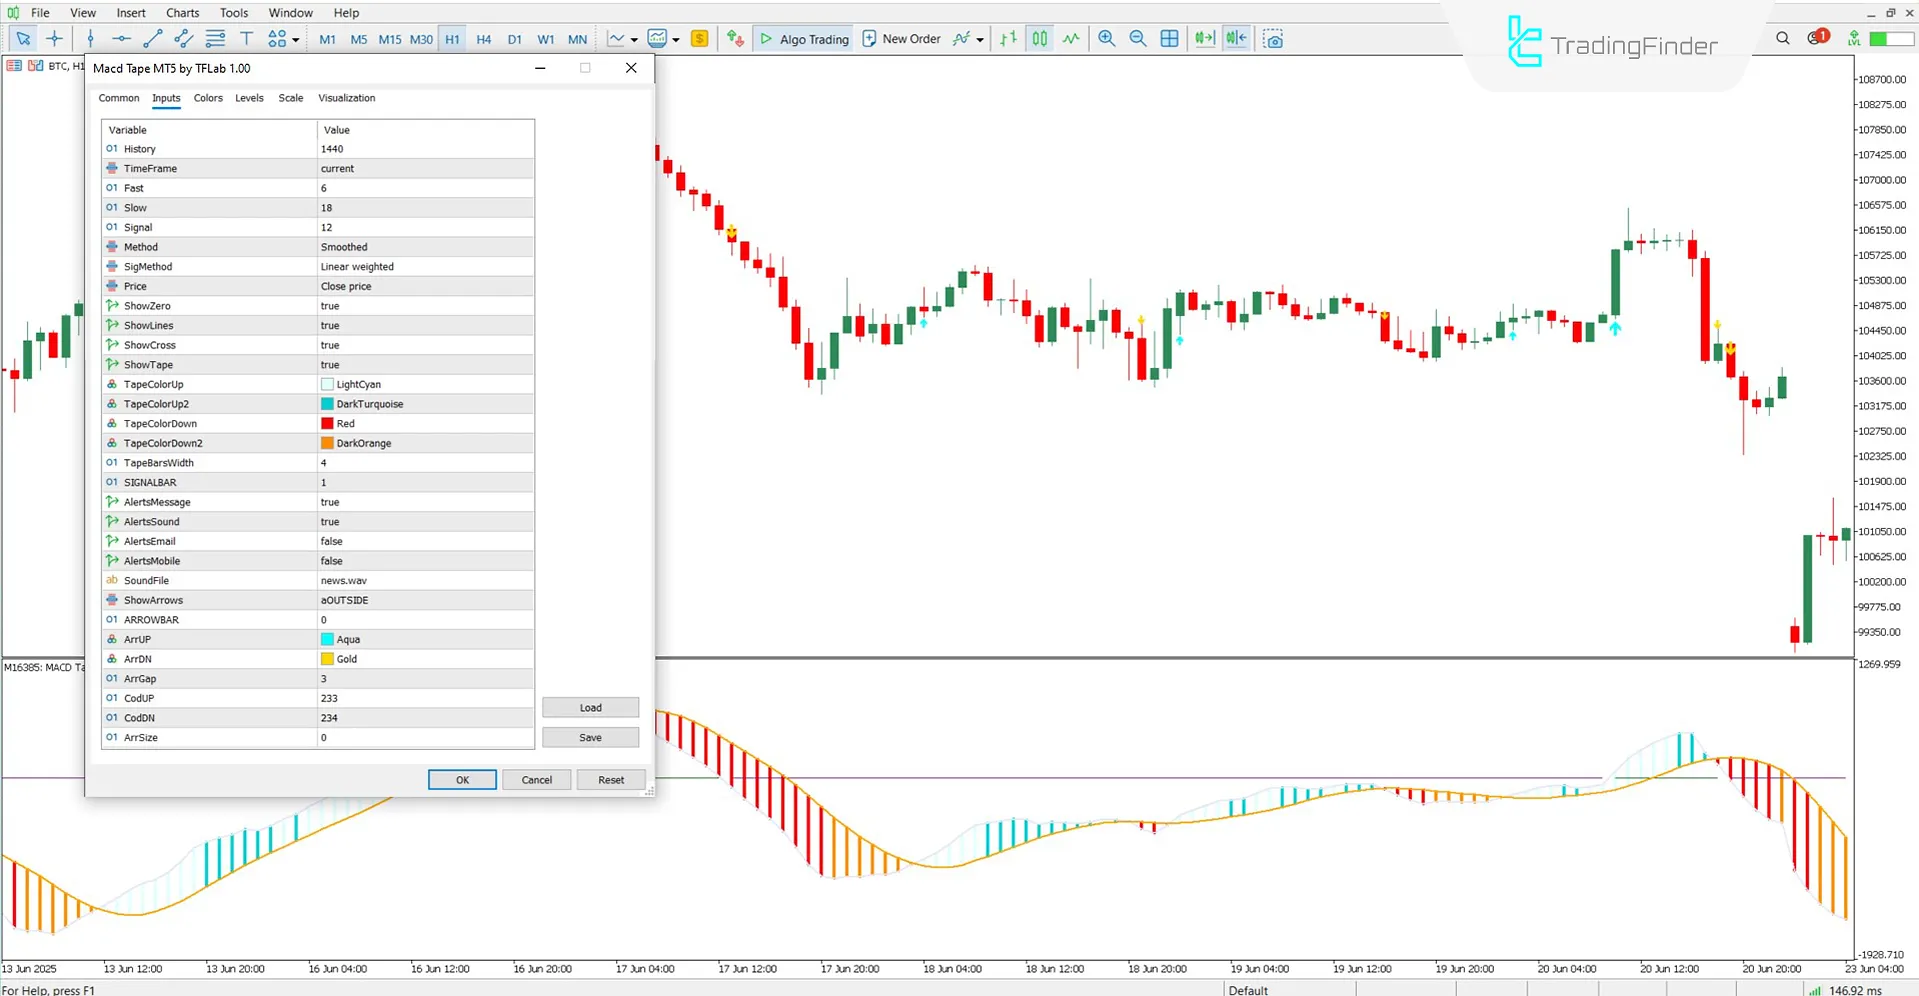
- History: Number of candles analyzed by the indicator
- TimeFrame: Current chart timeframe
- Fast: Period of fast-moving average
- Slow: Period of the slow-moving average
- Signal: Calculation period of the signal line
- Method: Type of averaging for MACD calculation
- SigMethod: Type of averaging for the signal line
- Price: Price type for calculations
- ShowZero: Zero line in oscillator
- ShowLines: Reference lines in histogram
- ShowCross: MACD line crossover with signal line
- ShowTape: Histogram color bands
- TapeColorUp: Initial bullish histogram color
- TapeColorUp2: Strong bullish histogram color
- TapeColorDown: Initial bearish bar color
- TapeColorDown2: Strong bearish bar color
- TapeBarsWidth: Histogram bar width
- SIGNALBAR: Reference candle for signal generation
- AlertsMessage: Text alerts
- AlertsSound: Sound alerts
- AlertsEmail: Email alert
- AlertsMobile: Mobile alerts
- SoundFile: Audio file for alerts
- ShowArrows: Signal arrow position outside candle
- ARROWBAR: Reference candle for signal arrow drawing
- ArrUP: Buy arrow color
- ArrDN: Sell arrow color
- ArrGap: Vertical distance between arrow and candle
- CodUP: Buy arrow symbol code
- CodDN: Sell arrow symbol code
- ArrSize: Signaling arrow size
Conclusion
The MACD Tape oscillator is a practical tool in technical analysis that displays market momentum changes through colored histograms.
This indicator provides alerts in the form of colored arrows by analyzing the crossover between the MACD line and the signal line.
MACD Tape Oscillator for MT5 PDF
MACD Tape Oscillator for MT5 PDF
Click to download MACD Tape Oscillator for MT5 PDFIs the MACD Tape indicator capable of providing trading signals?
Yes, this tool issues trading signals visually based on line crossovers and momentum.
Can this indicator be used in smaller timeframes?
Yes, the MACD Tape oscillator is multi-timeframe and can be applied across all time intervals.


