![Machine Learning Momentum Index Indicator MT5 Download – Free – [TradingFinder]](https://cdn.tradingfinder.com/image/610802/13-253-en-machine-learning-momentum-index-mt5-01.webp)
![Machine Learning Momentum Index Indicator MT5 Download – Free – [TradingFinder] 0](https://cdn.tradingfinder.com/image/610802/13-253-en-machine-learning-momentum-index-mt5-01.webp)
![Machine Learning Momentum Index Indicator MT5 Download – Free – [TradingFinder] 1](https://cdn.tradingfinder.com/image/610784/13-253-en-machine-learning-momentum-index-mt5-02.webp)
![Machine Learning Momentum Index Indicator MT5 Download – Free – [TradingFinder] 2](https://cdn.tradingfinder.com/image/610801/13-253-en-machine-learning-momentum-index-mt5-03.webp)
![Machine Learning Momentum Index Indicator MT5 Download – Free – [TradingFinder] 3](https://cdn.tradingfinder.com/image/610783/13-253-en-machine-learning-momentum-index-mt5-04.webp)
The Machine Learning Momentum Index Indicator is an advanced version of traditional momentum analysis that examines price data using artificial intelligence algorithms.
By combining Weighted Moving Averages (WMA) and the Relative Strength Index (RSI), this indicator evaluates the speed and intensity of price movements across various timeframes.
Its computational structure utilizes the K-NN algorithm to analyze historical data, identify repeating patterns, and more accurately forecast the probable direction of future trends.
Machine Learning Momentum Index Indicator Specification Table
The specifications of the Machine Learning Momentum Index indicator are presented in the table below:
Indicator Categories: | Momentum Indicators in MT5 Machine Learning Indicators for MetaTrader 5 |
Platforms: | MetaTrader 5 Indicators |
Trading Skills: | Intermediate |
Indicator Types: | Overbought & Oversold MT5 Indicators Reversal MT5 Indicators |
Timeframe: | Multi-Timeframe MT5 Indicators |
Trading Style: | Swing Trading MT5 Indicators Intraday MT5 Indicators Scalper MT5 Indicators |
Trading Instruments: | Forex MT5 Indicators Crypto MT5 Indicators Stock MT5 Indicators Commodity MT5 Indicators Indices MT5 Indicators Share Stock MT5 Indicators |
Indicator at a Glance
The Machine Learning Momentum Index Indicator identifies overbought and oversold zones using two oscillating lines, each displayed in a different color.
The trading signals of this tool are calculated by comparing fast and slow moving averages based on RSI.
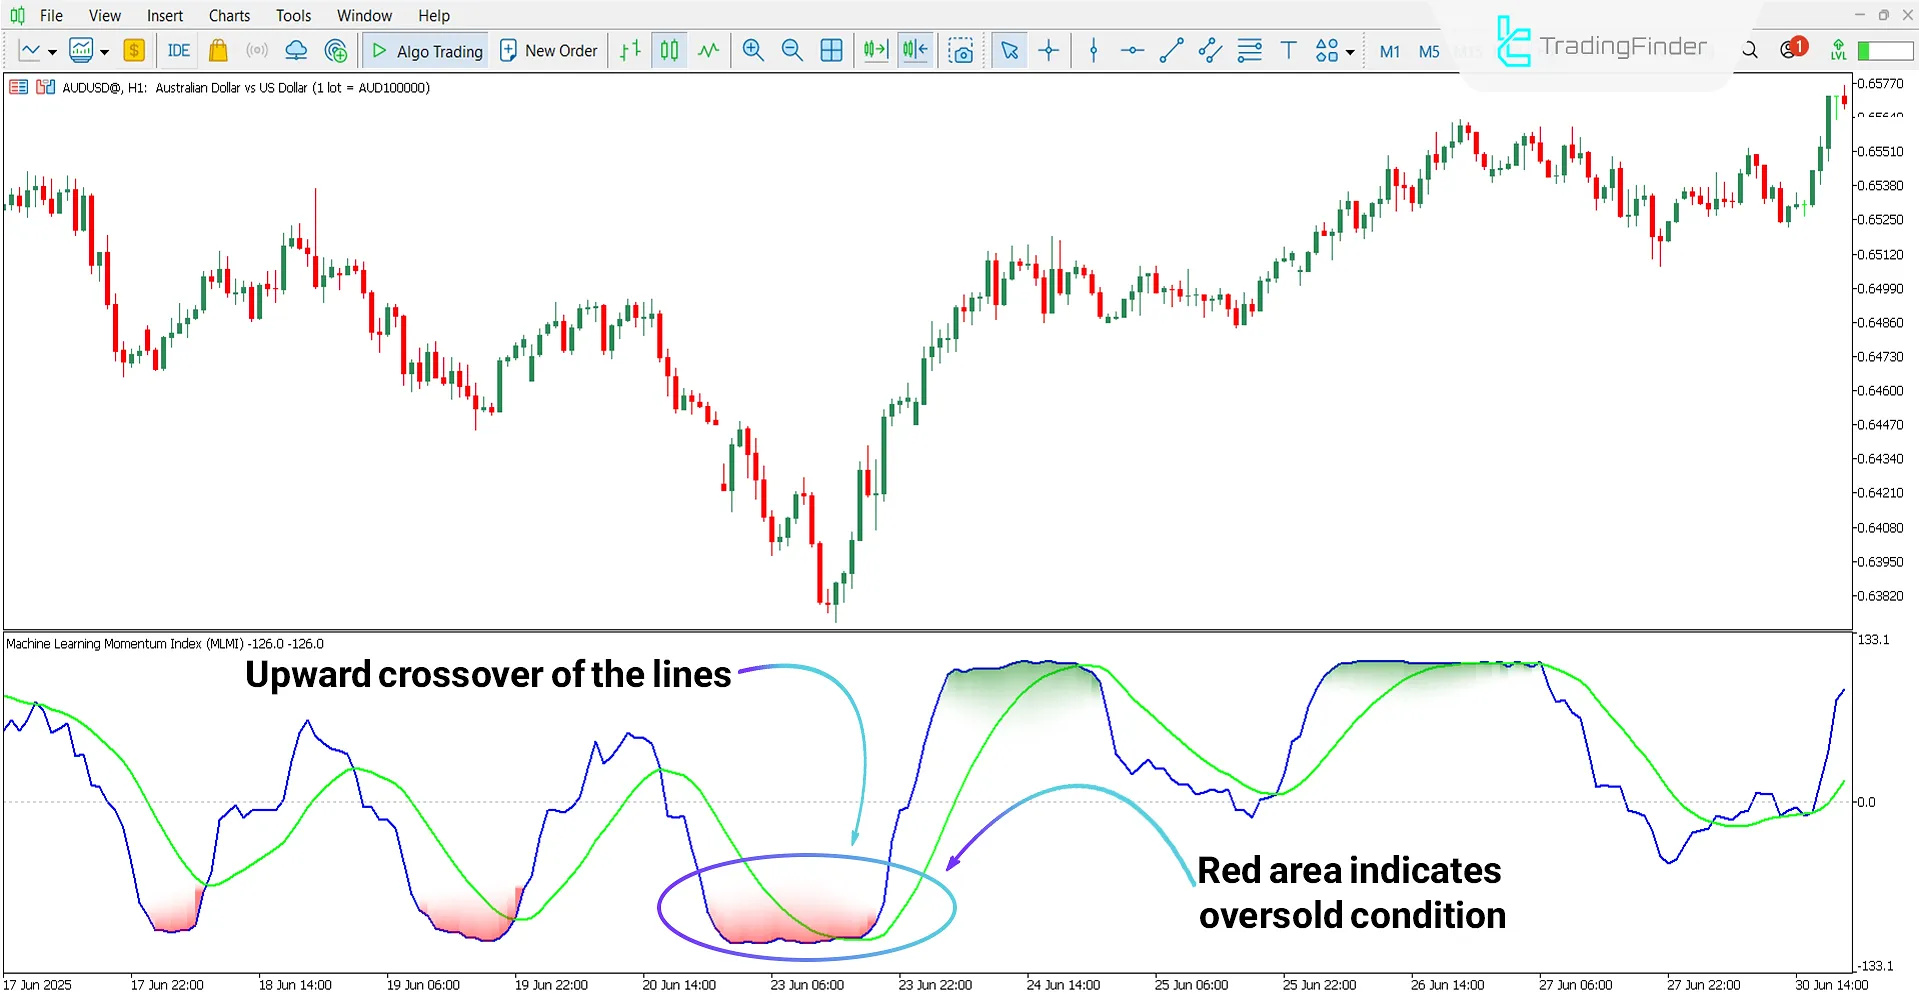
Thus, an upward crossover of the lines indicates a buy position, while a downward crossover signals a sell position.
Buy Signal
According to the 1-hour chart of AUD/USD, the red area displays the oversold condition.
In this situation, the upward crossover of oscillator lines indicates a return in momentum and the possible start of a corrective move or short-term trend reversal.

Sell Signal
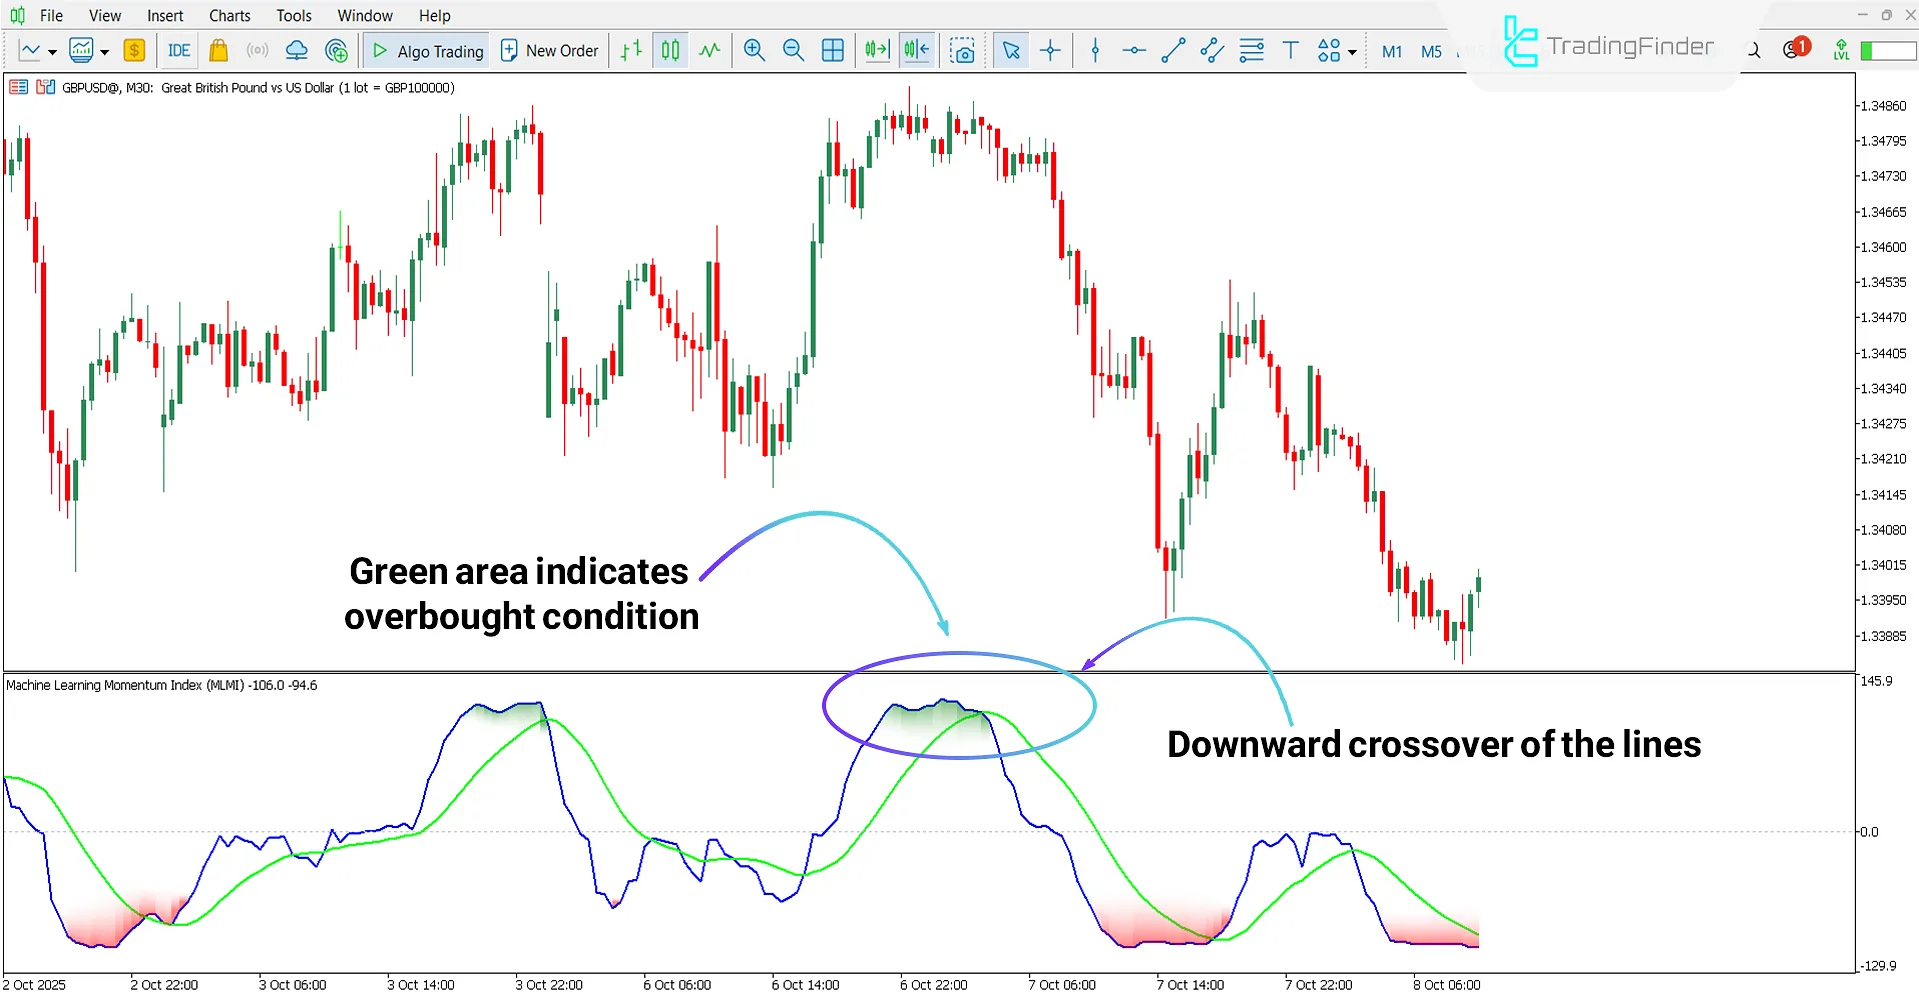
Based on the 30-minute chart of GBP/USD, the highlighted area represents overbought conditions, shown in green.
Moreover, the downward crossover of oscillator lines serves as a potential sell signal, indicating the beginning of a corrective phase or reversal.

Machine Learning Momentum Index Indicator Settings
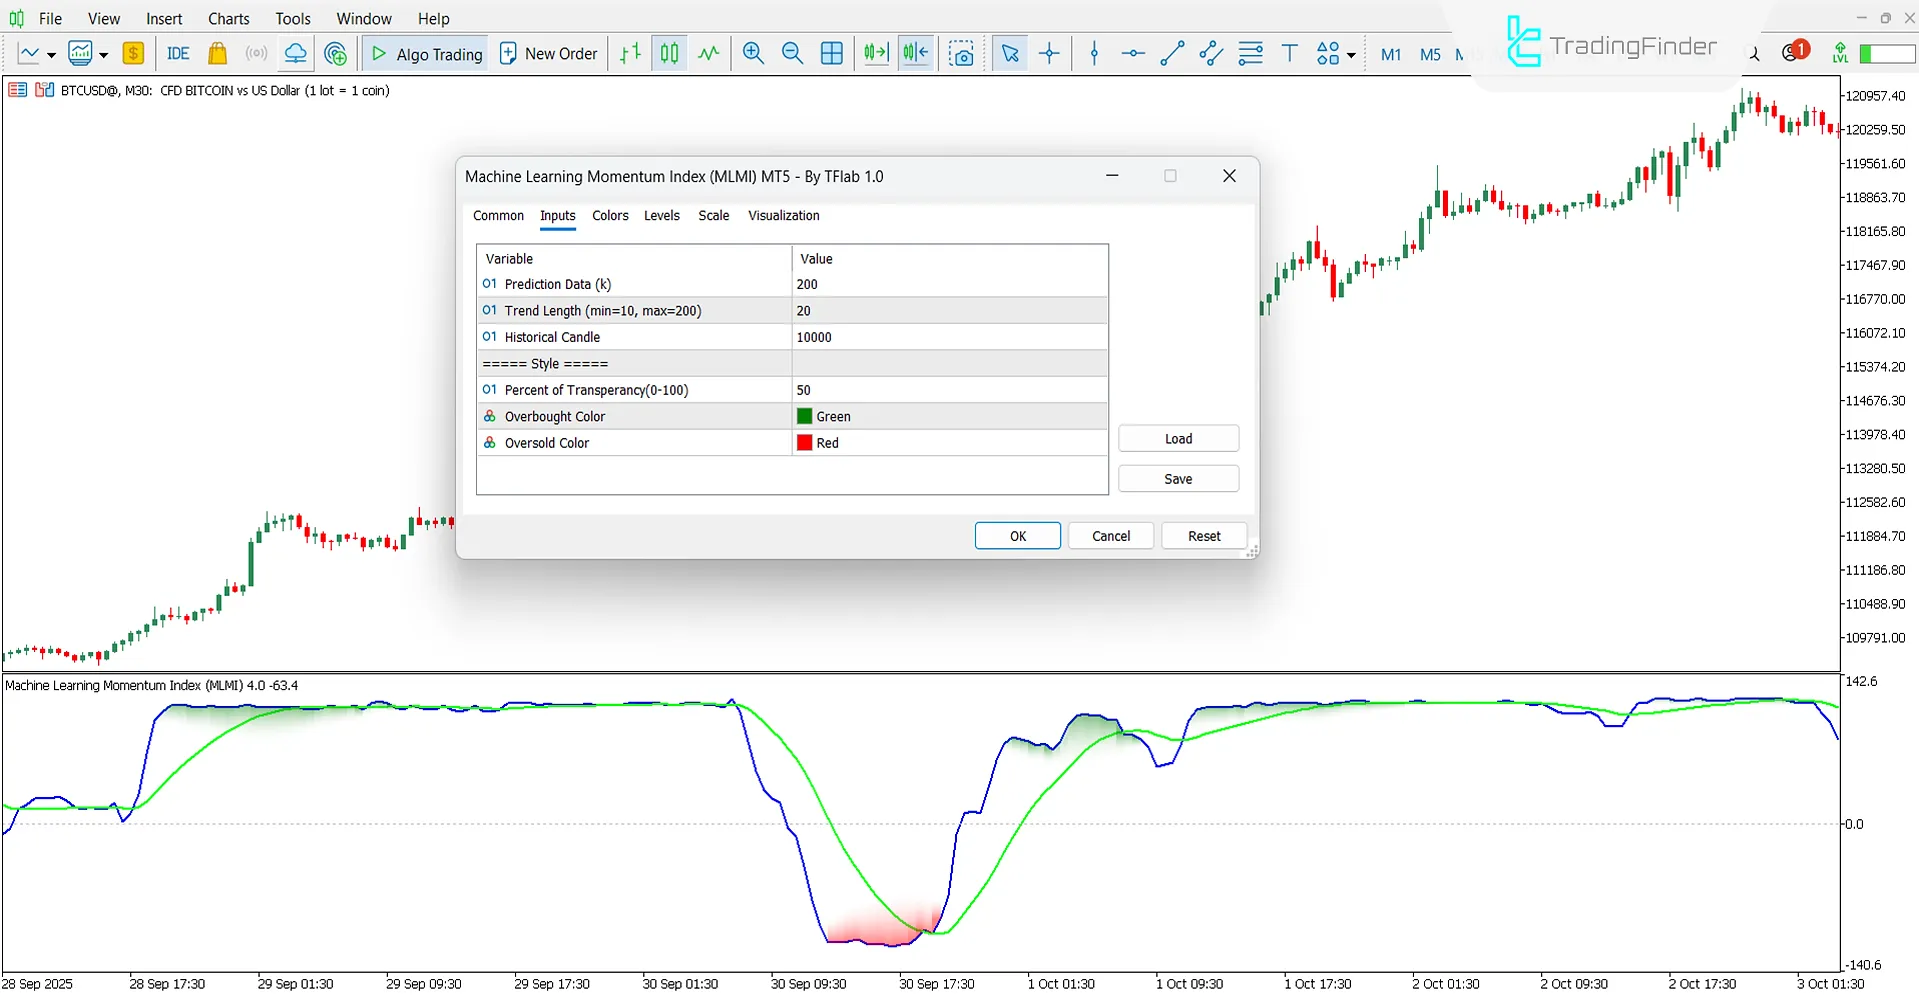
The settings section of the Machine Learning Momentum Index Indicator is as follows:

- Prediction Data: Value of "K" in the K-NN algorithm
- Trend Length (min=10, max=200): Momentum calculation period for indicator sensitivity
- Historical Candle: Number of candles for training and historical data analysis
- Percent of Transparency (0–100): Transparency level of overbought and oversold colors in oscillator area
- Overbought Color: Color of overbought zones in bullish or strong momentum conditions
- Oversold Color: Color of oversold zones in bearish or weak momentum conditions
Conclusion
The Machine Learning Momentum Index Indicator is designed based on momentum analysis and artificial intelligence algorithms to predict market direction.
By using RSI, WMA, and the K-NN model, this tool processes historical data and identifies potential future trends.
Additionally, the oscillator highlights overbought and oversold areas in distinct colors, while line crossovers are interpreted as entry and exit signals.
With multi-timeframe capability and precise analysis of historical data, this indicator is an effective tool for scalping, day trading, and swing trading styles.
Machine Learning Momentum Index Indicator MT5 PDF
Machine Learning Momentum Index Indicator MT5 PDF
Click to download Machine Learning Momentum Index Indicator MT5 PDFWhen is the sell signal generated?
A sell signal occurs when the lines experience a downward crossover within the overbought area.
Can this tool be used in short-term timeframes?
Yes, the Machine Learning Momentum Index Indicator supports multi-timeframe functionality and can be used across all time intervals.


