


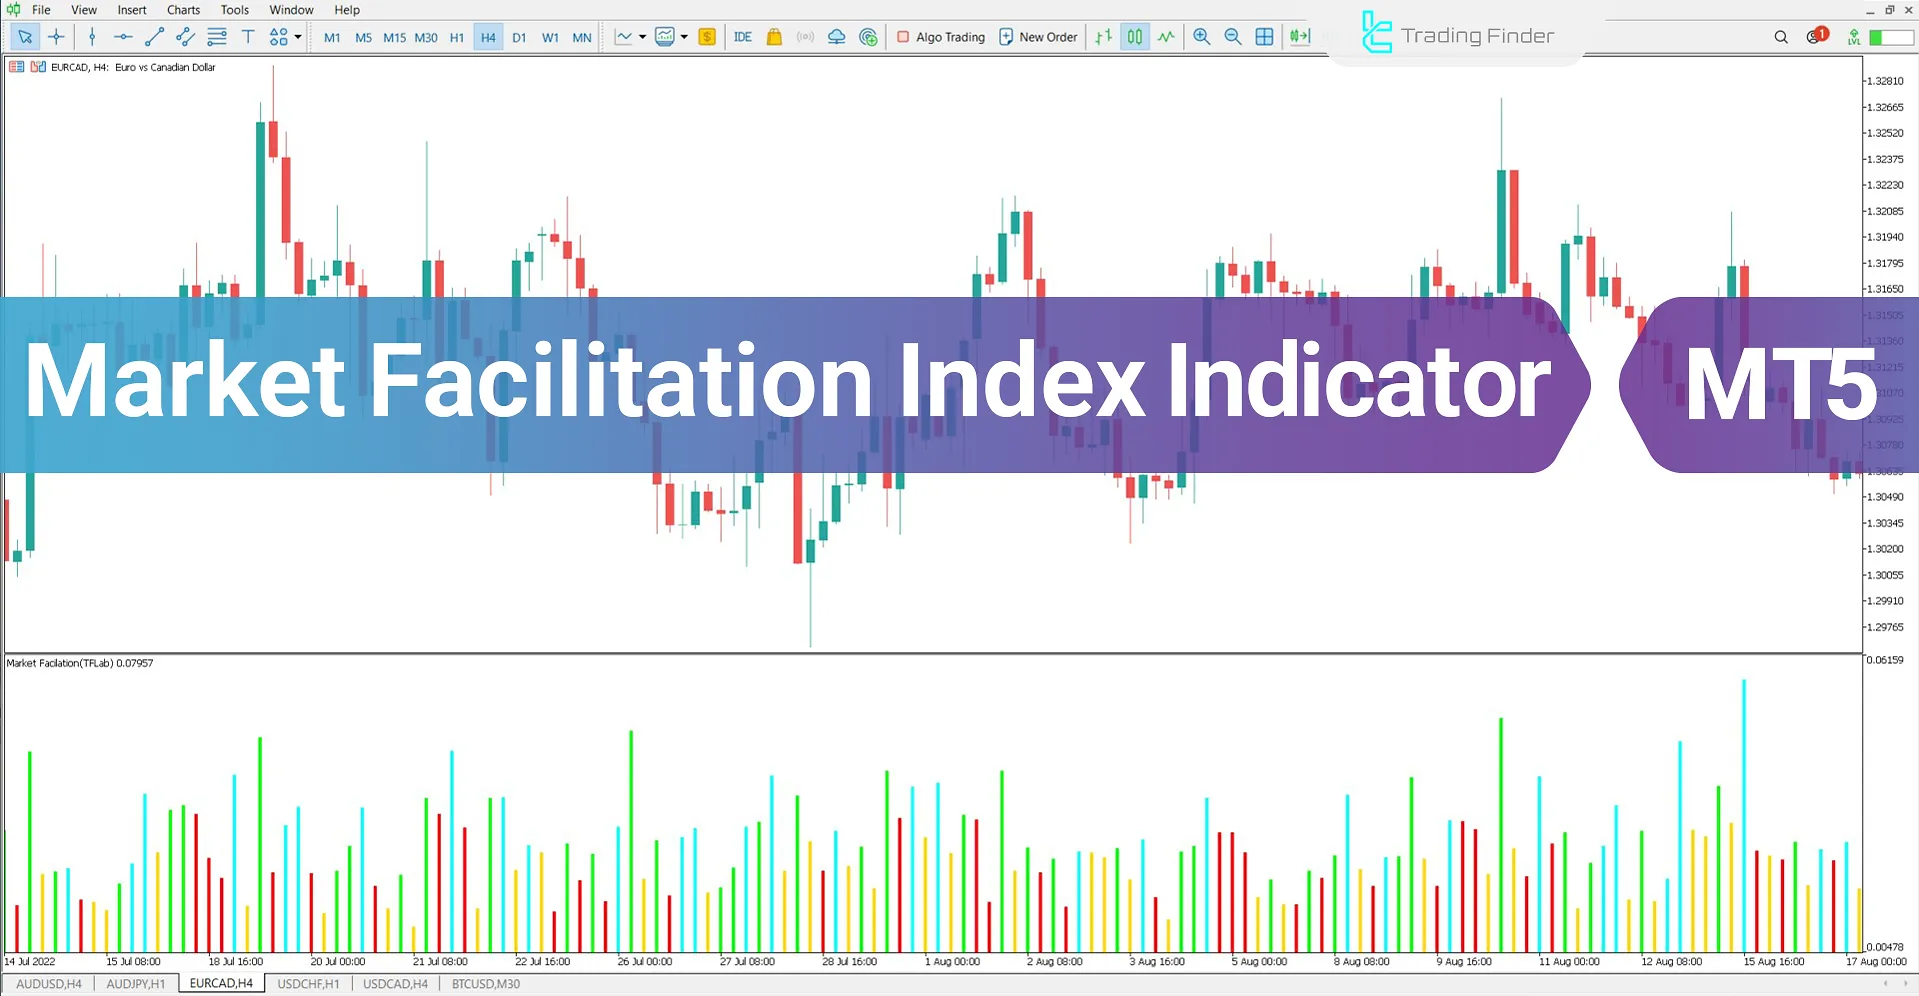
The Market Facilitation Index (MFI) Indicator is one of the MetaTrader 5 indicators, designed for market behavior analysis and assessing price movement strength based on trading volume.
This tool evaluates market conditions by analyzing trading volume and price fluctuations, and determines the likelihood of trend continuation or reversal in markets such as Forex.
The Market Facilitation Index (MFI) is calculated by dividing the candlestick range (High - Low) by its tick volume. This formula highlights the relationship between price movement and market activity, helping traders evaluate trend strength.
The results are displayed as colored histogram bars, providing a visual representation of market conditions and potential trend changes.
MFI Indicator Specifications Table
The table below summarizes the specifications of the Market Facilitation Index (MFI) Indicator.
Indicator Categories: | Oscillators MT5 Indicators Currency Strength MT5 Indicators Trading Assist MT5 Indicators |
Platforms: | MetaTrader 5 Indicators |
Trading Skills: | Intermediate |
Indicator Types: | Reversal MT5 Indicators |
Timeframe: | Multi-Timeframe MT5 Indicators |
Trading Style: | Intraday MT5 Indicators |
Trading Instruments: | Forex MT5 Indicators Crypto MT5 Indicators Stock MT5 Indicators Forward MT5 Indicators Share Stock MT5 Indicators |
MFI Indicator at a Glance
In the Market Facilitation Index (MFI) Indicator, each histogram bar represents current market conditions, indicating trend strength and trader participation:
- Green Bar: Increasing volume and trend continuation, suggesting new traders enter the market and a higher probability of continuing price movement.
- Yellow Bar: Declining trader interest, increasing the chance of a range-bound (sideways) market.
- Red Bar: Decreasing buyer and seller activity, signaling market weakness.
- Blue Bar: The most important signal, indicating increased trading activity and potential trend reversal.
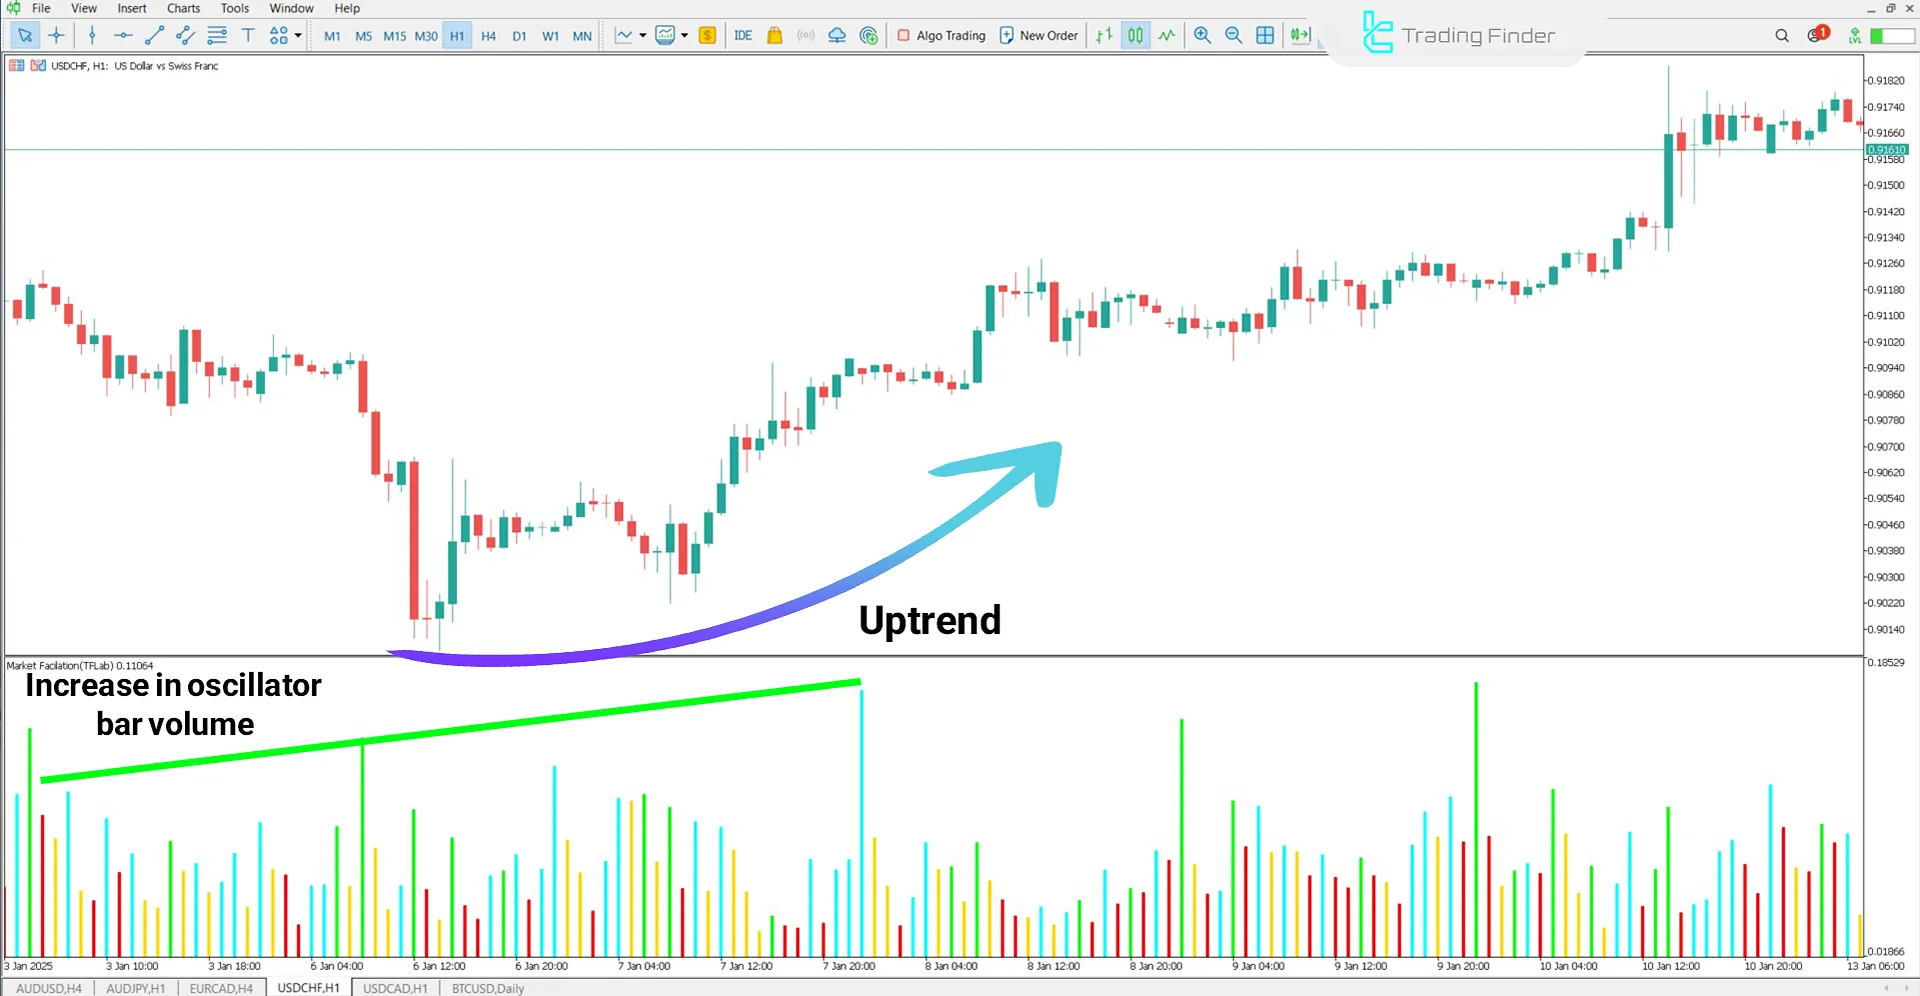
MFI Indicator in an Uptrend
In the USD/CHF currency pair, an increase in histogram bar volume within the Market Facilitation Index (MFI) Indicator signals an uptrend.
The growing volume bars confirm higher trader participation, validating the continuation of the upward movement. Traders can monitor this to assess trend sustainability and identify potential market shifts.
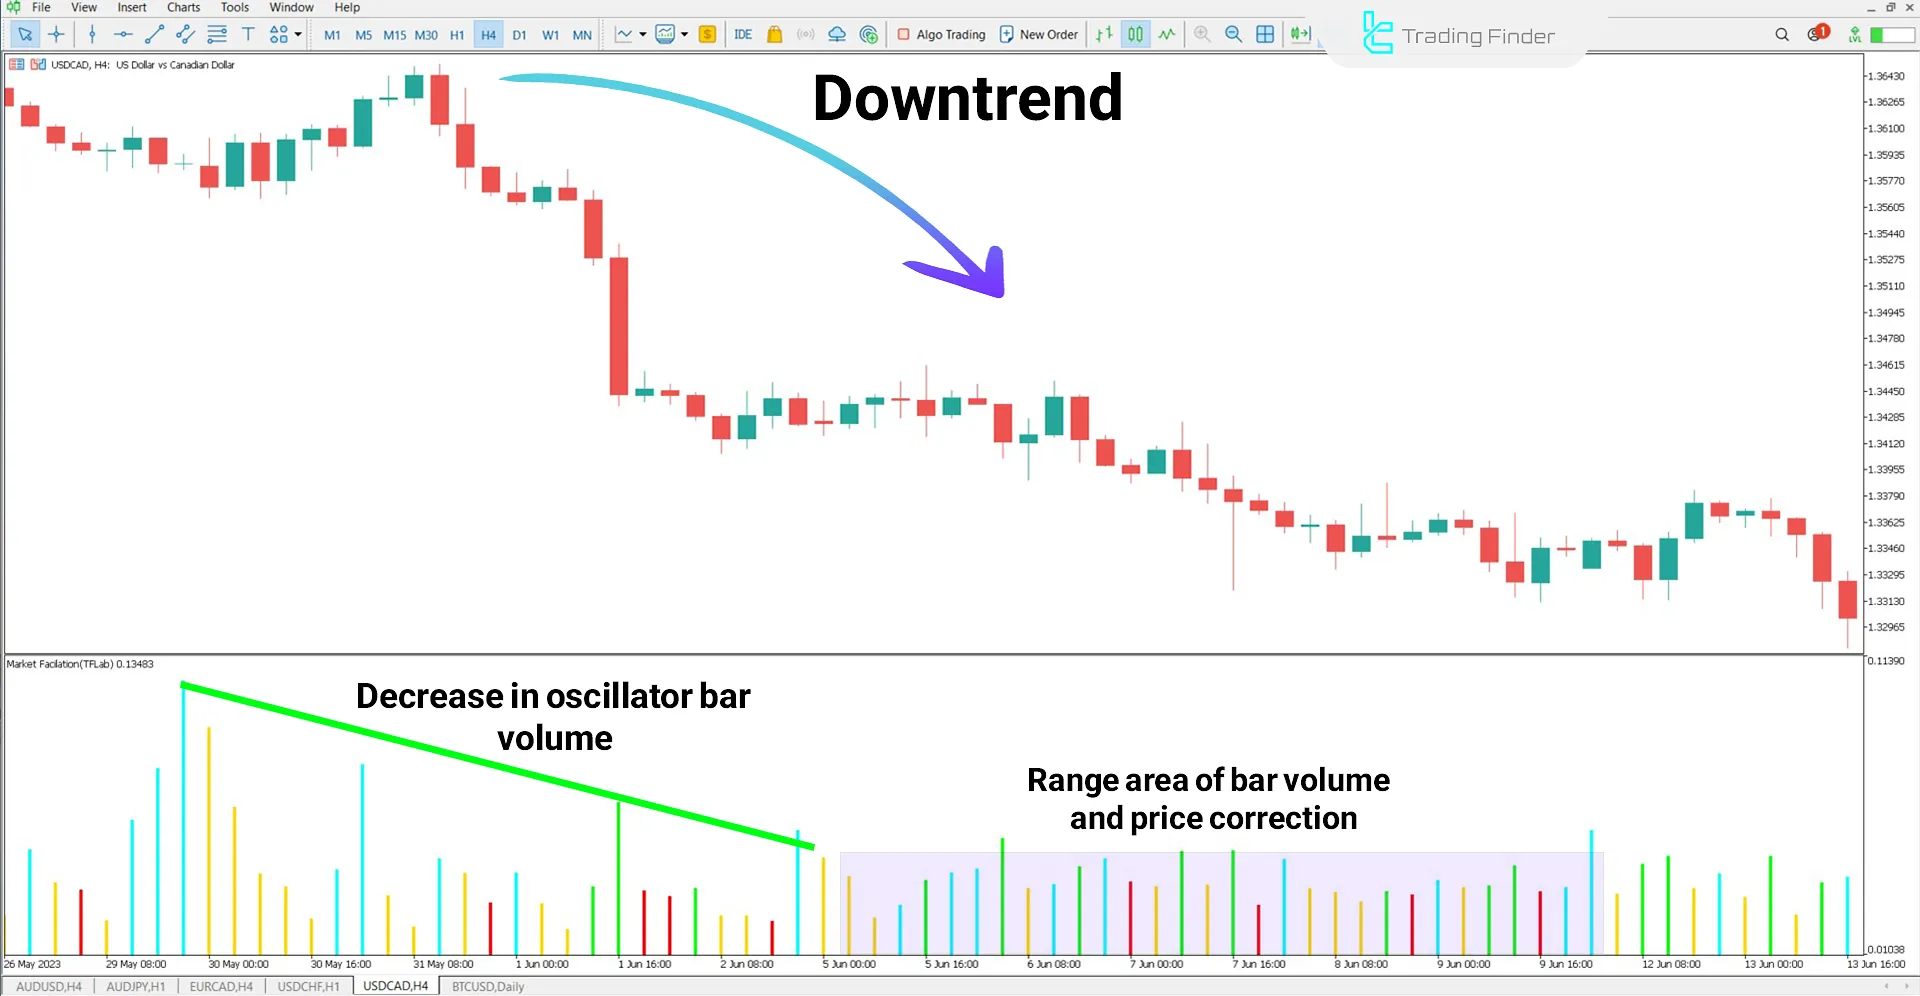
MFI Indicator in a Downtrend
After failing to establish a new high in a downtrend, the market enters a corrective phase. In this situation, the Market Facilitation Index (MFI) histogram bars show decreasing volume, indicating a decline in bearish momentum.
This condition may lead to a price stabilization zone or increase the chances of a trend reversal.
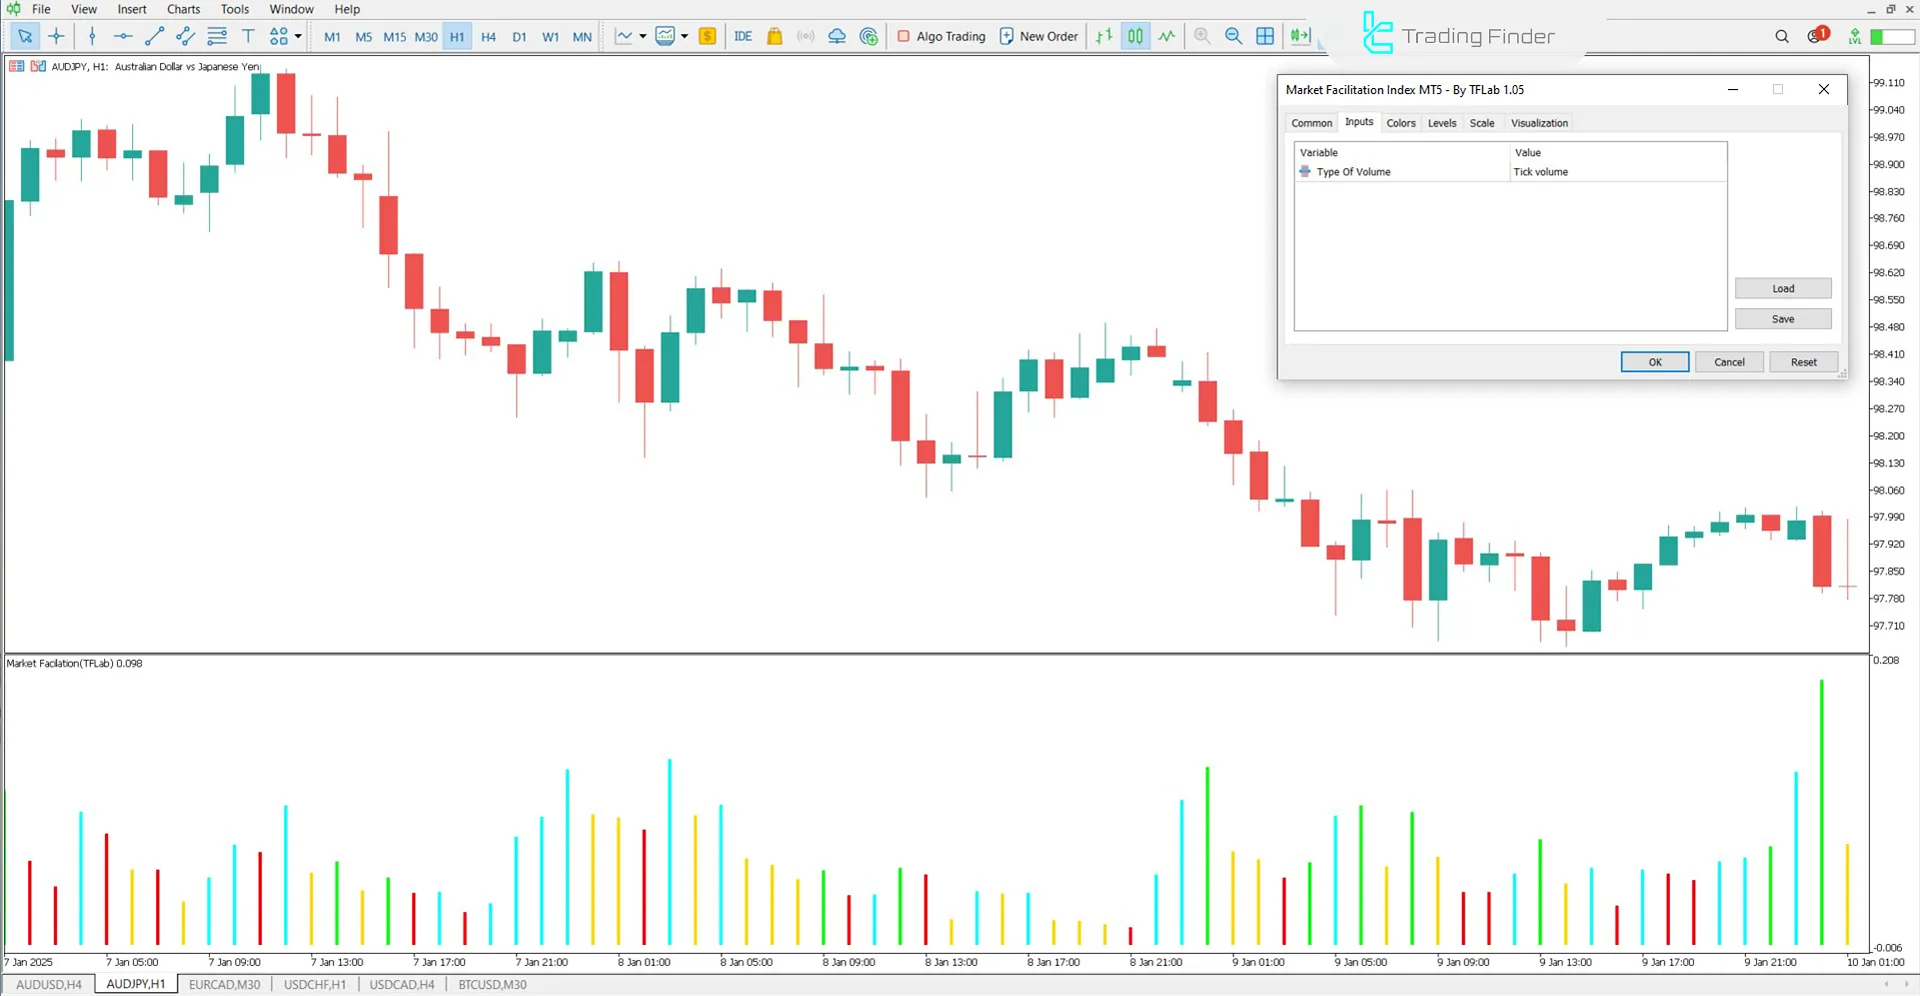
MFI Indicator Settings
The following image displays the detailed settings section of the Market Facilitation Index (MFI) Indicator:
- Type of Volume: Defines the method used for volume calculation.
Conclusion
The Market Facilitation Index (MFI) Indicator is a MetaTrader 5 oscillator designed to analyze market conditions by evaluating trading volume and price fluctuations.
This indicator uses colored histogram bars to indicate the strength of the trend and trader participation, offering valuable information about potential trend continuation or reversal in technical analysis.
Market Facilitation Index MFI MT5 PDF
Market Facilitation Index MFI MT5 PDF
Click to download Market Facilitation Index MFI MT5 PDFCan the Market Facilitation Index (MFI) Indicator be used to identify uptrends and downtrends?
Yes, increasing green and blue bars typically indicate a continuation of the uptrend or a potential trend reversal. In contrast, red and yellow bars suggest momentum loss and the possibility of consolidation or correction.
Is the Market Facilitation Index (MFI) Indicator suitable for beginner traders?
Yes, beginner traders can use this indicator alongside volume and trend indicators to develop a better understanding of price movements.


