![Market Structure Breaker Indicator MT5 Download - Free - [TradingFinder]](https://cdn.tradingfinder.com/image/619743/13-248-en-market-structure-breaker-mt5-01.webp)
![Market Structure Breaker Indicator MT5 Download - Free - [TradingFinder] 0](https://cdn.tradingfinder.com/image/619743/13-248-en-market-structure-breaker-mt5-01.webp)
![Market Structure Breaker Indicator MT5 Download - Free - [TradingFinder] 1](https://cdn.tradingfinder.com/image/619742/13-248-en-market-structure-breaker-mt5-02.webp)
![Market Structure Breaker Indicator MT5 Download - Free - [TradingFinder] 2](https://cdn.tradingfinder.com/image/619739/13-248-en-market-structure-breaker-mt5-03.webp)
![Market Structure Breaker Indicator MT5 Download - Free - [TradingFinder] 3](https://cdn.tradingfinder.com/image/619738/13-248-en-market-structure-breaker-mt5-04.webp)
The Market Structure Breaker Indicator, as a specialized tool in technical analysis, identifies real areas where price direction changes.
This indicator, developed based on Price Action principles and trading models such as “ICT” and Smart Money, is capable of displaying the exact moment of a market structure break directly on the chart.
The main applications of this indicator include determining the dominant trend, identifying suitable entry or exit zones, and confirming structural changes in the market.
Market Structure Breaker Indicator Specification Table
The specifications of the Market Structure Breaker Indicator are as follows.
Indicator Categories: | Smart Money MT5 Indicators Signal & Forecast MT5 Indicators ICT MT5 Indicators |
Platforms: | MetaTrader 5 Indicators |
Trading Skills: | Elementary |
Indicator Types: | Reversal MT5 Indicators |
Timeframe: | Multi-Timeframe MT5 Indicators |
Trading Style: | Swing Trading MT5 Indicators Scalper MT5 Indicators Day Trading MT5 Indicators |
Trading Instruments: | Forex MT5 Indicators Crypto MT5 Indicators Stock MT5 Indicators |
Market Structure Breaker Indicator at a Glance
In this indicator, when a high or low is broken, a line is drawn on the chart to display the structural break and extended as a dashed line.
Then, if the body of a bullish candlestick crosses this dashed line upward, it serves as a buy signal or indication of bullish movement. Conversely, if the body of a bearish candlestick breaks the dashed line downward, it acts as a sell signal and indicates the start of a downward move.
Buy Signal
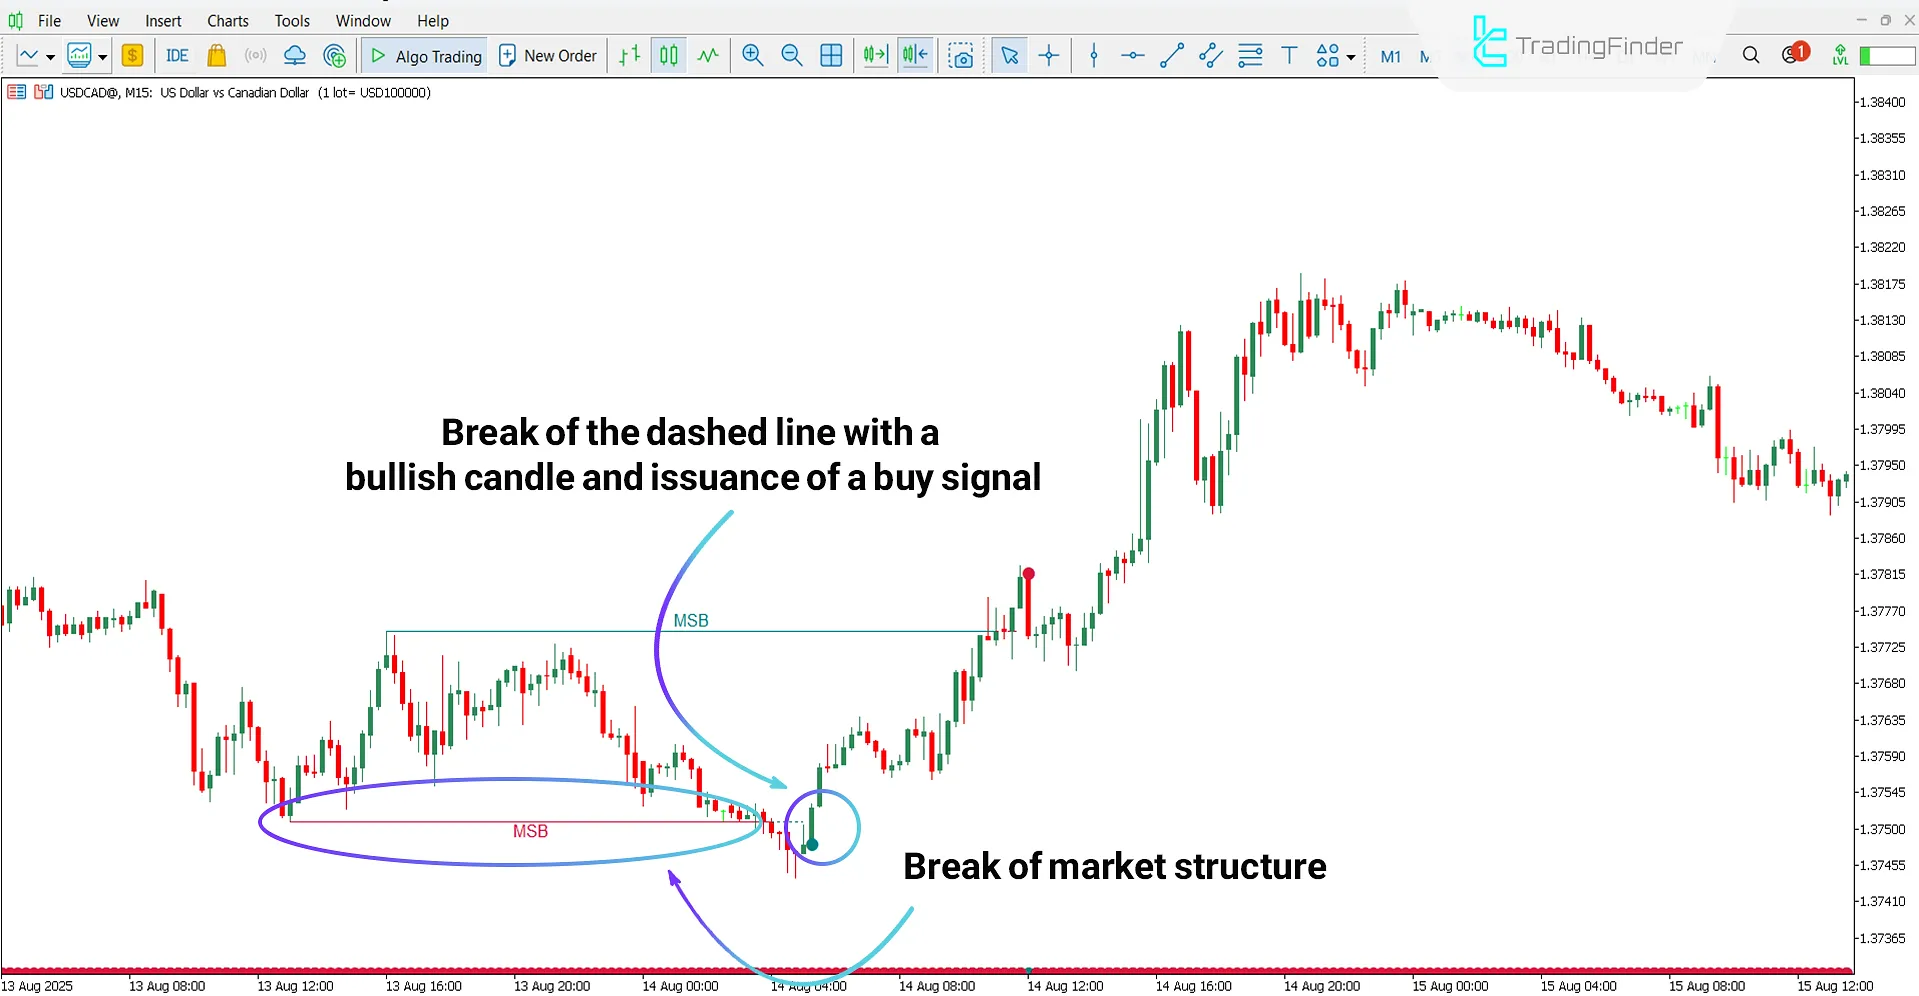
Based on the 15-minute USD/CAD chart, a price low is broken and marked as “MSB”, with the same level extended as a dashed line.
In this scenario, the dashed line is broken by the body of a bullish candlestick, and the indicator issues a buy signal.

Sell Signal
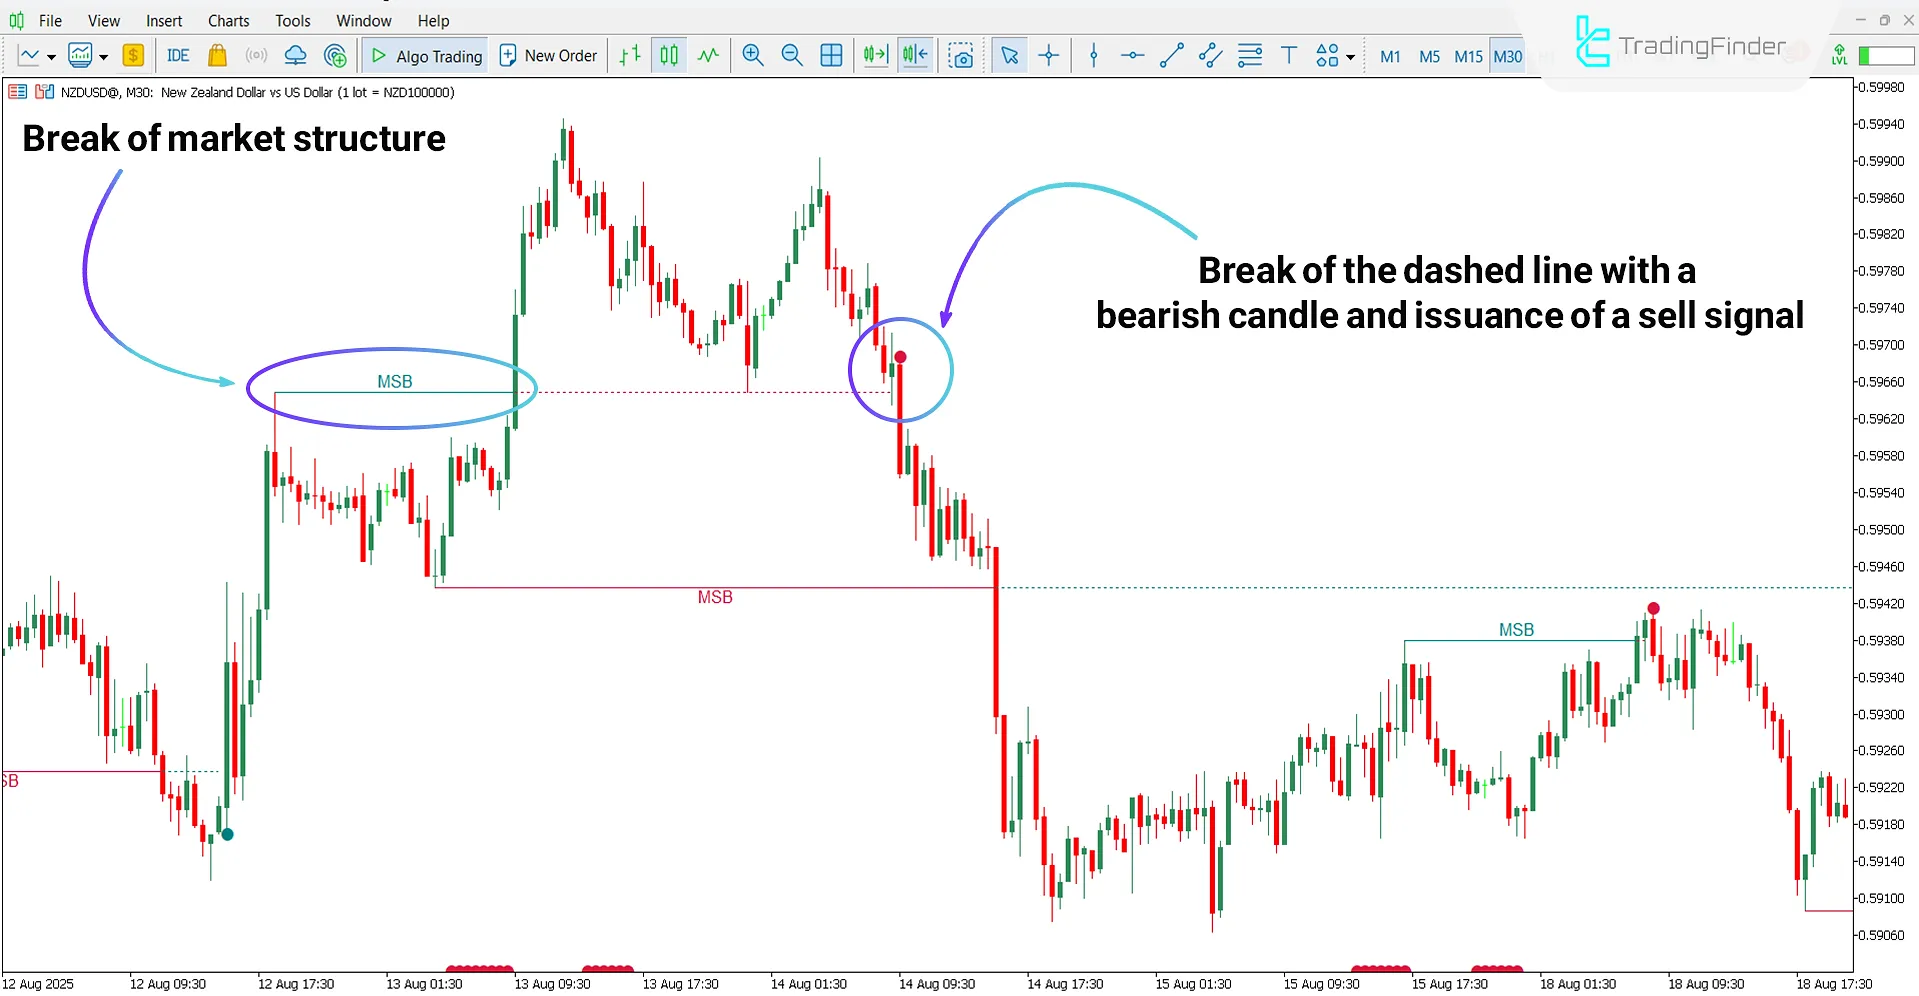
According to the 30-minute NZD/USD chart, a price high is broken and extended as a dashed line on the chart.
Then, the body of a bearish candlestick breaks this dashed line downward, and the indicator displays a sell signal with a red marker.

Market Structure Breaker Indicator Settings
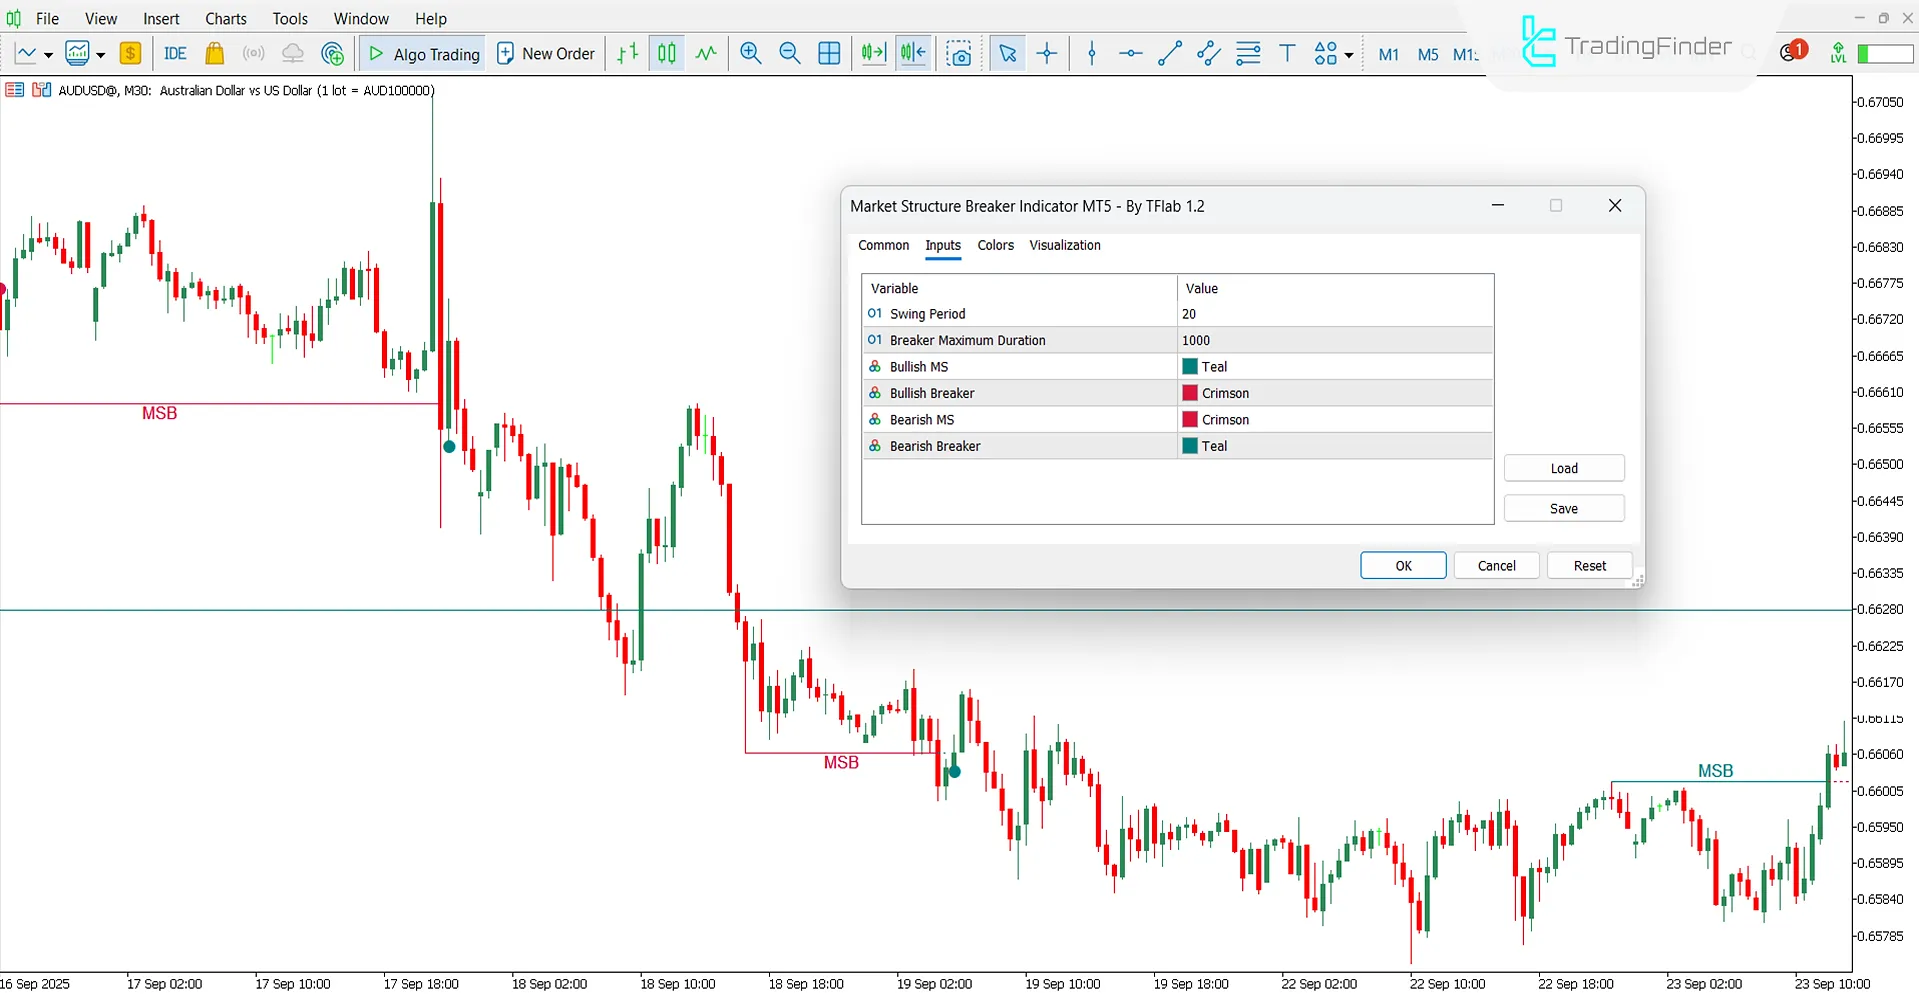
The settings of the Market Structure Breaker Indicator are as follows:

- Swing Period: Number of base candlesticks used to identify structural highs and lows
- Breaker Maximum Duration: Maximum number of allowed candlesticks for extending the break level display
- Bullish MS: Color of bullish structure level
- Bullish Breaker: Color of bullish break signal
- Bearish MS: Color of bearish structure level
- Bearish Breaker: Color of bearish break signal
Conclusion
The Market Structure Breaker Indicator is designed to accurately display price structure break points. This tool identifies the market structure break, plots it on the chart, and then extends it as a dashed line.
The breakout of this dashed line by bullish or bearish candlestick bodies determines the type of trading signal issued.
Market Structure Breaker Indicator MT5 PDF
Market Structure Breaker Indicator MT5 PDF
Click to download Market Structure Breaker Indicator MT5 PDFIs this indicator usable only in the Forex market?
No, the Market Structure Breaker Indicator can be used across all financial markets.
How is the sell signal generated?
When the body of a bearish candlestick cuts through the dashed market structure break line downward.


