![Market Way Indicator for MetaTrader 5 Download – [TradingFinder]](https://cdn.tradingfinder.com/image/580498/11-115-en-market-way-mt5-01.webp)
![Market Way Indicator for MetaTrader 5 Download – [TradingFinder] 0](https://cdn.tradingfinder.com/image/580498/11-115-en-market-way-mt5-01.webp)
![Market Way Indicator for MetaTrader 5 Download – [TradingFinder] 1](https://cdn.tradingfinder.com/image/580465/11-115-en-market-way-mt5-02.webp)
![Market Way Indicator for MetaTrader 5 Download – [TradingFinder] 2](https://cdn.tradingfinder.com/image/580467/11-115-en-market-way-mt5-03.webp)
![Market Way Indicator for MetaTrader 5 Download – [TradingFinder] 3](https://cdn.tradingfinder.com/image/580468/11-115-en-market-way-mt5-04.webp)
The Market Way Indicator is an advanced tool for analyzing buying and selling pressure in the forex and cryptocurrency markets, available on MetaTrader 5.
Technical analysis traders can apply this indicator to the chart to evaluate buy and sell pressure and use the created waves during increased pressure to enter trades.
Market Way Indicator Table
Below are the details of the Market Way Indicator:
Indicator Categories: | Oscillators MT5 Indicators Signal & Forecast MT5 Indicators Trading Assist MT5 Indicators |
Platforms: | MetaTrader 5 Indicators |
Trading Skills: | Advanced |
Indicator Types: | Trend MT5 Indicators Entry & Exit MT5 Indicators Reversal MT5 Indicators |
Timeframe: | Multi-Timeframe MT5 Indicators |
Trading Style: | Intraday MT5 Indicators Scalper MT5 Indicators Day Trading MT5 Indicators |
Trading Instruments: | Forex MT5 Indicators Crypto MT5 Indicators Stock MT5 Indicators Indices MT5 Indicators Share Stock MT5 Indicators |
Market Way Indicator at a Glance
The Market Way Indicator is an advanced tool for forex and crypto traders that uses oscillators to measure buying and selling pressure and forecast the probable price direction.
Through advanced calculations, this indicator provides traders with valuable insights into the strength of buyers and sellers:
- Applying a moving average to the oscillator measures the intensity of buy and sell pressure. When the green line moves positively away from the moving average, the difference is displayed as a blue histogram, indicating the strength of buying pressure;
- When the red line moves negatively away from the moving average, the indicator displays a yellow histogram, showing the intensity of selling pressure relative to the average;
- Blue points in the oscillator window represent the difference between candle open and close prices over a given period. Points above zero indicate buying pressure, while points below zero indicate selling pressure.
By analyzing the combined histograms and oscillator lines, traders can achieve a more professional understanding of the balance between buyers and sellers and the market’s probable direction.
Bullish Trend in the Market Way Indicator
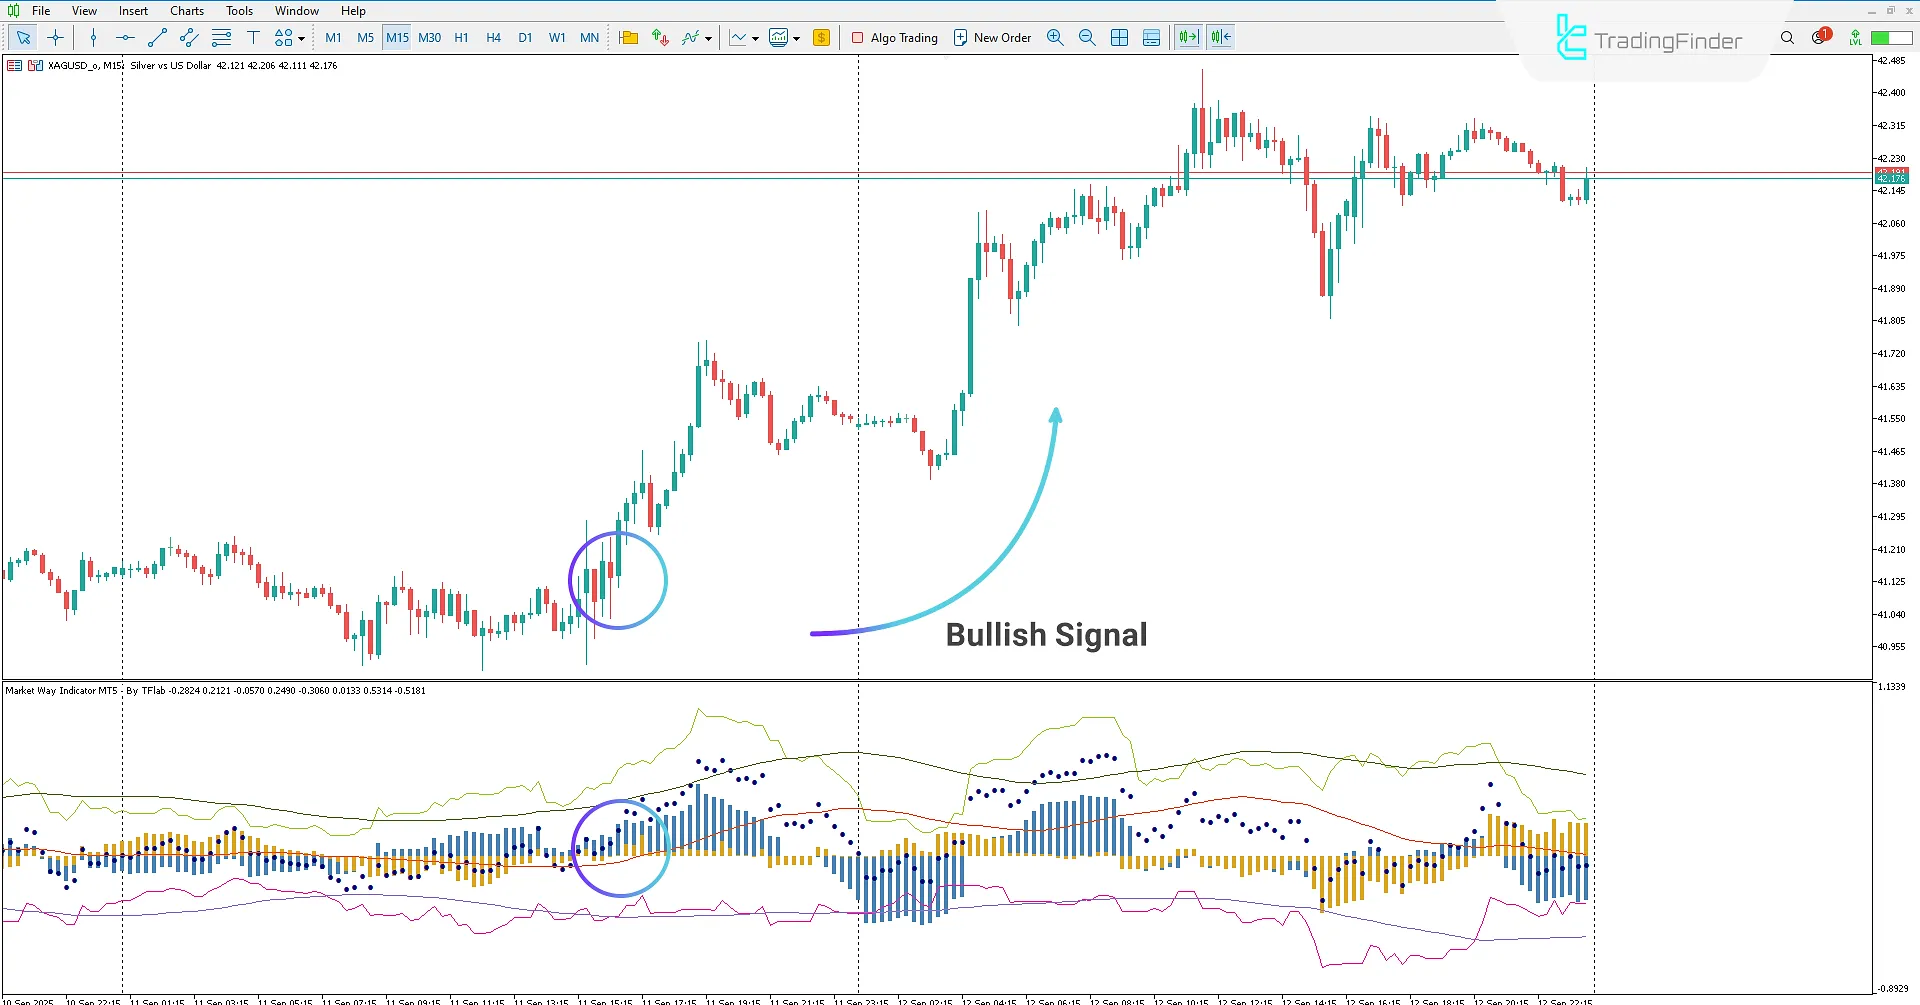
On the 15-minute chart of the XAG/USD symbol, the Market Way Indicator can be used to assess buying pressure.
Traders can apply this indicator on the chart and analyze the oscillator to evaluate buy pressure and, upon identifying a suitable setup, enter a buy trade.
In this chart, blue points are positioned above the zero level, signaling market buying pressure. At the same time, the blue histogram values serve as confirmation of buying pressure, providing a valid buy entry signal.

Bearish Trend in the Market Way Indicator
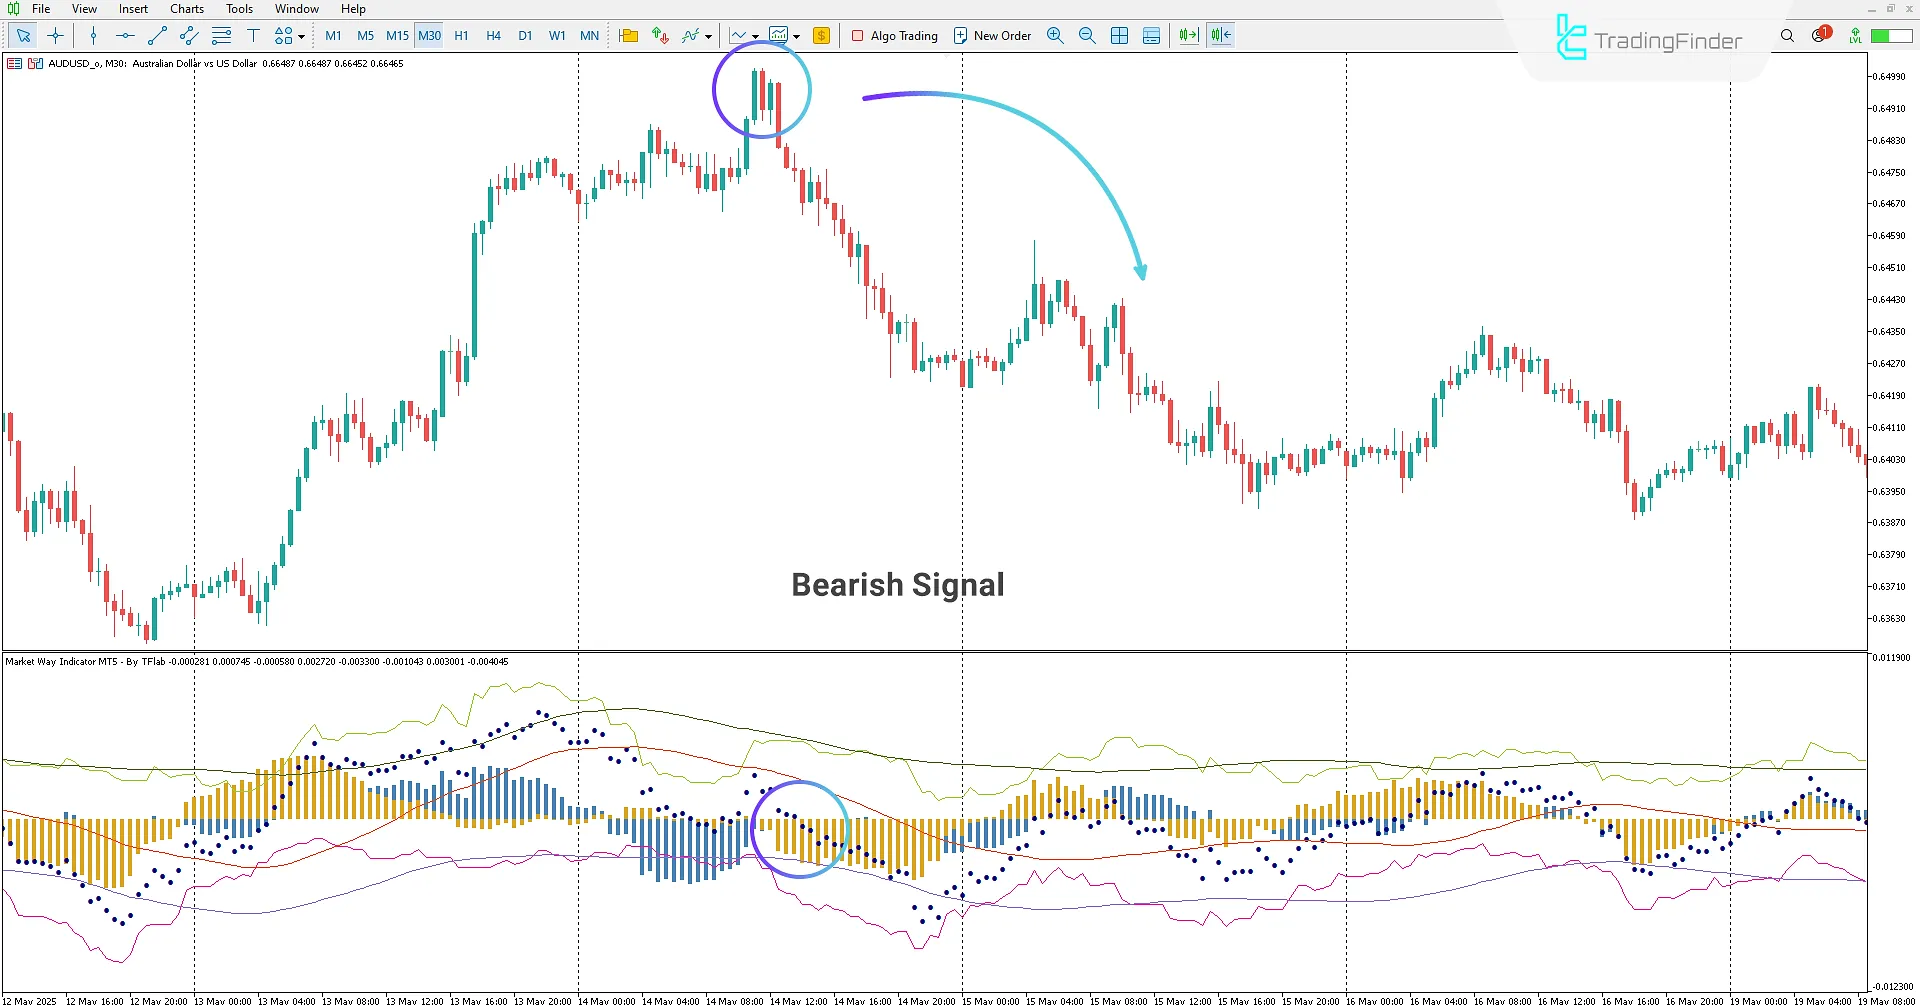
On the 30-minute chart of the AUD/USD pair, traders can detect selling pressure by applying the Market Way Indicator.
In this chart, blue points have moved below the zero level, indicating market selling pressure.
Additionally, traders can observe the increase in selling pressure by reviewing the yellow histogram values, which confirm the strengthening of the bearish trend and a potential short-selling opportunity.

Market Way Indicator Settings
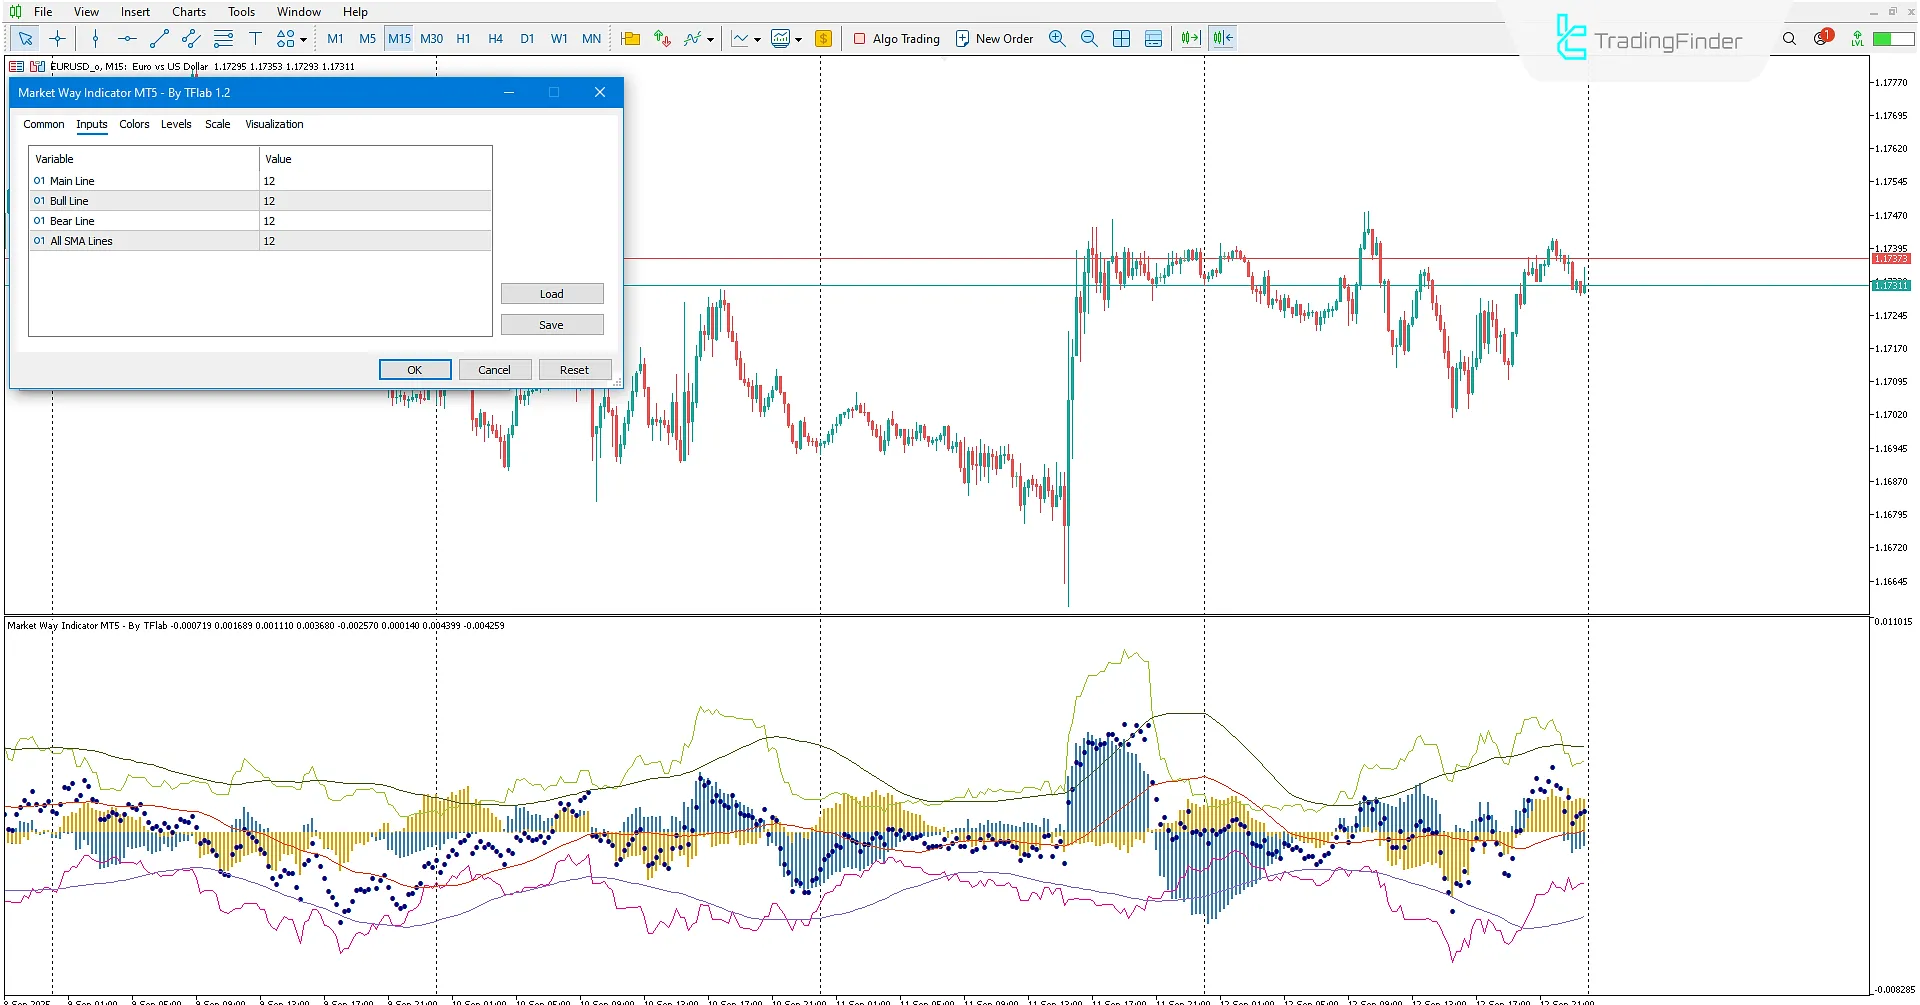
Below are the adjustable settings of the Market Way Indicator:

- Main Line: Defines the period used by the indicator to calculate the difference between candle open and close prices; These calculations generate the dark blue points that represent buy or sell pressure;
- Bull Line: Designed for bullish candles, its period determines how the indicator analyzes and displays upward price movements;
- Bear Line: Related to bearish candles, its period defines how selling pressure and downward price movements are shown on the oscillator;
- All SMA Lines: Defines the moving average period used to measure buy and sell pressure and to display the blue and yellow histograms.
Conclusion
The Market Way Indicator is a practical oscillator for forex and crypto traders that enables analysis of buy and sell pressure in the market.
Through advanced calculations, the indicator displays market pressure as blue points and blue/yellow histograms.
When blue points appear above the zero level, they indicate buying pressure; when they appear below zero, they indicate selling pressure.
The blue histogram reflects the strength of buying pressure, while the yellow histogram reflects the strength of selling pressure.
Market Way Indicator for MetaTrader 5 PDF
Market Way Indicator for MetaTrader 5 PDF
Click to download Market Way Indicator for MetaTrader 5 PDFWhat is the Market Way Indicator?
The Market Way Indicator is a practical oscillator for forex and crypto traders that enables analysis of buy and sell pressure in the market. Using advanced calculations, it provides valuable insights into the strength of buyers and sellers.
How does the Market Way Indicator display buying and selling pressure?
The indicator uses blue points and blue/yellow histograms to display market pressure:
- Blue points above zero indicate buying pressure, while those below zero indicate selling pressure;
- The blue histogram shows buying pressure strength, and the yellow histogram shows selling pressure strength.


