![MARSICD Composite Indicator for MT5 Download – Free – [TradingFinder]](https://cdn.tradingfinder.com/image/399378/13-133-en-marsicd-mt5-01.webp)
![MARSICD Composite Indicator for MT5 Download – Free – [TradingFinder] 0](https://cdn.tradingfinder.com/image/399378/13-133-en-marsicd-mt5-01.webp)
![MARSICD Composite Indicator for MT5 Download – Free – [TradingFinder] 1](https://cdn.tradingfinder.com/image/399376/13-133-en-marsicd-mt5-02.webp)
![MARSICD Composite Indicator for MT5 Download – Free – [TradingFinder] 2](https://cdn.tradingfinder.com/image/399374/13-133-en-marsicd-mt5-03.webp)
![MARSICD Composite Indicator for MT5 Download – Free – [TradingFinder] 3](https://cdn.tradingfinder.com/image/399373/13-133-en-marsicd-mt5-04.webp)
The MARSICD composite indicator is developed to detect market trends and momentum fluctuations within the MetaTrader 5 environment.
This trading toolintegrates two types of adaptive moving averages (AMA/RMA) along with relative strength index (RSI) calculations, delivering precise entry and exit signals.
Additionally, both standard and smoothed versions of RSI are displayed independently.
Specifications Table for MARSICD Oscillator
The following table outlines the key features of the MARSICD Index Indicator.
Indicator Categories: | Oscillators MT5 Indicators Signal & Forecast MT5 Indicators Currency Strength MT5 Indicators RSI Indicators for MetaTrader 5 |
Platforms: | MetaTrader 5 Indicators |
Trading Skills: | Intermediate |
Indicator Types: | Reversal MT5 Indicators |
Timeframe: | Multi-Timeframe MT5 Indicators |
Trading Style: | Swing Trading MT5 Indicators Scalper MT5 Indicators Day Trading MT5 Indicators |
Trading Instruments: | Forex MT5 Indicators Crypto MT5 Indicators Stock MT5 Indicators Forward MT5 Indicators |
MARSICD Index Indicator
The MARSICD composite indicator enables accurate trend movement detection without being affected by typical market noise.
Its high flexibility across various timeframes and changing market conditions makes it suitable for short term and long term trading strategies.
Buy Signal
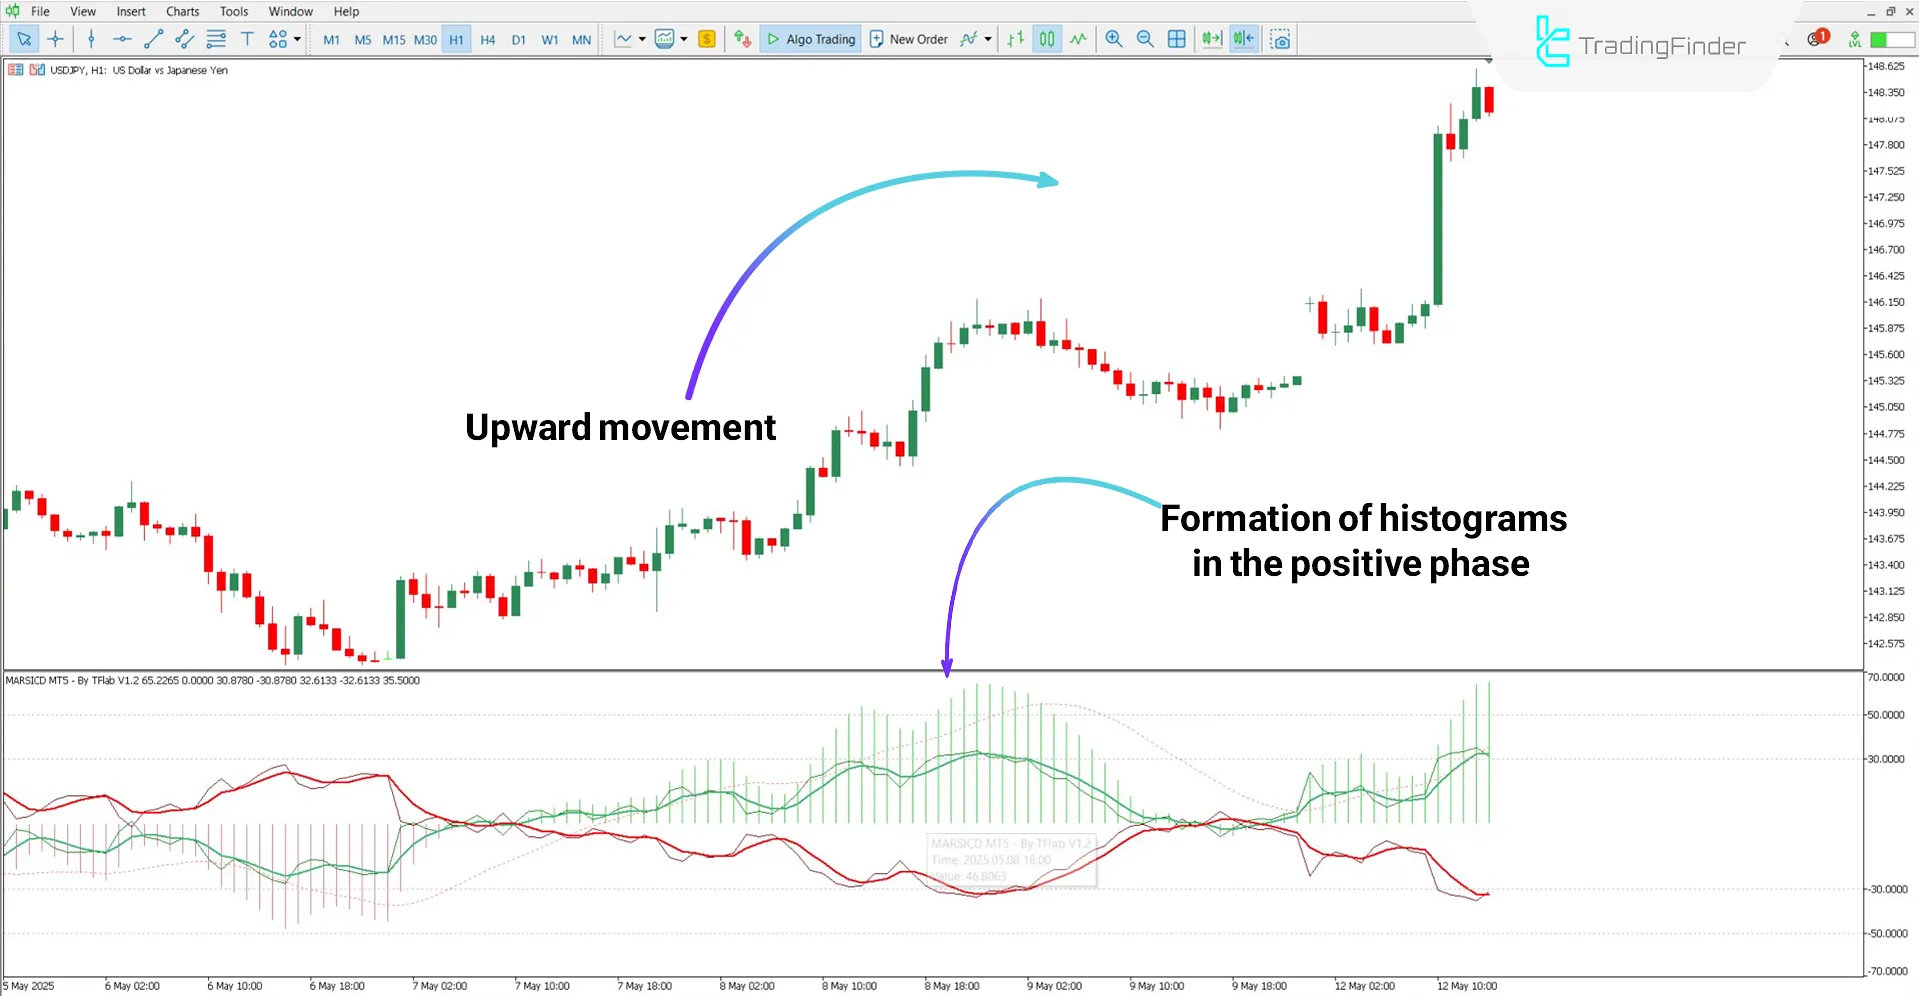
Based on the USD/JPY pair chart in the 1-hour timeframe, the thin green line (ARSI) and the smoothed RSI oscillate in the oscillator’s positive zone.
Meanwhile, high histogram bars have formed in the positive region of the chart, indicating strengthening bullish momentum. These can be interpreted as signals to enter buy positions.

Sell Signal
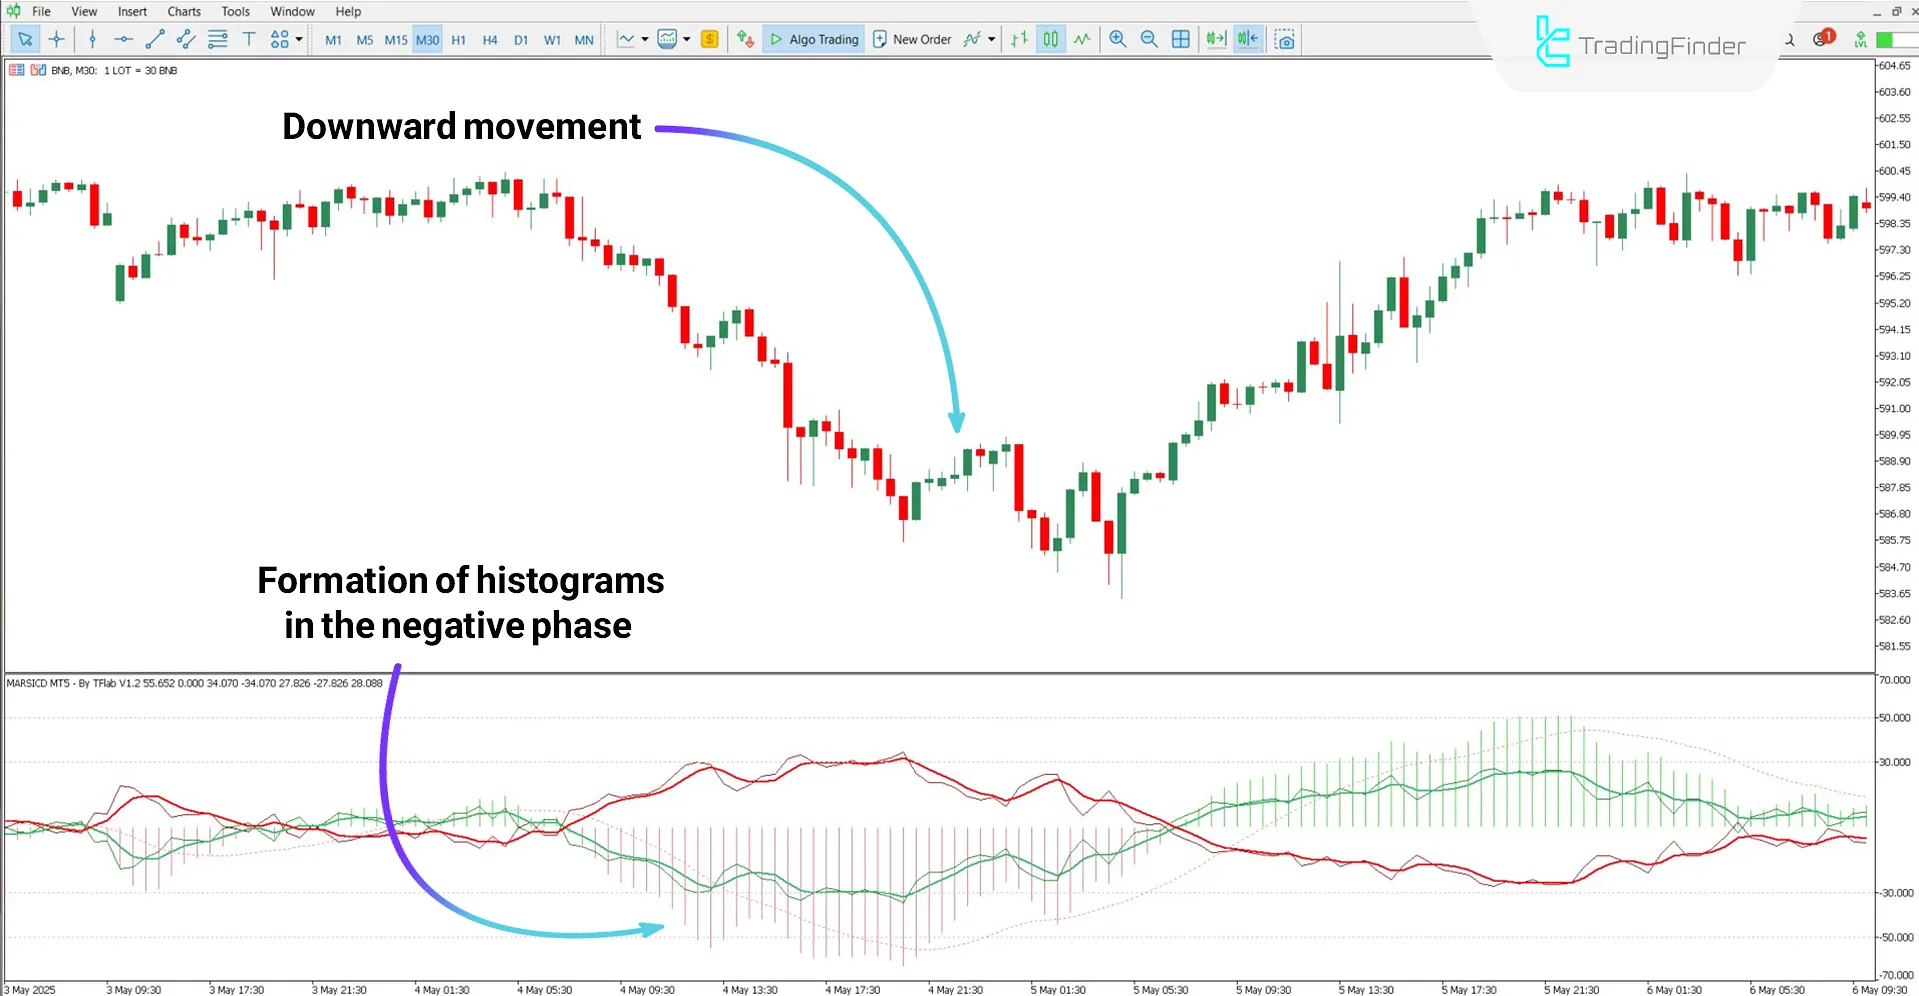
According to the 30-minute chart of the cryptocurrency Binance Coin (BNB), both the "ARSI" line and the smoothed "RSI" have crossed below the central zone of the oscillator and are oscillating in the negative region.
Simultaneously, red histogram bars have appeared in the lower section of the oscillator, reinforcing the intensifying bearish momentum in the market.

MARSICD Indicator Settings
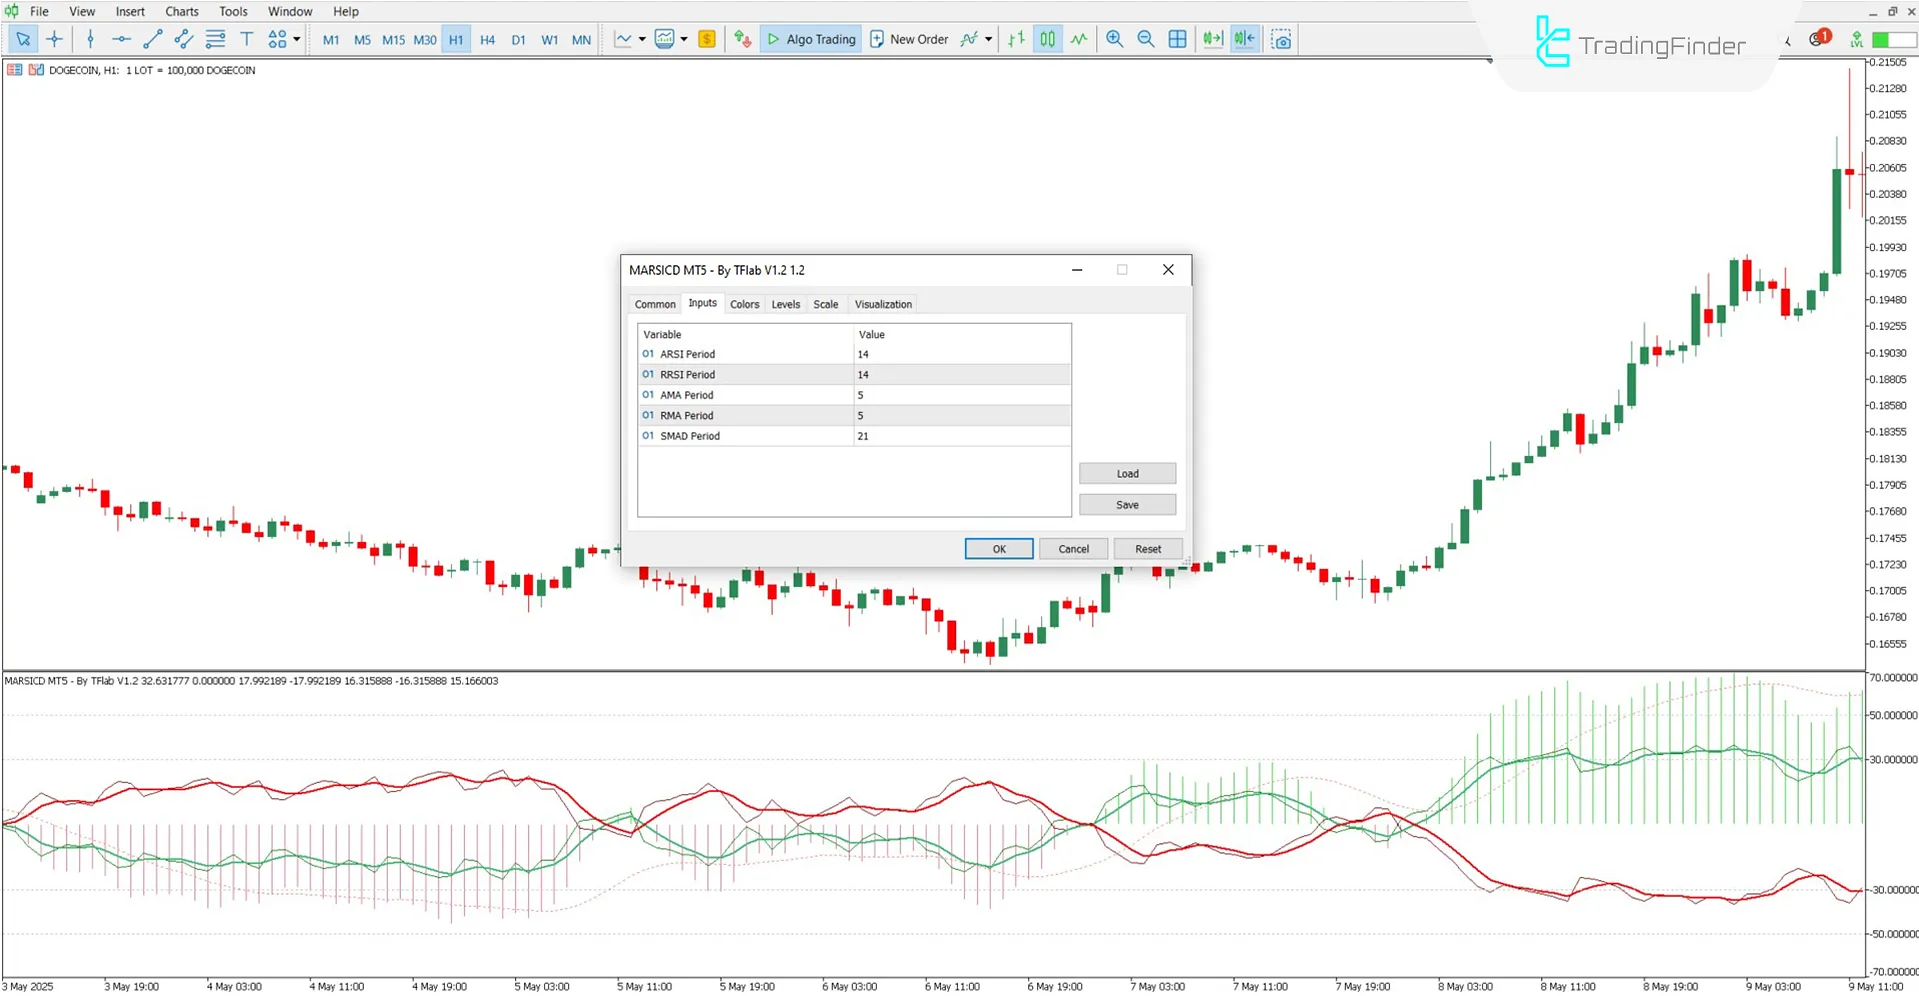
The detailed oscillator settings are shown in the following image:

- ARSI Period: Period for the first RSI
- RRSI Period: Period for the second RSI
- AMA Period: Period for the adaptive moving average
- RMA Period: Period for the regular moving average
- SMAD Period: Smoothing period parameter for the histogram
Conclusion
The MARSICD composite indicator combines three key concepts: Moving Averages, Relative Strength Index (RSI), and Convergence/Divergence.
This tool features histograms with dynamic color and position that indicate the potential start of a new trend, depending on the positive or negative oscillator zone.
Additionally, the MARSICD oscillator can smooth out histogram data and display it as a dotted oscillating line on the chart.
MARSICD Composite MT5 PDF
MARSICD Composite MT5 PDF
Click to download MARSICD Composite MT5 PDFIs the MARSICD oscillator suitable for cryptocurrency markets?
Yes, this indicator is ideal for use across all financial markets.
What does the crossover of red and green lines mean?
It indicates a trend reversal or a change in market direction.


